The media's ability to publish, broadcast, and disseminate news content in a free and open media system remains an important part of democracy (Lawson Reference Lawson2002; McQuail Reference McQuail2010; Norris Reference Norris and Harvey2006). While democracy's minimalist definition excludes media's ability to function without undue influence (Cheibub, Gandhi and Vreeland Reference Cheibub, Gandhi and Vreeland2010; Przeworski et al. Reference Przeworski2000), it serves as an important component of the broader definition that includes concepts of human rights and civil liberties (Dahl Reference Dahl1971; Dahl Reference Dahl1989). Media freedom's inclusion in the latter perspective suggests the ‘free exchange and flow of information’ that the news affords citizens for decision making during elections makes mass democracy possible (Bimber Reference Bimber2002, 11–12). Manipulation of the channel between the press and voters leaves citizens unable to fully participate in the democratic process.Footnote 1 Therefore, identifying the conditions that affect press freedom as well as what it affects remain important to understanding democracy.
The media's often-cited watchdog role also serves a significant function in democracy (Besley and Burgess Reference Besley and Burgess2001; Donohue, Tichenor and Olien Reference Donohue, Tichenor and Olien1995; Whitten-Woodring Reference Whitten-Woodring2009). According to this perspective, the press holds governments accountable by reporting power abuses perpetrated by public officials. In this capacity, a free media promotes good government and combats human rights and civil liberties violations, providing an informal check on government. If a country's media cannot freely disseminate information or perform this watchdog role, then it is unable to attain this broader conception of democracy.
However, non-democratic leaders can see a free media as a threat to retaining power (Bueno De Mesquita and Downs Reference Bueno De Mesquita and Downs2005). Media, for instance, can serve as a coordination good – ‘public goods that critically affect the ability of political opponents to coordinate but that have relatively little impact on economic growth’ (Bueno De Mesquita and Downs Reference Bueno De Mesquita and Downs2005, 82). An open media can help solve co-ordination problems among the opposition and allow anti-government views to enter the public sphere. Bueno De Mesquita and Downs (Reference Bueno De Mesquita and Downs2005) argue that suppressing coordination goods like a free media and reducing opposition movements' ability to coordinate allows authoritarian regimes to endure. For example, Chinese officials allow some criticism of the authoritarian government on social media but typically censor content regarding collective expression (King, Pan and Roberts Reference King, Pan and Roberts2013).
While media–government relations have serious implications for the quality of democracy (Schedler Reference Schedler2002), governments are not the only actors that influence news outlets' freedom to distribute information. Non-state actors including media owners (Djankov et al. Reference Djankov2003) and criminal or terrorist organizations can also potentially influence a media system's news content. Hervieu (Reference Hervieu2013), for instance, describes the Brazilian media market that is consolidated among ten leading business groups, all of which are influenced by powerful political and industrial leaders, while drug trafficking organizations in Mexico and Paraguay represent the media's primary threat.Footnote 2 Under certain conditions, journalists may also opt to self-censor absent direct physical or economic coercion (Stanig Reference Stanig2015).
These differing elements suggest that raters creating data to measure media freedom remain largely unable to readily observe it. Different indices rate media freedom using varied criteria that emphasize specific aspects of it over others, reflecting the concept's inherent complexity (Schneider Reference Schneider2014). Many indicators assume a single variable can measure media freedom, while others evaluate smaller components of a country's media system related to press freedom. Others disagree on more nuanced aspects, such as including leaders' verbal attacks that seek to undermine media credibility. In addition, some indices have changed their conceptualization of what constitutes media freedom over time. These shifts reflect either changing technology or an evolving approach that data managers take to conceptualize their measurements. Widely used indices like Freedom House's Freedom of the Press and Reporters Without Borders' Press Freedom Index, for example, have changed their coding procedure many times since they began producing data.
These discrepancies arise due to the inherently unobservable nature of media freedom. Existing media freedom indices may therefore only measure certain aspects of a media system's freedom while overlooking others. A new variable that synthesizes information from extant measurements and accounts for their changing criteria requires a new measurement approach to infer media freedom as a latent concept.
In this article, we use an item response theory (IRT) model to measure media freedom, thereby treating it as a latent variable. This approach has two advantages. First, it generates time-series, cross-sectional media freedom data based on existing indicators that rate either a country's overall media system freedom or some aspect of it. The variable is continuous and includes a distribution around a point estimate for each country-year dyad to allow researchers to incorporate different raters' reliability of media freedom into empirical models. Secondly, the approach allows us to compare current media freedom variables to evaluate their influence on the new measure. The results produce a discrimination parameter for each indicator that shows which items exert the most influence on the latent variable.
To this end, we treat each press freedom indicator as a rater's best attempt to measure media freedom, but assume no measure captures the concept with complete accuracy. The indicators in this analysis fall into two categories. The first includes evaluations of a country's general media system freedom that consider government censorship, legal and economic environments, non-state actors' influence and harassment of journalists. The second category considers journalistic practices that reflect media freedom, including self-censorship, content bias and media corruption.
We perform the IRT analysis on ten existing indicators that measure media freedom. In a Bayesian framework, the model generates media freedom data for 197 countries worldwide from 1948 to 2017. The Media System Freedom (MSF) data overall cover more sovereign countries and years than any of the ten indicators and synthesize different conceptualizations into a single, theoretically driven measure. The result is a posterior distribution – a point estimate and standard deviation – for each country-year dyad, which allows us to incorporate different indicators and ratings in more holistic analyses of media freedom. An exhaustive battery of checks demonstrate the content, convergent and face validity of our approach. The results also indicate that variables from the Varieties of Democracy (V-Dem) dataset capture the latent media freedom concept better than the more commonly used Freedom House and Reporters Without Borders indices.
Upon generating our measure, we replicate the main analyses for four published articles that empirically analyze media freedom. These studies use a variety of methodological approaches and feature media freedom as both dependent and independent variables. To save space, we present one herein and three in the Appendix. The replications replace the original studies' variable choice with our MSF measure, as well as a Monte Carlo simulation to utilize the posterior standard deviation and incorporate the rater's reliability into the analysis. Overall, the results are largely mixed; not all reported findings hold. This finding serves as a caution for scholars who wish to empirically explore media freedom. By incorporating a more robust media system freedom measure into their empirical models, researchers studying media freedom can draw better inferences from their results and have greater certainty that their findings are likely not the consequence of raters' error or variable choice.
In the next section, we summarize conceptualizations of media freedom in the literature. Next, we discuss each indicator used in the analysis, and then describe the IRT model and our estimation approach. Finally, we assess the results before presenting the replication.
Media Freedom
The United Nations lists press freedom as a fundamental human right in its 1948 Universal Declaration of Human Rights. A number of countries worldwide guarantee it in their constitutions, though these legal protections may not mean a de facto guarantee of media freedom (Besley and Prat Reference Besley and Prat2006, 720–21). For example, North Korea – a firmly autocratic country that heavily restricts the mediaFootnote 3 – guarantees press freedom in Article 67 of its constitution. Scholars in the mass communication literature define it in various ways, though common elements emerge. These include the absence of government controls and restrictions (Price Reference Price2002; Siebert, Peterson and Schramm Reference Siebert, Peterson and Schramm1956; Weaver Reference Weaver1977), ownership diffusion (Lowenstein Reference Lowenstein, Fischer and Merrill1970; Rozumilowicz Reference Rozumilowicz, Price, Rozumilowicz and Verhulst2002), the absence of undue influence from non-government actors (Weaver Reference Weaver1977), and legal controls like libel and defamation laws (Picard Reference Picard1985). Other concepts relate to journalistic practices like self-regulation (that is, self-censorship) (Lowenstein Reference Lowenstein, Fischer and Merrill1970) or citizens' ability to access critical media content (McQuail Reference McQuail2010; Picard Reference Picard1985; Weaver Reference Weaver1977).
These conceptualizations point to one common characteristic – the level of constraint that journalists and other media personnel face in producing media content. This constraint can come from either state or non-state actors. Further, constraint is either direct (for example, restrictions and controls from government and non-government actors) or indirect (for example, outcomes that result from constraints such as self-censorship and biased media coverage favoring influential perspectives).
The empirical media freedom literature connects it to different political, institutional and economic environments (Stier Reference Stier, Tumber and Waisbord2017). Previous research links media freedom to different institutions including positive associations with higher democracy levels (Norris Reference Norris and Harvey2006; Whitten-Woodring and Van Belle Reference Whitten-Woodring and Van Belle2017) and greater checks on presidents in Latin America (Kellam and Stein Reference Kellam and Stein2016). Scholars have found that authoritarian regimes allow freer presses to improve bureaucratic efficiency in resource-poor regimes (Egorov, Guriev and Sonin Reference Egorov, Guriev and Sonin2009) or to monitor corruption of local-level politicians (Lorentzen Reference Lorentzen2014). Stier (Reference Stier2015) finds that media freedom varies according to authoritarian regime type: electoral authoritarian regimes have the most freedom and communist regimes the least. Furthermore, studies point to media freedom as a causal mechanism for the democratic peace (Van Belle Reference Van Belle1997; Van Belle Reference Van Belle2000).
The economics literature explores how economic environments shape media freedom. Research suggests that greater private media ownership has a positive effect on media freedom (Besley and Prat Reference Besley and Prat2006; Djankov et al. Reference Djankov2003; Gentzkow and Shapiro Reference Gentzkow and Shapiro2008; Petrova Reference Petrova2011). Scholars also find that media freedom reduces corruption (Brunetti and Weder Reference Brunetti and Weder2003; Kalenborn and Lessmann Reference Kalenborn and Lessmann2013), while executive-level government corruption is positively associated with increased government censorship efforts of traditional and new media (Solis and Antenangeli Reference Solis and Antenangeli2017). Stanig's (Reference Stanig2015) subnational analysis of media self-censorship in Mexican states finds that the number of reports the press publishes on government corruption decreases in states with higher punitive jail time for libel.
Another literature explores media freedom's impact on citizens' participation in the democratic process. The key findings indicate that higher press freedom levels strongly correlate with higher levels of political participation and voter turnout (Lesson Reference Lesson2008) and greater political knowledge (Lesson Reference Lesson2008; Schoonvelde Reference Schoonvelde2014). Studies also show that media freedom positively associates with foreign direct investment (Dutta and Roy Reference Dutta and Roy2009) and foreign aid (Dutta and Williamson Reference Dutta and Williamson2016).
In sum, constraint, whether direct or indirect, imposed on the media emerges as a common element among theorists' conceptualizations of media freedom. As such, a vast literature examines both what media freedom affects and what is affected by it. This article engages these literatures in two ways. First, we propose a new measure of media freedom using latent variable analysis that maps the concept along a single dimension reflecting the various constraints faced by media. The measure synthesizes extant media freedom indicators in a statistically principled way that measure either (1) media outlets’ ability to produce content without undue influence or (2) journalistic practices that relate to press freedom. Secondly, our results produce data that allow for stronger empirical analyses and inferences from studies investigating media system freedom.
Media Freedom Indicators
Current media freedom indicators do not capture all of the features that scholars identify as important to a media system's freedom (Becker, Vlad and Nusser Reference Becker, Vlad and Nusser2007). An IRT model allows us to produce a more robust measurement of this latent concept that includes indicators evaluating a country's media system in different ways. It also captures changing standards that indicators use to measure it. To employ this model, we begin by selecting theoretically driven variables that either attempt to measure the overall freedom of a country's media system or some aspect of it. We only include indicators that attempt worldwide coverage.Footnote 4 We also make a theoretical distinction among these variables. While many directly measure the media environment's overall freedom, others evaluate journalistic practices that reflect media freedom. In this section, we provide a brief summary of these media freedom measures. We describe what each indicator attempts to measure and the time period it covers. The Appendix provides a more detailed overview of each measure.
Freedom House: Freedom of the Press
Freedom House's (2017) Freedom of the Press index remains one of the most widely used datasets for measuring press freedom in political science and economics (Brunetti and Weder Reference Brunetti and Weder2003; Egorov, Guriev and Sonin Reference Egorov, Guriev and Sonin2009; Kellam and Stein Reference Kellam and Stein2016). The non-governmental organization began issuing reports in 1980, covering the previous year 1979, and continues to the present. However, the index's managers have changed the dataset's methodology numerous times since its inception. From 1980 until 1988, Freedom House provided separate rankings for a country's print and broadcast sectors, ranking each as free, partially free or not free. Freedom House provides no aggregate ranking of the country's media system during this period. From 1989 until the present, Freedom House assigns countries a sector-aggregated, countrywide free, partially free or not free ranking. Freedom House does not make the index's methodology readily available from 1980 to 1993.
From 1994 until the present, Freedom House introduced a continuous score ranging from 0 (most free) to 100 (least free) to accompany each country's categorical ranking. Initially under the 100-point scale, the index evaluated media freedom based on four criteria: (1) law, (2) political pressure, (3) economic influence and (4) repressive actions. The index managers considered both print and broadcast sectors separately and then assigned an overall freedom score. From 1997 until 2001, they used the same basic structure but modified the point distribution. In 2002, Freedom House introduced a new coding scheme that it still employs today. The newest methodology evaluates three different areas of each country's media system: the legal, political and economic environments.
Global Media Freedom
The Global Media Freedom (GMF) Dataset (Whitten-Woodring and Van Belle Reference Whitten-Woodring and Van Belle2017) orients its data collection methodology by first defining media freedom as ‘an environment in which journalists are able to safely criticize political and economic elites at both the national and local levels’ (Whitten-Woodring and Van Belle Reference Whitten-Woodring and Van Belle2017, 80). Whitten-Woodring and Van Belle then code each country-year on a categorical scale from 1 to 3, with higher values representing less media freedom.Footnote 5 The authors provide media freedom scores from 1948 to 2014.
Reporters Without Borders: Press Freedom Index
The French-based watchdog group Reporters Without Borders (RSF) has released its Press Freedom Index since 2002 (Reporters Without Borders, 2018). The index provides press freedom scores and country rankings based on surveys from journalists, scholars and human rights activists.Footnote 6 RSF focuses heavily on harassment of media, attacks against journalists and self-censorship, though they consider other criteria including economic and legal conditions. Generally, scores range from 0 (perfect press freedom) to 100 (least perfect), though some years inexplicably possess negative scores or scores above 100.
Varieties of Democracy Indicators
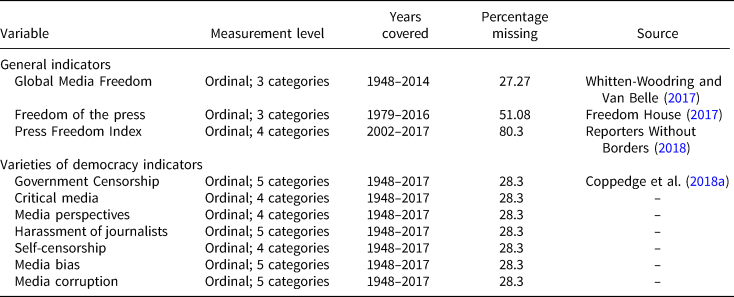
The Varieties of Democracy (V-Dem) dataset provides original data for a number of indicators often associated with democracy (Coppedge et al. Reference Coppedge2018a). The dataset's Media section offers a number of variables that evaluate different aspects of media freedom and quality. V-Dem generates scores by asking experts to rank each country according to a specified variable concept. After receiving the responses, V-Dem researchers run the results through a measurement model to compile a cross-coder aggregated score (Pemstein et al. Reference Pemstein2018). Below we outline the seven V-Dem variables we use in this analysis: government censorship of traditional media, presence of critical media, presence of various media perspectives, harassment of journalists, self-censorship, media bias and media corruption. V-Dem provides these variables from 1900 to 2017.
Government censorship measures government censorship efforts against traditional media outlets like the press, television and radio. The authors clarify that this includes indirect means of censorship such as politically motivated financial and official support of friendly media outlets as well as other restrictions including a high barrier to receive a broadcasting license or taxes. The ordinal variable codes each country-year from 0 to 4, with higher values representing less censorship.
Critical media measures the degree to which major print and broadcast media outlets criticize the government. The ordinal variable codes each country-year from 0 to 3, with higher categories representing higher criticism levels by media.
Media perspectives measures the degree to which major print and broadcast media outlets report a wide range of different perspectives. The ordinal variable codes each country-year from 0 to 3, with the lowest score representing an environment in which the media only report the government's perspective and the highest score indicating environments in which the media represents all of society's important perspectives.
Harassment of journalists measures the degree to which journalists face harassment from governments and powerful non-governmental organizations. The ordinal variable codes each country-year from 0 to 4, with higher categories representing less harassment.
Media self-censorship measures self-censorship's prevalence among journalists. The ordinal variable codes each country-year from 0 to 3, with higher categories representing less self-censorship among journalists.
Media bias measures the degree to which the media as a whole carries overt biases against opposition parties or candidates. The ordinal variable codes each country-year from 0 to 4, with higher categories corresponding to less bias.
Media corruption measures the level of corruption among journalists and media personnel in a country's media system. V-Dem considers journalists, publishers and broadcasters corrupt if they take payments in exchange for altering news content. The ordinal variable codes each country-year from 0 to 4, with higher scores corresponding to less media corruption.
Single Dimension
These ten variables fall within our theoretical guidelines and capture either direct constraints on media or some result due to constraint (indirect). Freedom House measures the degree to which government and political environments restrict the media. It also includes undue influence from non-governmental actors as well as legal and market constraints. Likewise, GMF and RSF focus on the media's ability to criticize the government and harassment of journalists, respectively. V-Dem offers measures of constraint such as government censorship efforts and harassment, as well as outcomes that reflect constraints against the media such as the amount of coverage that is critical of the government, biased coverage against government opposition, journalists' self-censorship, limited perspectives in the news and media corruption.
An Item Response Theory Model for Media Freedom
IRT models are part of a broad class of latent trait analysis models that aim to measure an underlying ability (or trait). Scholars interested in educational testing initially developed this type of model (Lord Reference Lord1980; Rasch Reference Rasch1960; Samejima Reference Samejima1968; Samejima Reference Samejima1972), and political scientists have utilized them to evaluate or measure latent variables like democracy (Pemstein, Meserve and Melton Reference Pemstein, Meserve and Melton2010; Treier and Jackman Reference Treier and Jackman2008), judicial independence (Linzer and Staton Reference Linzer and Staton2015), respect for human rights (Fariss Reference Fariss2014), and US state Supreme Court justice's ideologies (Windett, Harden and Hall Reference Windett, Harden and Hall2015). For this analysis, we employ Linzer and Staton's (Reference Linzer and Staton2015) dynamic, graded-response IRT model.Footnote 7
Model Specification
Each of the ten indicators above represent a rater's best attempt to evaluate a country's overall media system freedom or journalistic practices related to it. In order to take advantage of these different indicators to uncover the latent variable, we use a dynamic, graded-response IRT model that estimates a bounded, unidimensional latent scale of media freedom.
We let the latent measure x kt vary across k countries, k = 1, …, k and t years, t = 1, …, t. Though the concept is unobserved, we assume a series of r observed variables y r makes a reasonable attempt to capture the concept with manifest measurement. These measurements use the same unit of analysis as the latent measure x kt. We further assume that while each measure y kt does not perfectly measure media freedom, taken together they produce more reliable estimates for the latent variable x kt.
Having made this assumption, we specify a bounded, graded-response IRT model that links the latent x kt to the manifest y rkt. However, media freedom indicators are not created equal. The model aims to uncover how well each y rkt reveals information about the latent variable. Items that better reveal information about the latent measure discriminate better than others. Each item in y rkt estimates an item discrimination parameter, coefficient β r, which captures the reliability or discrimination parameter of indicator y r.
Think of the discrimination parameter as a measure of how reliably an item reveals the latent concept. For example, if a secondary school teacher wished to test students' US history knowledge (itself a latent concept), a true or false question asking if President George Washington was a male represents an overly simple question that poorly discriminates a student's US history knowledge. Indeed, most students could identify the historical figure as male based on the name alone. However, a question asking the name of President Herbert Hoover's Belgian shepherd dog presents a needlessly difficult question about a largely inconsequential fact.Footnote 8 While the vast majority of students would likely get the first question correct and the second question wrong, both poorly discriminate (that is, reveal) a student's knowledge of US history. The model seeks to find items (categories in this case) that discriminate the latent concept well.
As the discrimination parameter for each y r, β r, increases, a closer relationship between the latent and manifest measures is revealed, while estimates closer to 0 contain more noise, indicating a greater error variance in that item. For the model, we set the identification restriction that β r ≥ 0 for ease of interpreting β r's discrimination capabilities.
Finally, we denote the total number of outcome categories for the rth manifest variables y r as M r. In addition, τ rm divides adjacent ratings on the latent scale, subject to the constraint τ rm > τ r(m−1). We denote the link function as:
 $$P( {y_{rkt} = m} ) = {\rm logi}{\rm t}^{{-}1}\beta _r( {\tau_{rm}-x_{kt}} ) -{\rm logi}{\rm t}^{{-}1}\beta _r( {\tau_{r( {m-1} ) }-x_{kt}} ).$$
The inverse logit function in Equation 1 predicts not only the discrimination parameter but also estimates the threshold, or ‘grade’, moving from one category to the next in each y kt. For example, it estimates two thresholds for a variable with three categories. The key output of the model aligns the estimated threshold levels τ rm with observed ratings across y kt. And the distance between each threshold y rkt helps specify which category distinctions are more or less substantively meaningful relative to the other y r.
Unfortunately, y rkt are the only observed values in Equation 1, and they appear on the left-hand side. However, using a fully Bayesian approach, we are able to estimate τ rm and x kt. We first place a bound on x between 0 and 1 in order to easily interpret the results. The lower bound 0 means x has none of the latent characteristics and the upper bound 1 means x has all of the characteristics. For this analysis, a 0 represents the lowest media freedom level, while increasing toward 1 represents greater freedom.Footnote 9 Within each country k, we assume x in year t has a normal prior distribution that is centered at the latent variable's previous value in year t – 1. We represent this in Equation 2:
 $$x_{kt}\sim N( {x_{k( {t-1} ) }, \;\sigma_k^2 } ) I( {0, \;1} ).$$
The notation I(0, 1) indicates the bounded upper unit 1 and the bounded lower unit 0. The model assumes a bounded by 0 and 1, noninformative normal prior. Separate variance parameters  $\sigma _k^2 $ estimated for each country capture x kr's temporal variation. We assign uniform priors on the unit interval to the standard deviation σ of each country, which helps ensure estimates will not be too ‘flat’ when fitting the model.
The Bayesian model's treatment of missing values provides another advantage to this approach. Countries with more manifest data points provide more information to x kt based on threshold coefficient estimations, while countries with fewer manifest variables inversely provide less. We only keep country-year dyads with at least one observation. This decision ensures the model does not produce observations where every y rkt is missing. However, the dataset still contains one class of missing variables, which the Bayesian approach handles. When many but not all y rkt are missing, the estimation comes from the posterior estimate of x kt's posterior based on its prior distribution. Placing prior distributions over β r and τ rm finalizes the model. We assign each threshold random vague normal points. From here, the iteration process finds estimates for each τrm.
Applying the Model
To apply the model, we use the ten indicators that we described above to estimate a latent variable measure of media freedom for the years 1948 to 2017. Each indicator represents a rater's best guess at measuring media freedom or some aspect of it, though none successfully captures it. For each indicator, we use ordinal measures required by the dynamic, graded-response IRT model. The Reporters without Borders score is continuous and ranges from −14 to 144. To fit the model, we convert it into four categories, dividing the data by 25th percentiles. For Freedom House's data before 1988, we take the average of the print and broadcast sectors to generate a country-aggregated ranking. We score a country-year partly free (2) for any average greater than 1 or less than 3. Finally, we code all variables so that higher values indicate greater media freedom and drop all observations when the country was not independent.Footnote 10
Table 1 lists the attributes of each variable as they pertain to the IRT model, including measurement level, years covered and missingness. The model also includes countries that no longer exist like South Vietnam, South Yemen and East Germany. Given these parameters, the dataset has a total of 10,739 observable country-year units. Starting in 1979, the data covers most country-years, though the Global Media Freedom and seven V-Dem indicators cover nearly the entire period.Footnote 11
Ten media freedom indicators, summary

Results
MSF Data
In order to create bounded, continuous, media freedom estimates from 0 to 1 in 197 countries worldwide from 1948 to 2017, we estimated a full Bayesian model utilizing a Markov chain Monte Carlo (MCMC) simulation using JAGS (v4.3.0). We ran three chains at 2,000 iterations each, with the first 1,000 draws discarded and treated as burn-ins. The results are based on the posterior distribution of parameters x kt, β r, τ rm, and  $\sigma _k^2 $.
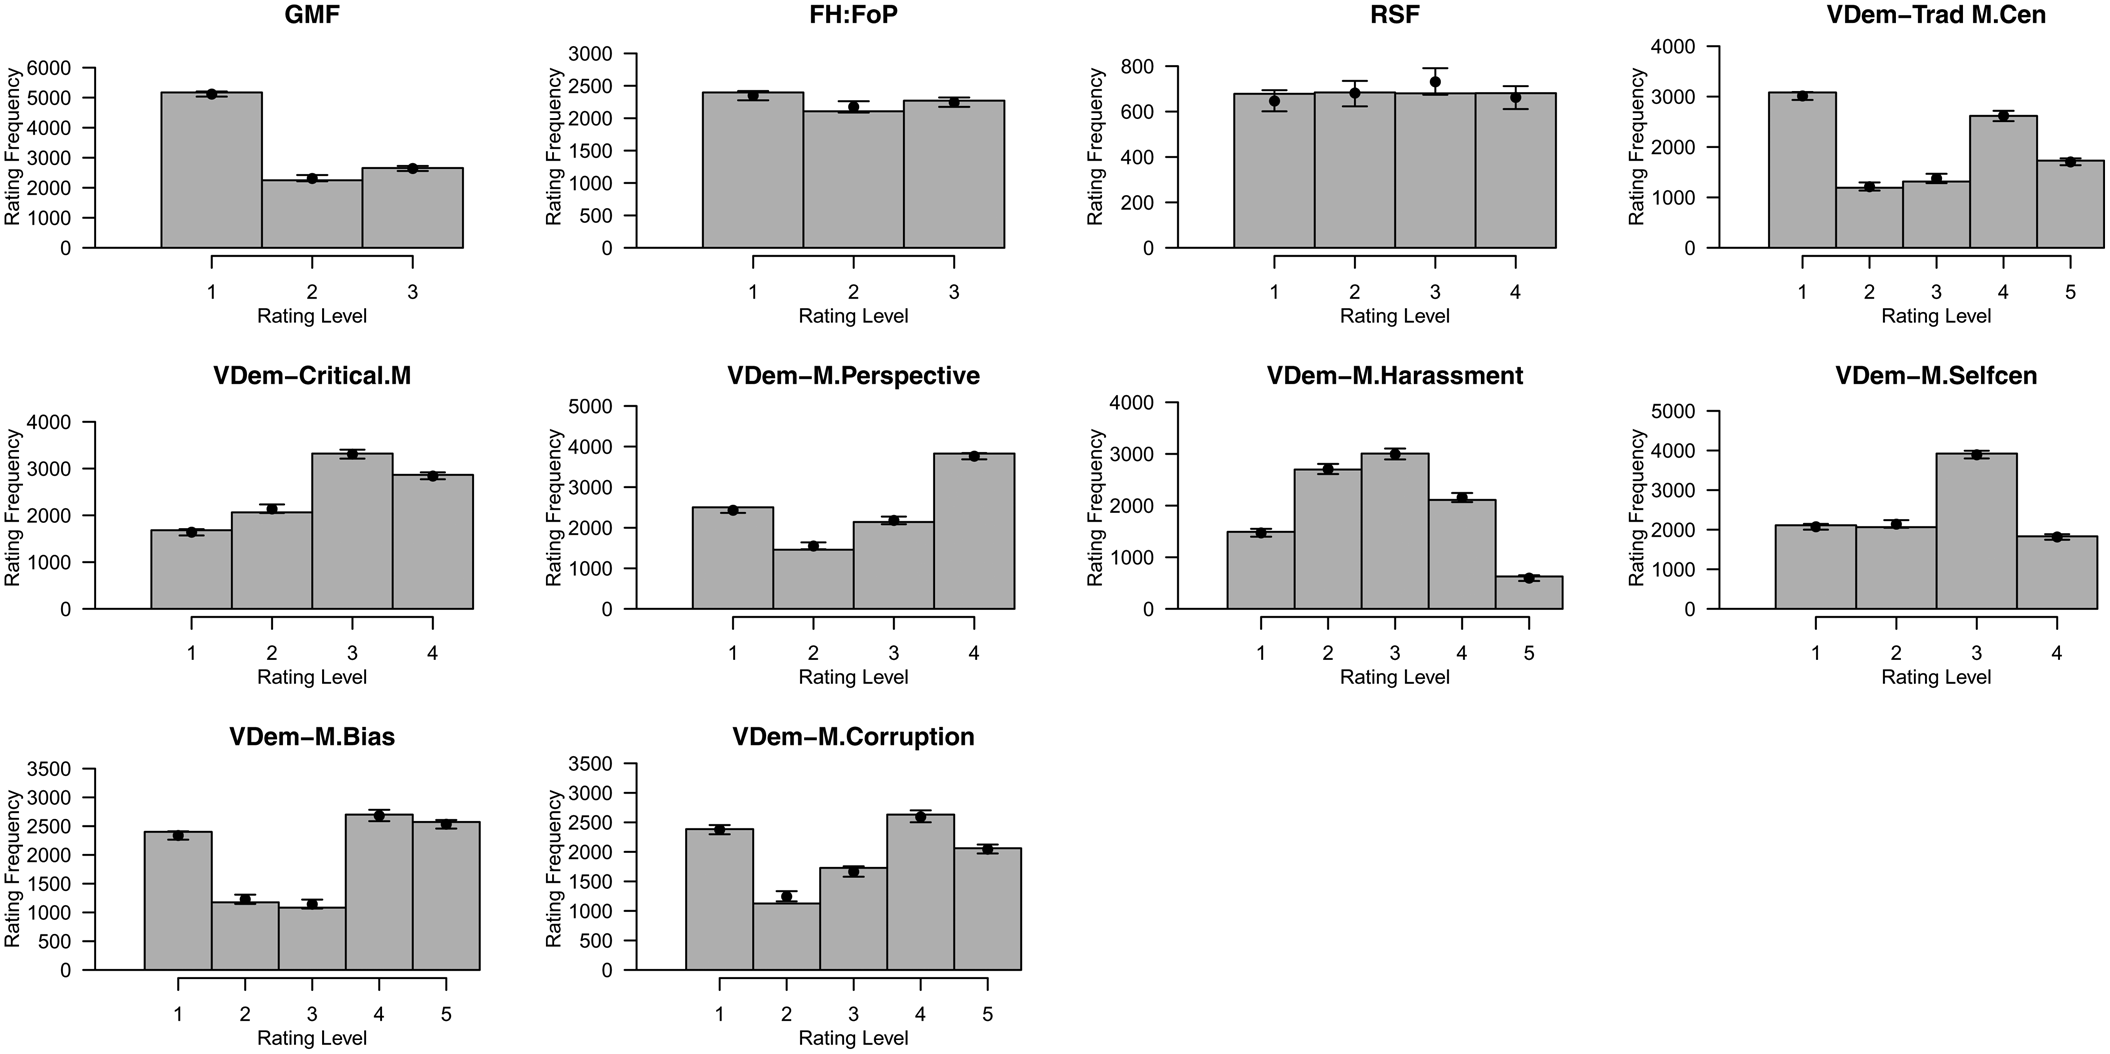
To assess the model fit, we compare the manifest distribution of each indicator y r to the predicted distributions following Equation 1 above. Combining Equation 1 and the simulation procedure, the model resamples values of each parameter estimate from the joint posterior distribution. From this, we are able to compare the predicted distribution to the actual distribution of y rky to assess how well the model predicts each indicator's manifest distribution. No systematic discrepancy between the observed y r and the posterior predictive distribution indicator suggests a good model fit. Figure 1 presents these results below. It shows that of the forty-two possible ratings, only two fall outside the predicted distribution and its 95 per cent confidence level.Footnote 12 This outcome indicates that the model accurately predicts about 96 per cent of the ratings. The results show no evidence of over- or under-predicting of extreme ratings y rkt.
Observed ratings and the posterior predictive distribution
Note: figure displays predicted distributions and observed manifest variable distributions. The model accurately predicts about 96 per cent of the ratings.

Cross-Sectional Results
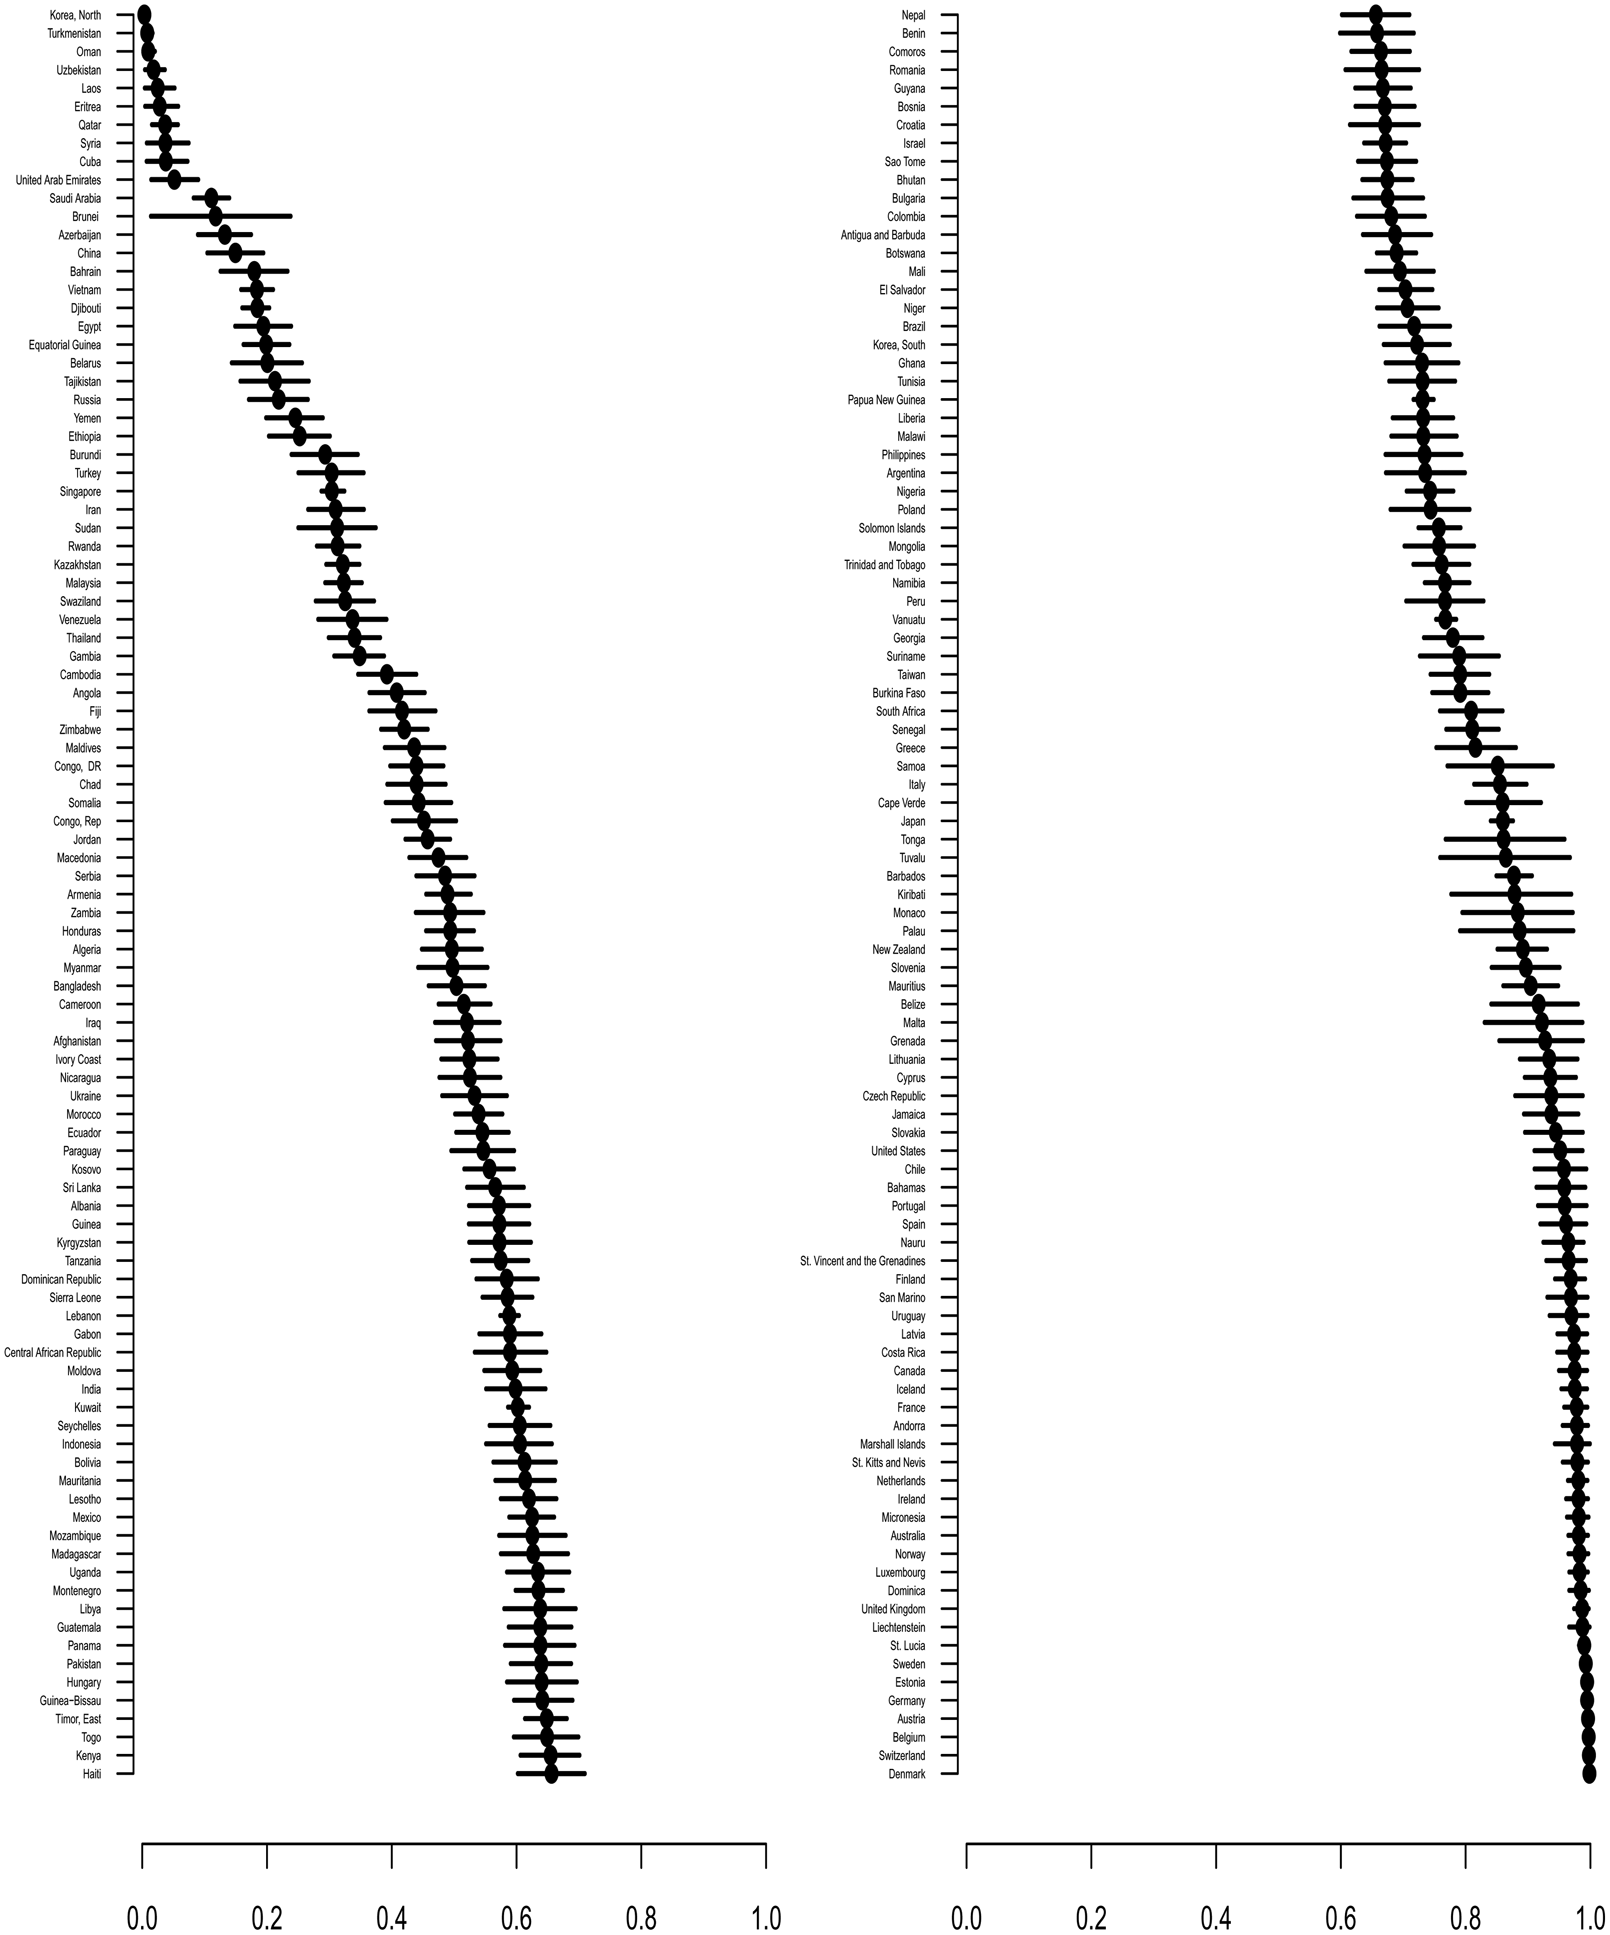
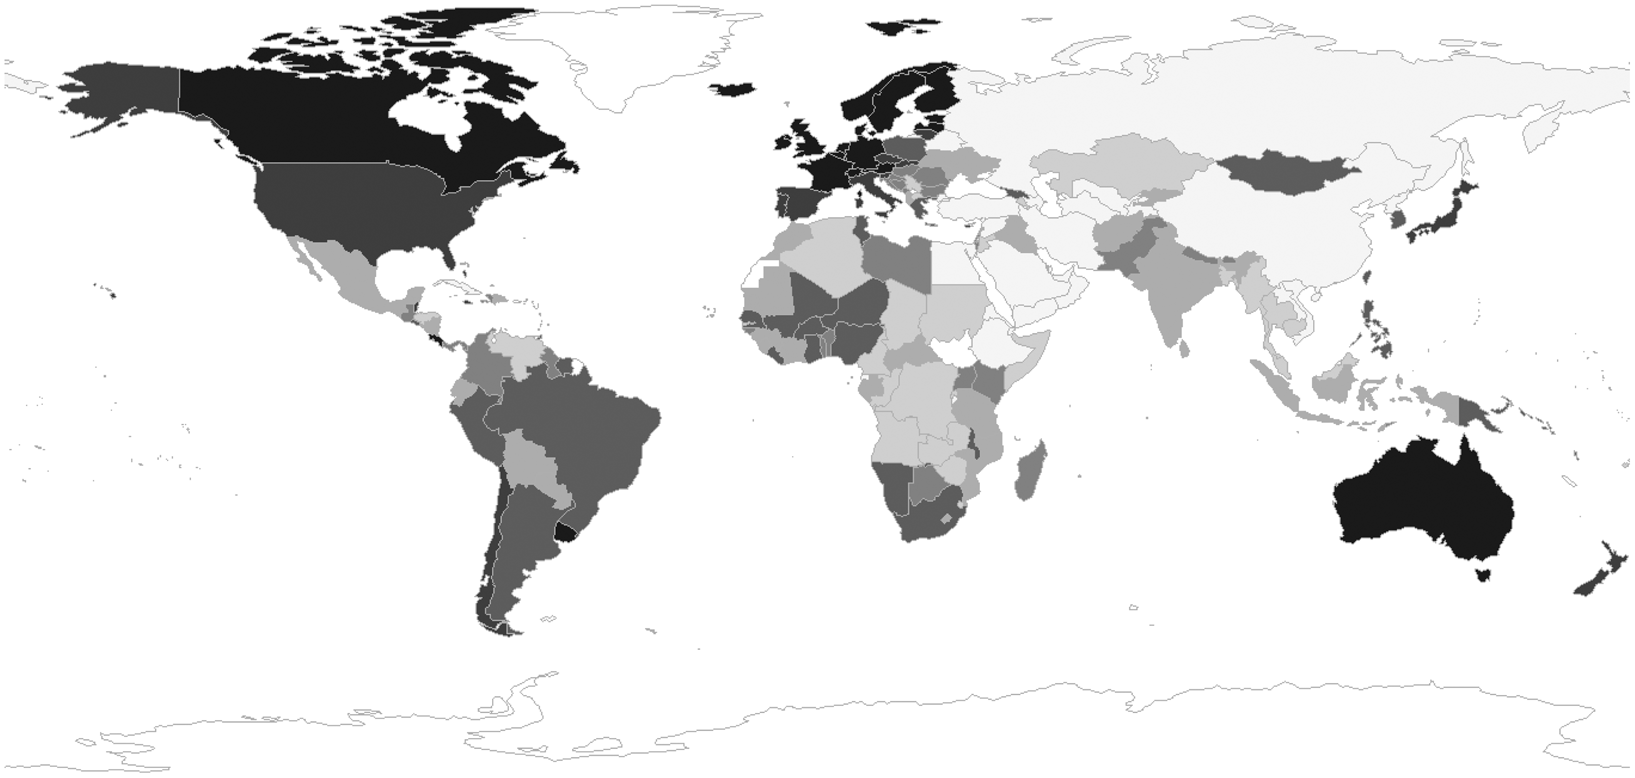
The model yields latent variable estimates for media freedom in 197 countries from 1948 to 2017. The lower bound 0 represents media freedom's absence, while an increasing score bounded at 1 represents greater media freedom. Figure 2 plots these point estimates along with associated error bars indicating 80 per cent posterior credible intervals for the year 2016.Footnote 13 The cross-sectional estimates indicate long-time authoritarian regimes like North Korea, Turkmenistan and Oman yield the lowest point estimates, while consolidated democracies like Denmark, Switzerland and Belgium have the highest. The figures show countries at the top and bottom of the scales have small error bars, while those in the center possess much wider ones. This indicates the model's certainty at placing countries at the bottom and top, while those in the center possess more noise. Importantly, while our model's bounded nature is valuable for placing units on an easily interpretable scale (0,1), it limits the ability to precisely compare individual units because it also constrains the error bars on the 0,1 scale. As units could range anywhere in this region, they are truncated at the bounds, making comparisons less clear, especially at the extremes. Thus, while there are clear benefits to the bounded approach (interpretability), there are also some limitations (cross-unit comparisons). Figure 3 presents the results from Figure 2 on a global map. Countries in darker gray mark higher levels of media freedom, while lighter grays indicate countries with lower levels. White indicates no available data.
MSF in 194 countries, 2016 (lower/upper bounds)
Note: media freedom point estimates along with associated error bars indicating 80 per cent posterior credible intervals.

MSF worldwide, 2016 point estimates
Note: darker grays indicate higher levels of media freedom. Lighter grays indicate lower. White indicates no available data.

Temporal Trends
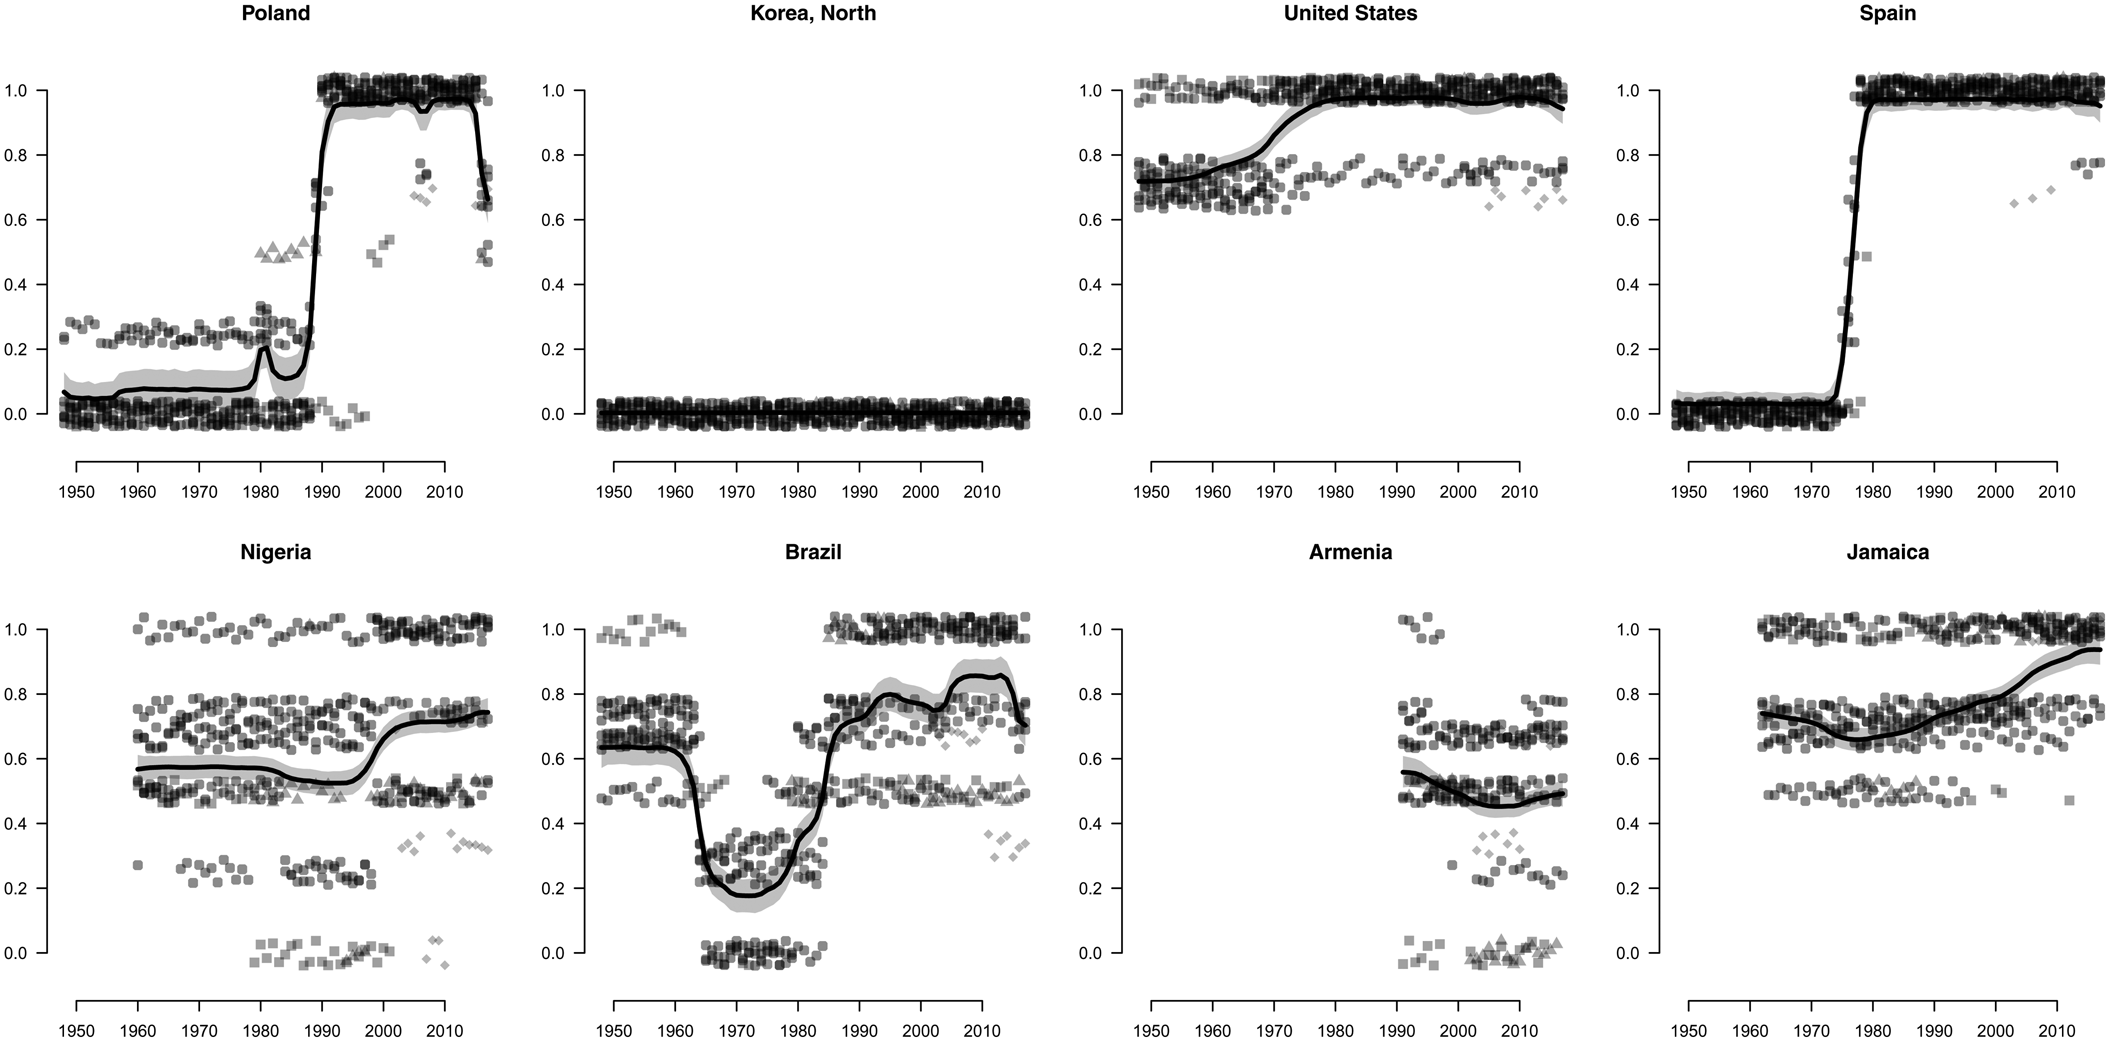
The results also provide temporal trends in each country-year from 1948 to 2017. Figure 4 displays trends for Poland, North Korea, the United States, Spain, Nigeria, Brazil, Jamaica and Armenia. The figure features countries that vary by regime type and region, and shows variance both within and between countries. The Appendix displays figures for all 197 countries. The figures also show jittered plots of trends from the ten manifest variables. The patterns demonstrate the heavy concentration of the manifest variables, though inspection of specific variables is limited in most cases. As darker shapes indicate larger discrimination parameters, the jitter plots indicate that North Korea displays high agreement among raters, while Nigeria and Armenia show high disagreement. The remaining countries fall between these extremes.
MSF temporal trends in eight countries, 1948–2017
Note: MSF point estimates with 80 per cent posterior credible intervals. Jitter plots show trends from ten manifest variables, constrained on a 0–1 scale. Circles represent V-Dem variables, triangles represent GMF, diamonds represent RSF, and squares represent Freedom House (though shapes may be difficult to distinguish given high concentration in most cases). Darker shapes indicate larger discrimination parameters.

Comparing Media Freedom Indicators
In addition to information about the latent media freedom variable, the model returns information about the individual indicators themselves. Recall that the link function between x kt and y rkt produces a beta coefficient that evaluates the discrimination of each y rkt with regards to x kt. The larger the coefficient, the more influence that variable has on the latent measure's estimate. We report the beta estimates here: GMF (9.23), Freedom House (8.44), RSF (6.99), V-Dem: Government Censorship (11.46), V-Dem: Critical Media (11.83), V-Dem: Media Perspectives (11.53), V-Dem: Journalist Harassment (11.34), V-Dem: Media Self-censorship (11.4), V-Dem: Media Bias (12.04) and V-Dem: Media Corruption (10.56). The results indicate that the V-Dem variables Critical Media, Media Bias and Media Perspectives exerted the most influence. All three return beta coefficients above 11.5. RSF – which covers the least amount of time – returned the lowest beta coefficient and exerted the least influence.
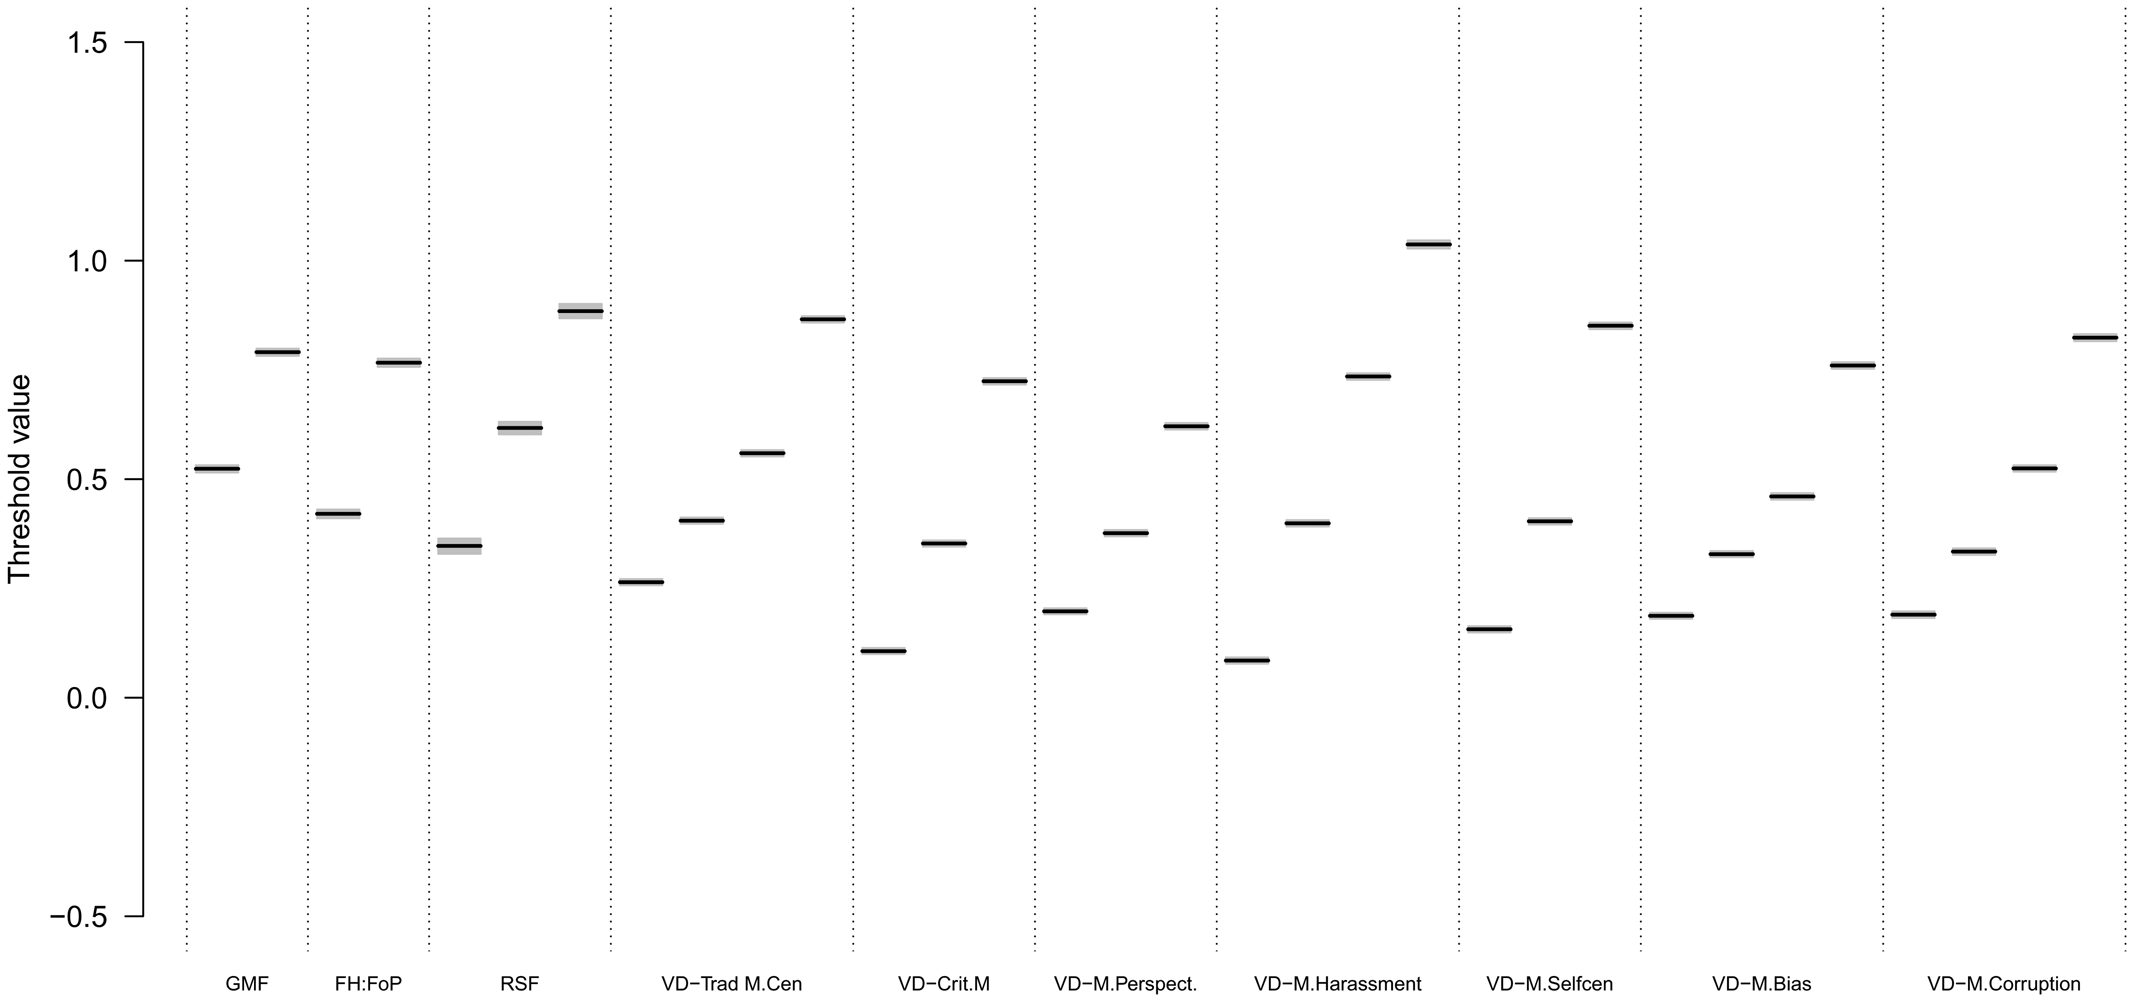
The model also allows us to compare indicators based on their threshold values’ τ rm relative position. Figure 5 displays each variable's cutpoints. The thresholds show how each media freedom indicator aligns relative to others along the latent scale. For instance, the lowest GMF category is about equivalent to the lowest three V-Dem: Government Censorship categories. Also, the lowest Freedom House category is equivalent to the two lowest V-Dem: Media Self-censorship categories. Figure 5 also demonstrates that V-Dem indicators have more extreme thresholds, suggesting that they are more useful for distinguishing among high and low degrees of media freedom than non-V-Dem variables. We note that none of the cutpoints' shaded regions overlap.
Threshold estimates, ten media freedom indicators
Note: thresholds show ten manifest indicators alignment relative to others along the latent scale. Shaded areas represent 95 per cent highest posterior density.

Additional Validation and Robustness Checks
In this section we describe a battery of additional validation and robustness checks in line with common strategies in similar latent variable modeling applications. Overall, the evidence indicates that our results are strong in both content and convergent validation. To save space, we briefly describe these checks and their results below and provide more detail in the Appendix.
Robustness Checks
IRT models assume a single trait or ability exists among different indicators (Rizopoulos Reference Rizopoulos2006). To investigate this assumption, we fit factor analytic, principal component analytic and Bayesian factor analytic (BFA) models on the ten manifest variables. These approaches allow us to investigate the dimensionality of a set of variables in some feature space. The results from all three analyses strongly suggest that our ten manifest indicators are characterized by a single underlying dimension.
Next, the results from our model indicate that V-Dem's manifest variables yield larger discrimination parameters than Freedom House, RSF and GMF. However, V-Dem variables' overwhelming presence (seven of the ten indicators) may result in discrimination parameter sizes that are biased toward V-Dem. As such, we fit seven subset IRT models including the three non-V-Dem variables with a single V-Dem variable to compare the discrimination parameters to our full model. These results indicate our inferences do not change: V-Dem variables consistently yield higher betas than non-V-Dem ones.
Similarly, we compare our MSF scores to alternate specifications that downweight the seven V-Dem variables. Here, we fit our model replacing the seven V-Dem indicators with either (1) V-Dem's Freedom of Expression and Alternative Sources of Information (FEASI) index or (2) BFA model scores for the seven V-Dem variables. These resulting measures highly correlate with our MSF scores at 0.94 and 0.96, respectively. However, we do not opt to replace either of these specifications with our main analysis. Theoretically, the FEASI index includes concepts outside our conceptualization of media freedom, such as freedom of academic and cultural expression and individual freedom of discussion. Also, when we plot the scores by the countries in Figure 4, we find the trends smoother than in our initial specification. Likewise, the results from the model including the BFA scores indicate the same general patterns but exhibit smoother trends in some cases. More importantly, when we compare this specification's thresholds along the latent scale (like Figure 5), we find that the BFA-reduced variable's ability to discriminate between lower and higher levels of media freedom are about the same as non-V-Dem variables. We therefore lose important discrimination ability under this specification. These findings suggest that downweighting the seven variables excludes unique variance that diminishes the model's ability to capture the latent construct.
Finally, the seven V-Dem variables include measures of uncertainty for each indicator (one standard deviation above and below the distribution that generated the ordinal measure).Footnote 14 Using these data, we create ten unique datasets that randomly draw categories for each country-year from the seven V-Dem variables that range from the upper to lower limits of uncertainty. Non-V-Dem variables do not include measures of uncertainty, so they remain unchanged. We then pass these ten datasets through our measurement model and compare the resulting scores to our MSF data. We find that all ten datasets highly correlate with our measure at about 0.99. Finally, we fit an unconstrained iteration of our original model, where the underlying scale is free, not bounded between 0 and 1. Though highly correlated with our MSF scores at about 0.9, we opt to keep the 0 to 1 scale, in line with similar applications (for example, Linzer and Staton Reference Linzer and Staton2015).
Data Validation
Following strategies outlined by McMann et al. (Reference McMann2016), we further evaluate our measure's convergent and content validity. Due to space constraints, we present an overview below and provide further discussion in the Appendix. All evidence points to the validity of our new data.
To investigate the data for convergent validity, we first determine how well the data capture actual cases through various case studies. We therefore generate case studies on the eight countries in Figure 4. We conduct six studies ourselves, while a data-blinded research assistant provides two more. In all eight studies, we find that the case history reflects our new data's general trends. Next, we perform empirical checks on the extent to which our measure converges with our ten manifest variables. Box and scatter plot analyses indicate high convergence levels, suggesting that our measure ‘paints an overall similar picture’ to the manifest variables (McMann et al. Reference McMann2016, 33). Finally, we perform a more detailed exploration of case disagreements between our measure and the ten manifest variables. We find that while divergent cases do occur, they remain rare and largely explained by higher than usual levels of manifest variable disagreement.
Our data are also strong in content validity. We root the measure in theoretical conceptualizations of media freedom and use this guidance to select variables for the IRT model to ensure our measure reflects the underlying media freedom concept appropriate for academic and policy researchers. Drawing theoretical boundaries around the concept allows us to efficiently differentiate from variables that exist beyond our conceptualization. We also include the various and complex ideas that relate to media freedom and construct a parsimonious concept that we can apply consistently across countries and over time. We achieve coherence in our measure with our IRT model that provides a single measure of the latent concept that also remains consistent across countries and over time. The measure produces time-series, cross-sectional data that is analyzable on media freedom from 1948 to 2017 in 197 countries.
To demonstrate its usefulness in empirical research, we utilize the MSF data in four replications of extant studies that feature cross-national, time-series media freedom measures in their empirical analyses. Media freedom appears as both dependent and independent variables in these works, while their methodologies vary to include panel, multi-level and time-series modeling.
These analyses all make nuanced arguments and test different hypotheses, while also including robustness checks. Here, we present the model(s) that best reflect the study's main finding as it relates to media freedom. We do not change any study's sample size, opting instead to use only the original one. This avoids confounding the new measure's effect with a sample expanded by time and unit, while allowing us to directly compare the results with our MSF data to published empirical results using another media freedom variable.
We briefly relay each study's argument and findings, then describe the research design aspect that we will replicate. To save space, we only present Egorov, Guriev and Sonin (Reference Egorov, Guriev and Sonin2009) below and describe the other replications in the Appendix.Footnote 15 We choose this study because it carries the highest impact of the four.Footnote 16 While this replication shows that the findings do not hold, two others in the Appendix show mixed results while another successfully replicates the study's initial findings.
Replication
Egorov, Guriev and Sonin (Reference Egorov, Guriev and Sonin2009) analyze the influence of natural resources on media freedom in authoritarian regimes.Footnote 17 They argue that resource-poor dictatorships allow freer media systems in order to better monitor their bureaucracy. More specifically, they argue that dictators make this calculation based on the value of their oil reserves (and not oil production value). The authors examine countries worldwide from 1993 to 2008 and use Freedom House's Freedom of the Press index to operationalize media freedom, using the variable's lead (t + 1). Though they present a number of different specifications and robustness checks to evaluate their hypothesis, we focus here on their core findings based on Models 2 and 5 in their Table 1 (p. 658).
Their Model 2 features a panel regression with fixed and year effects. The key explanatory variable is the value of a country's oil reserves obtained from BP's Statistical Review of World Energy.Footnote 18 The model controls for democracy level using Polity scores (Marshall and Jaggers Reference Marshall and Jaggers2017) and a number of World Bank indicators including wealth, population and government expenditures as a percentage of GDP (World Bank 2017). The authors log all World Bank and BP oil data. The model also includes an interaction term for Polity and Log Oil Reserve Value. Their Model 5 is similar to Model 2 but restricts the sample to authoritarian regimes defined as countries with a Polity score ≤5.Footnote 19
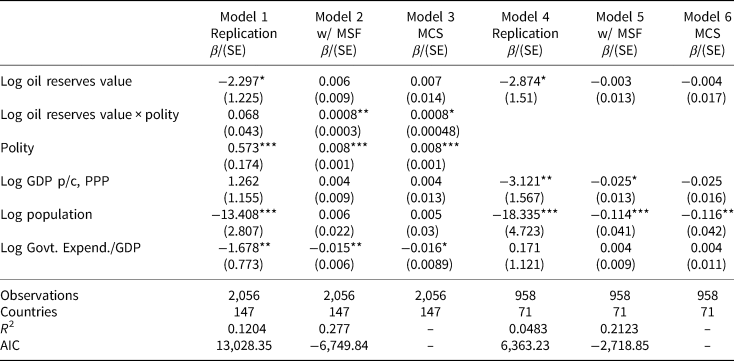
Model 1 in Table 2 below replicates Egorov, Guriev and Sonin's Model 2 and produces similar results. Log Oil Reserve Value is negative and statistically significant (p = 0.061), indicating that high oil reserves reduce media freedom.Footnote 20 However, when we use the MSF point estimates in Model 2, Log Oil Reserve Value becomes positive and statistically insignificant. Also, the interaction term becomes statistically significant (p < 0.05), while Polity remains positive and statistically significant. Regarding the other controls, Log Population flips signs to positive and becomes statistically insignificant. Log GDP p/c, PPP and Log Govt. Expend./GDP return similar results to the original analysis.
Egorov, Guriev and Sonin (Reference Egorov, Guriev and Sonin2009) Replication, Models 2 and 5 (Table 1)

Note: Model 1 replicates Egorov, Guriev and Sonin (Reference Egorov, Guriev and Sonin2009) Model 2, Table 1; Model 4 replicates Egorov, Guriev and Sonin (Reference Egorov, Guriev and Sonin2009) model 5, Table 1; β = Coefficient Estimates; (SE) = Standard Errors; All media freedom variables are leads (t + 1); Constants not reported; Fixed and year effects; Models cover years 1993–2008; Monte Carlo simulation (MCS) w/750 iterations: β = mean of 750 coefficient estimates, (SE) = mean of 750 standard error estimates. ***p < 0.01; ** p < 0.05; *p < 0.1
Next, we run a Monte Carlo simulation (MCS) in Model 3. Recall that the IRT model produces point estimates and a posterior standard deviation for each country-year. To utilize these data, we run an MCS using 750 random draws from each country-year's MSF distribution. The MCS runs the model 750 times, estimating a beta coefficient and standard error each time, then returns a mean of each variable's beta coefficients and standard errors. Model 3 indicates the results from the simulation largely mirror Model 2.
Models 4–6 follow the same series of analyses as Models 3–6 but restrict the sample to authoritarian regimes. The data indicate similar results: Log Oil Reserve Value loses significance when we include the MSF point estimates as well as in the Monte Carlo simulation. The controls remain largely the same, though Log GDP p/c, PPP loses significance in Model 6.
Discussion
The media's ability to independently produce and disseminate content without undue constraint remains at the core of media freedom's conceptualization. While various raters produce indicators to evaluate a media system's freedom or some aspect of it, none perfectly measures the media's ability to operate freely. To better capture the concept and create a more robust measure, we treat media freedom as a latent variable and employ an IRT model that analyzes different cross-national indicators of media system freedom. The results generate a single measure that synthesizes those different variables.
To that end, this article makes three contributions to the media freedom literature. First, we apply Linzer and Staton's (Reference Linzer and Staton2015) dynamic, graded-response IRT model to analyze ten extant media freedom measures. The model generates cross-sectional, time-series data measuring media freedom in 197 countries from 1948 to 2017. The MSF data include a point estimate and a posterior standard deviation for 10,739 country-years. The data are valid and robust across numerous checks. Future researchers can include these data in empirical models that analyze media freedom to account for rater reliability and uncertainty among measurements. We especially recommend that researchers incorporate our measure's posterior standard deviation in analyses. Including these data in empirical modeling guards against results being the product of variable choice, allowing for greater confidence in inferences. Secondly, the IRT analysis indicates that V-Dem variables exert greater influence over the latent Media Freedom measure than other more commonly used indicators.
Finally, the article uses the new MSF data to reanalyze Egorov, Guriev and Sonin's (2009) study on resource wealth and media freedom. When we incorporate the MSF data – both point estimates as well as the posterior distribution in Monte Carlo simulation – the key findings do not hold. The replication suggests that including a measure that takes into account rater reliability significantly impacts the authors' results. Two other replications yield mixed results with these new data, while one successfully replicates.
Future work may wish to broaden the scope of these replications to examine some of their robustness checks, extend the samples by both country and year, and include additional empirical studies of media freedom. For instance, while Egorov, Guriev and Sonin's (2009) study covers the years from 1993 to 2008 and 147 countries, future work might extend the analysis to include more years and countries to test whether the theory holds beyond the current sample. In sum, treating media freedom as a latent variable and estimating an IRT model that incorporates different media freedom indicators creates a more robust measure of this complex concept.
Supplementary material
Data replication sets are available in Harvard Dataverse at: https://doi.org/10.7910/DVN/ENOEQS and online appendices at: https://doi.org/10.1017/S0007123420000101.
Acknowledgements
The authors would like to thank Ryan Kennedy, Eduardo Alemán, Elizabeth Stein, Jennifer Clark, the editors, and anonymous reviewers for helpful comments and suggestions. They also acknowledge excellent research assistance from V. Vera Choo and Christian Baehr. In addition, The authors acknowledge William & Mary Research Computing for providing computational resources and technical support that have contributed to the results reported within this paper (URL: https://www.wm.edu/it/rc). Finally, the authors recognize research support from the University of Houston (CLASS Dissertation Completion Fellowship).