Introduction
Simultaneous interpreting (SI) is a linguistic task in which the interpreters auditorily receive a message in a source language (SL) and they simultaneously have to reformulate and produced it in the target language (TL). A striking feature of interpreting is that many cognitive processes have to be performed simultaneously. Thus, the interpreter has to understand the incoming message, while reformulation and production processes of previous part of the discourse take place. According to Gile (Reference Gile, Danks, Shreve, Fountain and McBeath1997), this requires cognitive resources to maintain the information and to coordinate all the different mental operations that co-occur during interpreting (e.g., listening and understanding the original discourse, reformulation processes and speech production).
From a psychological perspective, working memory (WM) has been proposed to have a central role in interpreting (Christoffels, de Groot & Kroll, Reference Christoffels2006; Gile, Reference Gile, Danks, Shreve, Fountain and McBeath1997; Liu, Schallert & Carroll, Reference Liu, Schallert and Carroll2004). According to Baddeley (Reference Baddeley1986, Reference Baddeley1996, Reference Baddeley2000; see Miyake & Shah, Reference Miyake, Shah, Miyake and Shah1999, for alternative views) WM is composed of a central executive which is responsible for controlling and coordinating the flow of information from the two slave subsystems, the phonological loop and the visuo-spatial sketchpad. Finally, the episodic buffer is a multidimensional storage and processing component that keeps active information from the short-term stores and the Long-Term Memory (LTM) (Baddeley, Reference Baddeley2000). The phonological loop is divided in two subcomponents, a passive storage system which maintains verbal and acoustic information temporally (2 seconds approximately) and an articulatory rehearsal process, similar to subvocal speech, which refreshes the information to prevents its forgetting.
One way to explore the functioning of the phonological loop has been to study the articulatory suppression (AS) effect. This effect is assumed to disrupt the work of the phonological loop when participants are asked to overtly produce irrelevant speech (e.g., the word “the”) when they are concurrently memorizing a set of words. This concurrent articulation prevents the encoding of phonological information and thus, the subvocal rehearsal process is blocked. Although cognitive load is not excessive in AS conditions, the memory traces cannot be refreshed in this situation and recall is impaired (Baddeley, Reference Baddeley1986; Baddeley & Larsen, Reference Baddeley and Larsen2007; Murray, Reference Murray1968).
Simultaneous interpreting, in which there is a continuous overlap between comprehension and production processes, might be considered an extreme example of AS (Christoffels, Reference Christoffels2006; Daró, Reference Daró1997; Padilla, Bajo, Cañas & Padilla, Reference Padilla, Bajo, Cañas, Padilla and Tommola1995). However, interpreters are able to produce quality interpretations in this situation. In fact, previous research has demonstrated that the recall of professional interpreters is unaffected by AS conditions. Padilla et al. (Reference Padilla, Bajo, Cañas, Padilla and Tommola1995) asked a group of interpreters and control participants without training in professional translation to perform a free recall task under normal (silent) or AS conditions (Experiment 1). The recall of control participants was reduced under AS conditions relative to normal silent study conditions, while the recall of the professional interpreters was not affected by AS. Control participants and interpreters had comparable working memory capacities so that between-groups differences in recall performance were not due to this factor. Consequently, the authors suggested that although WM span is involved in successful interpretations, it does not underlie the ability to comprehend and produce simultaneously.
The present study aimed to investigate the mechanisms that allow professional interpreters to manage these concurrent cognitive processes in an efficient way. To this end, we explored three factors that might determine the lack of AS effect in professional interpreters: the material to be studied, the type of articulation and the rate of articulation (participants distributed their speech freely).
Material to be studied
The familiarity of the material to be studied influences the storage of information in WM. Gathercole and colleagues (Gathercole, Pickering, Hall & Peaker, Reference Gathercole, Pickering, Hall and Peaker2001) asked a group of participants to study and recall words and pseudo-words. The participants showed better recall for words than for pseudo-words and better recall for pseudo-words with high similarity with real words than for control pseudo-words. These results suggest that lexical−semantic knowledge associated with words stored in LTM supports the processing of information in WM. According to Gathercole and colleagues, LTM might facilitate the maintenance of information in the phonological loop or it might reconstruct decaying information in WM during the recall phase (Thorn & Gathercole, Reference Thorn and Gathercole2001). Padilla, Bajo and Macizo (Reference Padilla, Bajo and Macizo2005) addressed this issue directly by evaluating the AS effect in a group of professional interpreters (Experiment 3). The participants were presented words and pseudo-words in normal and in AS study conditions. The results corroborated the lack of AS effect with words. However, the recall of pseudo-words was reduced under AS condition. These results seem to indicate that interpreters use lexical−semantic information from LTM very efficiently so that they are able to encode information while successfully producing irrelevant speech.
Moreover, the effect of familiarity of the material to be studied on the functioning of WM seems to be related to the availability of semantic knowledge when participants memorize information. For example, high-frequency words are more likely to be processed semantically while the processing and learning of pseudo-words is based on phonological knowledge since they do not have semantic representations in LTM (Majerus, Poncelet, van der Linden & Weekes, Reference Majerus, Poncelet, van der Linden and Weekes2008; Papagno & Vallar, Reference Papagno and Vallar1992). The retention of pseudo-words in WM is difficult (Hulme, Maughan & Brown, Reference Hulme, Maughan and Brown1991), probably because they cannot be reconstructed in WM during the recall phase (Hulme, Roodenrys, Schweickert, Brown, Martin & Stuart, Reference Hulme, Roodenrys, Schweickert, Brown, Martin and Stuart1997; Romani, McAlpine, Olson, Tsouknida & Martin, Reference Romani, McAlpine, Olson, Tsouknida and Martin2005; Roodenrys, Hulme & Brown, Reference Roodenrys, Hulme and Brown1993). Accordingly, Papagno, Valentine and Baddeley (Reference Papagno, Valentine and Baddeley1991) showed that AS disrupted the acquisition of a foreign language unless the material could be semantically integrated.
All these results suggest that the lack of AS observed in professional interpreters when words are presented for study is due to their advantage in using semantic information stored in LTM, probably because the interpreters may have acquired superior linguistic abilities during their intensive training. In fact, previous research has shown that students of interpreting improved comprehension processes and lexical access after only one year of training in interpreting tasks (Padilla et al., Reference Padilla, Bajo, Cañas, Padilla and Tommola1995). However, this research has not addressed the relation between AS effect and the type of material to be studied in students of interpreting and professional interpreters. In the present study we evaluated whether the use of semantic information in AS conditions depends on the training of participants in professional interpreting.
Type of articulation
The continuous production of irrelevant sounds (e.g., the word “the”) in AS conditions might not have the same disruptive effect as the production of real discourse in interpreting tasks. The continuous repetition of the same word does not involve the generation of new representations that differ from the first produced utterance (Lewandowsky, Duncan & Brown, Reference Lewandowsky, Duncan and Brown2004). Thus, it could be argued that professional interpreters might not have interference in AS conditions from their concurrent articulations because these articulations are very simple relative to the discourses they produce when interpreting.
The effect of type of articulation in the processing of information in WM has been previously addressed. Jones, Macken and Nicholls (Reference Jones, Macken and Nicholls2004) found that repeating the same letter (A) in an irrelevant speech task did not increase WM load relative to a control silent condition. In contrast, when the letters were random, recall performance was reduced. In addition, Christoffels (Reference Christoffels2006) manipulated the complexity of articulations in AS conditions to evaluate the influence of producing meaningful words on the retention of texts. Dutch university students had to produce irrelevant sounds (simple AS condition, de, de, de) or a sequence of three real words (complex AS condition, cat, dog, mouse). The complex AS condition was more disruptive of recall than the simple AS condition. The authors concluded that meaningful words impose more cognitive load because they have to be activated from LTM and they interfere with the rehearsal and the recall of the studied material.
In the current study we explored how the complexity of the articulations in the AS conditions influences study and subsequent recall in control participants, students of interpreting and interpreters.
Articulation rate
In most of the studies on AS, the articulation rate is kept constant so that participants have to produce their articulations at a regular rate (e.g., about 2 or 3 repetitions per second approximately) (Baddeley, Hitch & Allen, Reference Baddeley, Hitch and Allen2009; Chen & Cowan, Reference Chen and Cowan2009; Richardson & Baddeley, Reference Richardson and Baddeley1975). However, this is an artificial situation which does not resemble the way interpreters produce their output in an interpreting task, where they regulate their productions according to the input rate.
To our knowledge, there is no empirical evidence on the effect of the articulation rate in AS situations. However, it has been shown that the time taken to pronounce words in a list influences performance in the recall phase (Baddeley, Thomson & Buchanan, Reference Baddeley, Thomson and Buchanan1975; Smith & Scholey, Reference Smith and Scholey1992). Moreover, other studies demonstrate that participants adjust the temporal parameters of their motor responses depending on the complexity of a concurrent task. For example, Shin and Rosenbaum (Reference Shin and Rosenbaum2002) asked participants to move the cursor between two dots at the time that they resolve arithmetic operations. The results showed that participants slowed down their motor movements depending on the difficulty of the concurrent task.
In the field of interpreting, articulation rates are not fixed, but interpreters take advantage of the natural pauses in the source speech to minimize the overlap between input and output and to reduce interference (Barik, Reference Barik1975; Goldman-Eisler, Reference Goldman-Eisler1972, Reference Goldman-Eisler and Butterworth1980). According to Gerver (Reference Gerver and Briskin1976), the best performance in interpretation is obtained when there is no overlap between tasks, so that interpreters use pauses in the listening to produce their interpretations. Therefore, it might be possible that interpreters have acquired the ability of controlling the temporal parameters of their productions while they comprehend new information simultaneously in order to reduce interference. Moreover, this ability might depend on the amount of training in interpreting since it has been suggested that professionals and novices differ in speech planning (Davidson, Reference Davidson1992; McDonald & Carpenter, Reference McDonald and Carpenter1981). Hence, in our study we sought to study the time distribution strategies of monolinguals, interpreting students and interpreters by allowing the participants to freely adjust their articulation rate. We were interested in knowing whether interpreters would make more efficient use of speech pauses and whether possible differences in speech rate may underlie variations in articulatory suppression effects.
The current study aimed to investigate WM functioning in simultaneous interpreters. To this end, we evaluated professional interpreters, students of interpreting and control participants in a free recall task under normal and AS conditions. Although free recall is not involved in interpreting, we selected this task to study articulatory suppression because it has been widely used in previous studies with professional interpreters (e.g. Padilla et al., Reference Padilla, Bajo and Macizo2005). We evaluated three factors that might determine the lack of AS effect observed in these previous studies. We investigated access to lexical−semantic representations during the retention phase by comparing the recall of words and pseudo-words. The possible influence of the complexity of articulations was examined by comparing the production of simple and complex irrelevant speech in AS conditions. Finally, the participants were asked to produce their outputs at their own rate so that we were able to evaluate possible temporal adjustments of their productions depending on other variables considered in the study.
Method
Participants
Monolingual controls, students of interpreting and professional interpreters participated in the study. The monolingual control group was composed of 20 undergraduate students from the University of Granada (18 women). They were monolingual speakers of Spanish without training in professional interpreting. Their mean age was 21.1 (SD = 2.29) and their mean memory span was 3.25 (SD = 1.09). The second group consisted of 20 students enrolled in an advanced course of Conference Interpreting from the School of Translators and Interpreters at the University of Granada (17 women, mean age = 22.8, SD = 5.52). The mean memory span was 3.94 (SD = 1.11) in this group. The third group of participants was composed of professional interpreters with more than 2.5 years of experience in simultaneous interpreting (M = 10.5 years) (9 women, mean age = 37.5, SD = 10.76). The mean WM span of this group was 4.20 (SD = 0.72).
The participants were asked to complete a Spanish version of the Reading Span Test (Daneman & Carpenter, Reference Daneman and Carpenter1980) before the experiment. In this test, participants are instructed to read sets of sentences presented one-by-one and to recall the sentence-final word after reading each set. The sets range from 2 to 6 sentences. The maximum number of final words correctly recalled represents the participants reading span. The results of one-way analysis of variance (ANOVA) performed on memory span revealed significant differences between the groups (F(2,55) = 4.64, MSE = 1.08, p < .05). The monolingual controls had lower memory span than the students of interpreting (F(1,55) = 5.21, p < .05) and the interpreters (F(1,55) = 7.66, p < .05). There were no significant differences between the students of interpreting and the interpreters (F < 1).
All the participants were native speakers of Spanish (L1). English was the second language (L2) for interpreting students and interpreters. We evaluated L2 proficiency of students and interpreters by the language history questionnaire previously used in our laboratory (Macizo & Bajo, Reference Macizo and Bajo2006; Macizo, Bajo & Martín, Reference Macizo, Bajo and Martín2010). Participants rated their skills in reading, oral comprehension, writing and speaking in L2 on a ten-point scale where 1 was not proficient and 10 was very proficient. L2 proficiency was similar in students (M = 8.46, SD = 0.55) and professional interpreters (M = 8.72, SD = 0.82) (F(1,36) = 0.61, MSE = 0.57, p > .05). In addition, participants were required to indicate the frequency of L2 use (write, read and speak) per week. L2 use was similar in students (M = 3.83 days per week, SD = 2.25) and interpreters (M = 3.93 days per week, SD = 2.25) (F(1,36) = 3.08, MSE = 3.01, p > .05).
The participants did not report any history of language problems. Participants were paid or received course credits for their participation.
Design and materials
Three conditions of articulatory suppression (silent, standard and complex) and the lexical status of the material to be studied (words and pseudo-words) were manipulated. The design of the experiment was a 3 × 2 × 2 mixed factorial with AS study condition and lexical status as within-participant variables and group of participants (monolingual controls, students and interpreters) as between-group variable. Six lists of 16 items were constructed. Three lists included Spanish words selected from the Alameda and Cuetos (Reference Alameda and Cuetos1995) frequency dictionary. The words included in these lists were unrelated. The lists of pseudo-words were created from Spanish words by replacing one letter so that these pseudo-words were orthographically correct in Spanish but without meaning. The lexical frequency of words was similar across lists. The mean frequency was 248 (SD = 350) in list 1, 200 (SD = 315) in list 2 and 194 (SD = 260) in list 3. Differences between lists were not significant (all ps > .05). The lexical frequency of words from which pseudo-words were constructed was comparable across lists (M = 151.53, SD = 183.99). The length of words (M = 6.16, SD = 1.31) and pseudo-words (M = 6.08, SD = 0.98) ranged between 4 and 9 letters and it was similar across lists (all ps > .05).
Procedure
Participants were tested individually in one session. They were asked to study lists of items (words and pseudo-words) in three AS study conditions: (1) normal study condition, (2) standard articulatory suppression condition and (3) complex articulatory suppression condition. In the normal study condition participants had to study the material in silence. In the standard study condition, participants studied the items while continuously producing the syllable “pa”. In the complex study condition, participants studied the items while continuously producing three real words (mesa, silla, sillón). The participants studied one list of words and one list of pseudo-words in each AS study condition. The order in which the lists of words and pseudo-words were presented was counterbalanced such that across participants each list was presented an equal number of times in each AS condition. In addition, the order in which AS conditions were presented was counterbalanced across participants.
The experiment was controlled by a Genuine-Intel 2993 MHz PC using E-prime experimental software, 1.1 version (Schneider, Eschman & Zuccolotto, Reference Schneider, Eschman and Zuccolotto2002). The lists were visually displayed. Each list started with a fixation point for 2 s, and afterwards the items were presented for 2 s with an inter-stimulus interval of another 2 s. At the beginning of each list, participants received instructions about how they had to study the items. After each list, a message remained on the screen for 2 minutes, indicating that participants had to write as many items as they could recall from the list. After finishing this recall phase, a new list was presented.
In the standard and complex AS study conditions participants were instructed to start their articulations from the onset of the fixation point indicating the beginning of the trial, until the end of the presentation of the items. They were asked to produce their verbalization at their own rate through the complete list. The oral productions were digitally recorded at a sampling rate of 44 KHz. At the beginning of each list, participants received four practice trials to familiarize them with the study condition. The experiment lasted 45 minutes approximately.
Results
For each participant and condition we computed the recall accuracy (mean percentage of items correctly recalled) and the distribution of the articulatory rate in the articulatory suppression study conditions.
Recall accuracy
As we will discuss later, the mean rate of articulations differed for each of the groups assessed. For this reason, we decided to conduct analyses of covariance (ANCOVAs) introducing the number of articulations as covariate. The analyses revealed a significant second-order interaction between AS condition (silent, standard and complex), lexical status of the items (words and pseudo-words) and group of participants (F(4,84) = 4.06, MSE = 131.19, p < .05). To qualify this interaction we assessed possible between-groups differences in AS effects as a function of the lexical status of the list of items to be studied.
Standard AS effects during the study of words
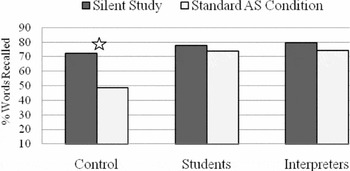
When we explored the standard AS effect (silent condition vs. standard AS), we observed an interaction between the AS condition and group (F(2,53) = 6.17, MSE = 101.64, p < .05). The monolingual controls recalled more words in the silent condition (M = 72.18, SD = 19.71) than in the standard AS condition (M = 48.72, SD = 25.89) (F(1,53) = 35.58, p < .05). In the group of students of interpreting there were no differences between the percentage of words recalled in the silent condition (M = 75.93, SD = 17.59) and in the standard AS condition (M = 70.62, SD = 20.38) (F < 1). Similarly, the percentage of words recalled in the silent condition (M = 78.12, SD = 14.42) and in the standard AS condition (M = 72.26, SD = 13.47) did not differ in the group of professional interpreters (F(1,53) = 2.01, p > .05) (see Figure 1).
Mean percentage of words recalled in each group of participants as a function of the study condition (Silent and Standard AS). *p < .05.

Complex AS effects during the study of words
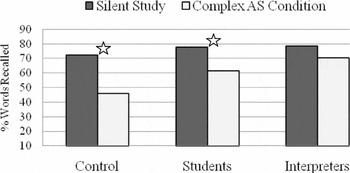
When we considered the differences between the groups in the complex AS condition (silent condition vs. complex AS), we obtained a significant interaction between AS condition and group (F(2,53) = 3.09, MSE = 163.23, p < .05). In the monolingual group there were differences in the percentage of words correctly recalled in the silent condition (M = 72.18, SD = 19.70) and in the complex AS condition (M = 45.93, SD = 20.79) (F(1,53) = 30.01, p < .05). These recall differences between the silent (M = 75.93, SD = 17.59) and the complex AS conditions (M = 60.62, SD = 21.74) were also found in the group of students of interpreting (F(1,53) = 14.16, p < .05). However, the differences between the silent condition (M = 78.12, SD = 14.42) and the complex AS condition (M = 71.04, SD = 15.79) did not reach significance in the group of professional interpreters (F(1,53) = 3.37, p > .05) (see Figure 2).
Mean percentage of words recalled in each group as a function of the study condition (Silent and Complex AS). *p < .05.

Standard AS effects during the study of pseudo-words
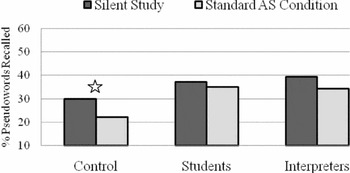
In the standard AS condition, the interaction between the AS condition (silent condition and standard AS) and the group of participants was marginally significant (F(2,53) = 2.55, MSE = 62.16, p = .08). The monolingual controls recalled more pseudo-words in the silent study condition (M = 30.01, SD = 12.58) than in the standard AS condition (M = 22.18, SD = 11.55) (F(1,53) = 12.38, p < .05). The students of interpreting had a comparable recall performance in the silent (M = 35.93, SD = 13.88) and standard AS study conditions (M = 34.86, SD = 11.08) (F < 1). Likewise, professional interpreters did not show differences in the percentage of recalled pseudo-words between the silent condition (M = 38.54, SD = 15.19) and the standard AS condition (M = 34.31, SD = 15.15) (F(1,53) = 2.22, p > .05) (see Figure 3).
Mean percentage of pseudo-words recalled in each group as a function of the study condition (Silent and Standard AS). *p < .05.

Complex AS effects during the study of pseudo-words
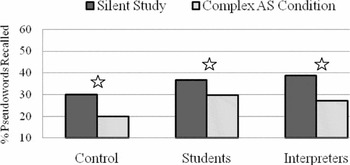
Finally, when we examined the complex AS effect in pseudo-words, the interaction between the AS condition (silent condition and complex AS) and the group of participants was not significant (F < 1). The differences in the percentage of pseudo-words correctly recalled were significant in the monolingual group (silent condition: M = 30, SD = 12.59; complex AS condition: M = 20.01, SD = 13.38, F(1,53) = 9.51, MSE = 69.89, p < .05), in the group of interpreting students (silent condition: M = 35.93, SD = 13.88; complex AS condition: M = 30.01, SD = 8.01, F(1,53) = 5.74, p < .05) and in the group of professional interpreters (silent condition: M = 38.54, SD = 15.19; complex AS condition: M = 28.58, SD = 10.79, F(1,53) = 14.44, p < .05) (see Figure 4).
Mean percentage of pseudo-words recalled in each group as a function of the study condition (Silent and Complex AS). *p < .05.

In summary, the results regarding recall accuracy indicated that the participants without training or expertise in interpreting showed standard AS effects and complex AS effects irrespective of the lexical status of the material to be studied. In contrast, the students of interpreting did not show standard AS effect with words and pseudo-words, but they reduced their recall under the complex AS study condition relative to the silent study of words and pseudo-words. Finally, the only condition in which professional interpreters showed AS effects was that in which they studied pseudo-words under complex AS conditions.
Distribution of the articulatory rate
For each participant we computed the articulatory rate in the standard AS condition (total number of pa) and in the complex AS condition (total number of words mesa, silla, sillón). Afterwards, we analyzed the number of articulations depending on whether they were produced when the stimulus to be studied was presented on the screen (full screen) or in the between-stimuli interval (empty screen).
The ANOVA performed on the mean number of articulations with AS condition (standard and complex), lexical status of items (words and pseudo-words) and group of participants (monolingual controls, students and interpreters), showed a main effect of group (F(2,53) = 23.98, MSE = 4578.01, p < .05). The group of monolingual controls produced more articulations (M = 157.55, SD = 34.91) than the students of interpreting (M = 86.34, SD = 36.16) (F(1,53) = 39.36, p < .05) and the professional interpreters (M = 94.64, SD = 29.11) (F(1,53) = 28.46, p < .05). The number of articulations for the groups of interpreting students and interpreters did not differ (F < 1). The main effect of lexical status was significant (F(1,53) = 17.34, MSE = 1277.89, p < .05). The participants produced more articulations when they studied pseudo-words (M = 123.48, SD = 48.83) than when they studied words (M = 102.19, SD = 46.98).
In addition, the place in which participants produced their articulations was significant (F(1,53) = 43.87, MSE = 0.26, p < .05), indicating that there were more articulations in the between-items interval (M = 2.31, SD = 0.95) than when the items were presented on the screen (M = 1.94, SD = 0.73). Moreover, the interaction between place of articulation and group of participants was significant (F(2,53) = 9.79, MSE = 0.26, p < .05). Although all participants produced more articulations in the between-item interval, this difference was larger in the group of monolingual controls (F(1,53) = 56.27, p < .05) than in the interpreting students (F(1,53) = 3.99, p < .05) and the professional interpreters (F(1,53) = 4.14, p < .05). None of the other main effects or interactions approached significance (all ps > .05).
In summary, the group of monolingual controls produced more articulations than the students of interpreting and the professional interpreters. The distribution of the articulation rate showed that all the participants produced more articulations in the between-items interval than when a stimulus was presented on the screen, although this difference was larger in the group of monolingual controls.
Discussion
The present study aimed to investigate the capacity of professional interpreters to perform concurrently comprehension and production tasks. In simultaneous interpreting, the professionals are continuously and efficiently analyzing the SL and producing their translation in the TL. Empirical evidence regarding the interpreters’ capacity for coordinating comprehension and production comes from studies about the AS effect (Padilla et al., Reference Padilla, Bajo and Macizo2005). Monolingual controls reduce their recall of words when they are asked to study words at the time they produce irrelevant speech. However, the recall of professional interpreters remains unaffected by the production of irrelevant speech during the study phase. In the current study, we explored the superiority of interpreters in AS conditions by examining three factors: the material to be studied, the complexity of the articulations and the articulatory rate. In addition, we evaluated whether the capacity of coordinating comprehension and production in AS conditions is modulated by the experience in interpreting. To this end, we compared monolingual controls without training in translation, interpreting students and professional interpreters.
The results obtained in the experiment showed that the recall of the monolingual controls was reduced in the AS condition relative to the normal study condition in which they studied items silently. The group of monolingual controls showed AS effect regardless of the material to be studied (words, pseudo-words) and the complexity of the AS condition (standard or complex). The students of interpreting showed AS effects when the difficulty of the task increased due to the complexity of the articulations (complex AS). Thus, they only showed AS effects when they had to produce three real words (mesa, silla, sillón), while their recall was unaffected by the standard AS condition (producing pa). Finally, the only situation in which professional interpreters showed AS effects was when task demands were extreme (complex AS condition during the study of pseudo-words). At first glance, differences across groups of participants might be explained because of the variability among them in two factors, articulatory rate and WM capacity. In fact, the monolingual controls produced more articulations than the other two groups. Therefore, it could be argued that the monolingual controls were focusing on producing their articulations instead of memorizing the stimuli which produced AS effects. However, the data do not support this interpretation since the differences among the groups were observed after controlling the rate of articulation (covariate analyses).
In addition, it would be possible to argue that the presence of AS effect was produced by differences in WM capacity between the groups. However, this suggestion can also be ruled out. First, previous studies have shown differences between professional interpreters and participants without training in translation even when WM span was similar in both groups (e.g., Padilla et al., Reference Padilla, Bajo, Cañas, Padilla and Tommola1995). Second, in the current study, the WM span for the interpreting students (M = 3.94) and the interpreters (M = 4.20) was similar (F < 1), while they differ in the observed AS effects. Finally, in order to control for the possible contribution of WM span in the AS effects, we performed new analyses where this variable was introduced as covariate. The pattern of results was the same as that reported in the results section. When participants studied words, there was a significant interaction between standard AS condition and group (F(2,53) = 8.11, MSE = 94.61, p < .05), which revealed AS effect only in the group of monolingual controls when they studied words (silent: M = 72.18, SD = 19.71; standard: M = 48.72, SD = 25.89), and a significant interaction between complex AS condition and group (F(2,53) = 4.61, MSE = 166.85, p < .05), that showed complex AS effect in monolingual controls (silent: M = 72.18, SD = 19.71; complex: M = 45.93, SD = 20.79) and the students (silent: M = 75.73, SD = 17.59; complex: M = 62.49, SD = 21.74). Likewise, when participants studied pseudo-words, an interaction between study condition and group showed that only the monolingual controls showed standard AS effect (F < 1) (silent: M = 30.01, SD = 12.58; standard: M = 22.18, SD = 11.55). However, there were complex AS effects with pseudo-words in all groups (all ps < .05), the monolingual controls (silent: M = 30.01, SD = 12.59; complex: M = 20, SD = 13.38), the students group (silent: M = 35.66, SD = 13.88; complex: M = 29.41, SD = 8.01) and the interpreters group (silent: M = 41.66, SD = 15.19; complex: M = 28.12, SD = 10.79). Therefore, neither the number of articulations nor the participants’ WM span can explain the superiority of the interpreters in AS situations. Next, we discuss the role of the three variables assessed in the study, that is, the material to be studied, the type of articulation and the articulatory rate.
Material to be studied
When participants studied lists of words or pseudo-words at the time they produced the syllable pa (standard AS condition), only the monolingual controls reduced their recall accuracy relative to the condition in which they studied words silently. This pattern of results seems to suggest that the semantic knowledge associated with words did not have beneficial effects on memory since no differences were found between the recall of words and pseudo-words in the standard AS conditions. However, this preliminary conclusion is modulated by the complexity of the task. When the difficulty of the production task increased (complex AS condition), professional interpreters did not show AS effects with words while they reduced their recall in AS conditions during the study of the pseudo-words. Therefore, the results of the present study indicate that the occurrence of AS effects depends on the type of material to be studied. The availability of lexical−semantic information associated with the material to be studied seems to facilitate the reactivation of information in WM during the study phase (Padilla et al., Reference Padilla, Bajo and Macizo2005). It is possible that students of interpreting and professional interpreters have developed abilities to rapidly retrieve lexical−semantic information from LTM to favour the maintenance of information in WM. For example, students of interpreting and professional interpreters have been trained in note-taking skills from lectures and readings in the SL, and this may make them easily retrieve and maintain the contents to be translated into the TL (Lambert, Reference Lambert and Hammond1988).
However, the pattern of results obtained in this study contrasts with the findings reported in previous research about the role of lexical−semantic information on the AS effect. Padilla et al. (Reference Padilla, Bajo and Macizo2005) demonstrated that professional translators did not show AS effects with words but they reduced their recall in AS conditions with pseudo-words. On the contrary, in the simple AS condition of our study which was similar to the AS condition in Padilla et al., professional interpreters did not show AS effects regardless of the material to be studied (words or pseudo-words). The differences between studies might be determined by the articulatory rate imposed during AS conditions. Following previous studies (Baddeley, Reference Baddeley1986; Baddeley & Larsen, Reference Baddeley and Larsen2007; Murray, Reference Murray1968), the participants in the Padilla et al.'s study were asked to produce their articulations at a regular rate. However, in our study, the participants produced their articulations at their own rate and they did not distribute them uniformly, which might have implications for the encoding of information in the study phase (see below for further discussion).
Type of articulation
In previous studies regarding AS effects, the participants are usually asked to produce repeatedly a syllable with no specific meaning (e.g., the syllable pa). The overt production of this syllable while simultaneously memorizing words is a sufficient condition to produce AS effects. Since this syllable has no meaning, it can be concluded that AS effect is the result of phonological interference during the retention of words.
In the current study we evaluated the consequences of generating complex productions on the study of words. To this end, standard AS conditions (the production of the syllable pa during the retention of words) was compared with complex AS condition (the production of three real words, mesa, silla, sillón). The pattern of results corroborates Christoffels's (Reference Christoffels2006) study in that the negative effect of AS on recall was larger in complex AS situations relative to standard AS conditions. For example, the students of interpreting that did not show standard AS effect reduced their recall under complex AS situations. It has been suggested that the complexity of utterances in WM tasks increases the cognitive load so that the participants may have reduced resources to deal with the retention of words (Jones et al., Reference Jones, Macken and Nicholls2004). This hypothesis is also supported by the results obtained with professional interpreters, since they only showed complex AS effect during the study of pseudo-words. Consequently, these results suggest that the interpreters could benefit from the use of semantic information retrieved from LTM during the retention of words, and thus they were able to reduce the cognitive load associated with speech production. However, when they could not benefit from this information during the encoding of the pseudo-words, they were affected by the simultaneous production of real words.
Unfortunately, from our data we cannot determine the nature of the cognitive load associated to this complex AS condition. It might be phonological since the string of sounds to be maintained and produced (three words, six syllables total) was larger than that in the standard condition (one syllable). However, it is also possible that the cognitive load in complex AS was due to the retrieval of semantic information associated with the three words to be produced in this condition. If that was the case, access to semantic information in AS conditions can benefit or hinder performance depending on the process in which this information is used. The availability of semantic information in the comprehension and retention of words facilitates the recall of items (see earlier section). On the other hand, the retrieval of semantic information for the production of irrelevant speech in complex AS might interfere with the study and maintenance of information that has to be recalled later. However, this issue needs further investigation.
In addition, the fact that professional interpreters did not show complex AS effects when they studied words suggests a better control of the production process related to the experience in interpreting. Previous studies indicate that some of the tasks involved in interpreting become highly automatized with experience (Hirst, Spelke, Reaves, Caharack & Neisser, Reference Hirst, Spelke, Reaves, Caharack and Neisser1980). Professional interpreters shift their attention between input and output continuously depending on the demands of the SL and TL, so they become less prone to interference (Daró, Reference Daró1989; de Groot, Reference De Groot, Tirkkonen-Condit and Jääskeläinen2000; Gile, Reference Gile, Danks, Shreve, Fountain and McBeath1997; Moser-Mercer, Reference Moser-Mercer2005). Additionally, empirical evidence indicates that, after intensive practice, professional interpreters ignore the sound of their voice so they can focus on processing the input while ignoring their outputs (Daró & Fabbro, Reference Daró and Fabbro1994; Gerver, Reference Gerver and Foulke1969). This shift of attention to the processing of input while dismissing the output might explain why the professional interpreters successfully performed the study of words at the same time that they produced complex articulations.
Articulatory rate
In this study participants were asked to produce their speech at their own rate in AS conditions. The control group produced more irrelevant speech than the other two groups. However, as stated previously, these differences cannot account for the among groups variability observed in AS. However, more interesting were the differences in the distribution of articulations. All the participants produced more articulations when the items to be memorized were not presented (empty screen). However, this asymmetry was larger in the control group than in the group of students and professional interpreters. That is, participants with training in interpreting balanced their production between the input encoding (full screen) and the maintenance of words (empty screen). This balanced distribution of the articulations in participants with training in interpreting seems to be related to their skill in regulating the processing and retention of SL during a simultaneous interpreting task (Barik, Reference Barik1975; Goldman-Eisler, Reference Goldman-Eisler1972; Lee, Reference Lee1999). For example, although a regular speech rate in interpreting is desirable for the audience, the interpreters’ productions are rarely constant. Thus, they wait until a meaningful unit of information has been processed to start their production (Goldman-Eisler, Reference Goldman-Eisler1972). Also, they delay their speech when the input is difficult to understand (semantic−syntactic complexity; Treisman, Reference Treisman1965), and they lag further behind when the input rate increases (Barik, Reference Barik1975).
The pattern of results obtained in the present study can be accommodated within Baddeley's (Reference Baddeley1986, Reference Baddeley2000) WM model. In AS conditions, the rehearsal function of the phonological loop is blocked. This blocking effect might interfere with building an episodic structure in the episodic buffer for retrieving words in the recall phase (Christoffels, Reference Christoffels2006). The articulation of meaningful items (complex AS) might also interfere with the episodic retention of words. However, the availability of semantic information retrieved from LTM (the retention of words relative to pseudo-words) might attenuate this interfering effect in the interpreters probably because they rapidly transfer information from the phonological loop to the episodic buffer.
To conclude, the present study indicates that experience in interpreting favours the development of skills that make the interpreters successfully perform simultaneous comprehension and production process. Thus, in an articulatory suppression task, professional interpreters only showed interference when they produced complex articulations and memorized pseudo-words. These results emphasize the role of activating semantic information from LTM during AS tasks. The availability of lexical−semantic information during AS tasks seems to benefit or hinder performance depending on the balance between the comprehension and production processes that participants perform concurrently. Hence, the availability of semantic information can benefit the study of words probably by the refreshing of memory traces or by favouring reconstruction of information in the recall phase. However, when participants produce irrelevant speech which is semantically rich, the cognitive load associated with the articulation of the output might greatly interfere with input enconding.