Introduction
Within the ovarian follicle, granulosa cells (GCs) play a key role in creating a suitable environment for oocyte growth and determining the proper endocrine conditions for breeding and fertilization (for review see Eppig et al., Reference Eppig, Chesnel, Hirao, O’Brien, Pendola, Watanabe and Wigglesworth1997). During follicle antral formation, granulosa cells differentiate into at least three cell phenotypes that have different tasks, i.e. cumulus, corona radiata and mural cells. Cumulus cells surround the oocyte and play a crucial role in oocyte growth by transducing metabolic signals, secreting growth factors and controlling GC growth and endocrine activity (Gilchrist et al., Reference Gilchrist, Ritter and Armstrong2004). The inner layer of cumulus cells, i.e., corona radiata cells, allows a bidirectional communication with the oocyte via cytoplasmic projections passing through the zona pellucida and in establishing gap-junctions with the oocyte plasma membrane (Albertini et al., Reference Albertini, Combelles, Benecchi and Carabatsos2001). A cross-talk between the oocyte and corona radiata cells occurs during oogenesis (Gilchrist et al., Reference Gilchrist, Ritter and Armstrong2004; Tosti et al., Reference Tosti, Boni, Gallo and Silvestre2013). Some molecules that are necessary for oocyte growth and maturation pass directly from the follicle antrum to the oocyte (Thomas et al., Reference Thomas, Ethier, Shimasaki and V anderhyden2005).
Mural granulosa cells (GC) cover all the inner side of the follicle wall and are mainly involved in steroidogenic activity. This activity is common to several endocrine cells and occurs via hydroxylases and aromatase belonging to the cytochrome P (CYP)450 supergene family (Nebert et al., Reference Nebert, Adesnik, Coon, Estabrook, Gonzalez, Guengerich, Gunsalus, Johnson, Kemper and Levin1987). The enzymes involved in steroidogenic activity are located both in mitochondria and in endoplasmic reticulum.
Steroidogenesis begins with the transfer of cholesterol into mitochondria. Steroidogenic acute regulatory (StAR) protein acts as a cholesterol carrier from the outer to the inner mitochondrial membrane and regulates the rate-limiting step in steroid biosynthesis. Following splicing of a peptide side chain, cholesterol is trapped into mitochondria and converted by cytochrome P450scc (CYP11A) into pregnenolone, which is the precursor of androgens, progesterone and oestrogen hormones. After that, steroid hormone synthesis occurs via either the 3β-hydroxysteroid (Δ5) or the 3-ketone (Δ4) pathways. Oestrogens, i.e 17β-oestradiol and oestrone, are synthesized from the 4-ene-C19 steroids testosterone and androstenedione, respectively, by an aromatase complex (i.e. CYP450arom or CYP19) in the agranular endoplasmic reticulum (Henricks, Reference Henricks1991). Based on these regulatory processes, oestrogen synthesis in GCs does not involve mitochondrial activity that is necessary for the Δ5 and Δ4 pathways (Duarte et al., Reference Duarte, Castillo, Podestá and Poderoso2014). Changes in the StAR transcript during follicle growth have been evaluated in cattle (Bao et al., Reference Bao, Calder, Xie, Smith, Salfen, Youngquist and Garverick1998). StAR mRNA was essentially localized in the theca cell layer while scarcely detected in GCs (Sahmi et al., Reference Sahmi, Nicola, Silva and Price2004). A slight presence of StAR has been highlighted in smaller follicles that were severely affected by atresia (Sahmi et al., Reference Sahmi, Nicola, Silva and Price2004). The precise mechanism involved in regulation of the StAR gene has not yet been established, however it involves a complex machinery of hormones, growth factors and multiple signalling pathways (Manna et al., Reference Manna, Dyson and Stocco2009).
Mitochondria play vital role in cells controlling the energy-dependent mechanisms that generate ATP and in maintaining cellular homeostasis. Loss of membrane potential leads to uncoupling of oxidative phosphorylation, oxygen radical generation, and activation of caspases, which induces DNA fragmentation (Backway et al., Reference Backway, McCulloch, Chow and Hedley1997). Mitochondrial membrane potential (MMP) is a metabolic indicator that is highly related to cellular energy metabolism and oxidative stress (Garner et al., Reference Garner, Thomas, Joerg, Dejarnette and Marshall1997; Wu et al., Reference Wu, Dunning, Yang, Russell, Lane, Norman and Robker2010; Boni et al., Reference Boni, Gallo and Cecchini2017; Gallo et al., Reference Gallo, Menezo, Dale, Coppola, Dattilo, Tosti and Boni2018). It is not clear if changes MMP influence either Δ4 or Δ5 pathways. In fact, the mitochondrial spontaneous release of cytochrome c under apoptotic conditions is not associated with MMP changes (Kluck et al., Reference Kluck, Bossy-Wetzel, Green and Newmeyer1997). Conversely, studies on Leydig cells demonstrated that mitochondria must be energized, polarized, and actively respiring to support steroidogenesis. In addition, alterations in the mitochondrial state have been shown to be involved in regulating steroid biosynthesis (Allen et al., Reference Allen, Shankara, Janus, Buck, Diemer, Held Hales and Hales2006).
To date, there has been no information on MMP in bovine GCs and very scarce information is available on StAR protein expression that represents indicators of the Δ4 and Δ5 pathways. The aim of this study was to evaluate the presence and the dynamics of these indicators in GCs collected from bovine ovarian follicles with different sizes and atresia grades. The degree of follicular atresia has been estimated by morphological evaluations conducted on either the follicle wall or the internal cumulus–oocyte complex (COC). These atresia estimations were validated by terminal deoxynucleotidyl transferase fluorescein-dUTP nick-end labelling (TUNEL) assay for apoptosis detection (Zeuner et al., Reference Zeuner, Müller, Reguszynski and Jewgenow2003; Boni et al., Reference Boni, Cocchia, Silvestre, Tortora, Lorizio and Tosti2008).
Materials and methods
Reagents
Polyvinyl alcohol (PVA), Penistrepto solution (10,000 units penicillin and 10 mg streptomycin per ml in 0.9% NaCl, 100× working solution), heparin sodium, sodium azide, water and all reagents used to prepare culture medium were purchased from Sigma Italia (Milan, Italy) and cell culture tested. Phosphate-buffered saline (PBS) 1× (pH 7.4), Sea Blocker, chemiluminescent peroxidase substrate-1, carbonyl cyanide 3-chlorophenylhydrazone (CCCP), 5,5′,6,6′-tetrachloro-1,1′,3,3′-tetraethylbenzimidazolyl-carbocyanine iodide (JC-1) and 4′,6-diamidino-2-phenylindole (DAPI) were obtained from Life Technologies (Milan, Italy).
Primary goat polyclonal antibodies against StAR (K-20) and donkey anti-goat IgG-fluorescein isothiocyanate (FITC) (sc-2024) were purchased from Santa Cruz Biotechnology Inc. (Heidelberg, Germany). Monoclonal mouse anti-β-actin and goat anti-mouse IgG−HRP antibodies were purchased from Sigma Italia (Milan, Italy). In Situ Cell Death Detection Kit and DNase I were obtained from Roche Diagnostics (Milan, Italy).
Ovary source
Ovaries (total n = 114) were collected at the abattoir from 18- to 24-month-old Limousine and Charolaise heifers with the presence of at least one corpus luteum attesting their sexual activity. They were transferred in the laboratory within thermal bags at +4°C. Ovaries were first washed in sterile saline solution, then with 70% ethanol, and again with sterile saline solution.
Follicle dissection
Follicles were dissected from ovarian stroma with fine forceps and tweezers and washed with PBS supplemented with PVA, Penistrepto (i.e., washing medium, WM) and heparin (5000 IU/ml).
Each follicle was sized by a caliper, and morphologically evaluated under stereomicroscope to estimate its degree of atresia (Kruip and Dieleman, Reference Kruip and Dieleman1982) and classified in three categories, i.e. non-atretic (NA), light atretic (LA), atretic (A). In brief, this classification was based on the grade of vascularization and opacity of the follicle wall as well as on the presence and amount of free-floating material in the follicle fluid at follicle rotation. Each follicle was opened and scraped with a scalpel to allow the recovery of the GC within the follicular fluid. This was observed under the stereomicroscope to isolate the COC, which had been morphologically assessed (Boni et al., Reference Boni, Cuomo and Tosti2002). COCs were classified according to the morphology of the cytoplasm and the cumulus oophorus characteristics were designated as follows: A-COC, presence of a clear and compact cumulus and translucent ooplasm; B-COC, dark and compact cumulus and dark ooplasm; and C-COC, dark and expanded cumulus and dark ooplasm (Boni et al., Reference Boni, Cuomo and Tosti2002). Any COCs showing intermediate characteristics or characteristics not corresponding to these criteria led to the exclusion of the COC quality data. This COC classification has been previously related to the atresia grade of the corresponding follicle (Wurth et al., Reference Wurth, Boni, Hulshof and Kruip1994; De Wit et al., Reference De Wit, Wurth and Kruip2000).
Experimental design
Follicles were dissected from the ovaries and classified according to their size as well as follicle and COC morphology. The study was repeated nine times for MMP and StAR protein expression and four times to compare atresia estimation using follicle versus COC morphological evaluations based on TUNEL analysis. Each time, a limited number of ovaries (from 8 to 10) was collected from the slaughterhouse and a limited number of follicles (from 8 to 12) was selected in the laboratory and used for the experiment. This procedure allowed the maintenance of a short interval between ovary and GC collection. In addition, we tried to keep a representative distribution of follicle sizes and atresia grades among replicates. After size measurement, follicles were allocated in three size class groups, i.e 4−7, 8−11 or 12−15 mm diameter. In each size class, follicles with different atresia grades were admitted just once.
Collection of granulosa cells
The follicular fluid containing the GC of each follicle was filtered on a 50 μm nylon mesh. After a double wash with WM (10 min at 200 g), cells were suspended in 1 ml of WM. Next, cells were kept in suspension in 2 ml Eppendorf tubes using a thermoshaker (PCMT, Grant, Cambridge, UK) at 1000 rpm and 4°C. A Bürker chamber was used for cell counting. Finally, the GCs from each sample were divided into three groups. The first group was used fresh to evaluate the MMP, the second was frozen at −80°C for WB and the third was fixed for subsequent immunofluorescence and TUNEL assays.
Evaluation of mitochondrial membrane potential
Mitochondrial membrane potential was evaluated using the mitochondrial stain JC-1. This dye has the advantage over other mitochondria-specific fluorochromes of differentiating between relatively high and low membrane potentials (Gallo et al., Reference Gallo, Menezo, Dale, Coppola, Dattilo, Tosti and Boni2018). Freshly collected GC were suspended in WM to obtain a concentration of approximately 1 × 10⁶ cells/ml and incubated with 5 μM JC-1 at room temperature (25°C) for 30 min. Aliquots of JC-1 were prepared from a 7.7mM stock solution in DMSO, and stored at −20°C and protected from light. JC-1 is a cationic carbocyanine dye that exhibits potential-dependent accumulation in mitochondria, indicated by a fluorescence emission shift from red (∼595 nm) to green (∼535 nm). The potential-sensitive colour shift is due to red fluorescent J-aggregates whose concentration decreases together with mitochondrial membrane depolarization (Aitken et al., Reference Aitken, Gibb, Mitchell, Lambourne, Connaughton and De Iuliis2012). Consequently, mitochondrial membrane depolarization is indicated by a decrease in red/green fluorescence intensity ratio.
After incubation, GC suspensions were washed with WM and centrifuged at 200 g for 10 min. The supernatant was removed and the pellet resuspended in 1 ml of the same medium. During each experiment, one JC1-loaded GC sample was randomly used as the negative control and prepared by adding CCCP to a final concentration of 2 μM, 1 h before reading (Boni et al., Reference Boni, Gallo, Montanino, Macina and Tosti2016). CCCP is a protonophore that uncouples oxidative phosphorylation in mitochondria, resulting in a decrease in mitochondrial membrane potential.
The fluorescence spectra were recorded in duplicate: 400 μl of each sample was placed in a 10 × 4 mm quartz cuvette (Hellma Analytics, Müllheim, Germany) and read with a spectrofluorometer (Cary Eclipse, Agilent Technologies Italia, Rome, Italy). The excitation wavelength was set at 490 nm, and the emission spectrum was recorded in the range of 500–650 nm. The MMP was measured by evaluating the ratio of the fluorescence peak values at ∼595 nm and ∼535 nm (Boni et al., Reference Boni, Gallo, Montanino, Macina and Tosti2016, Reference Boni, Gallo and Cecchini2017).
Western blotting (WB) analysis
Granulosa cell samples containing approximately 4 × 10⁵ cells were collected from follicles homogeneously selected in relation to their size class (small, medium and large) and atresia grade based on COC morphological evaluation (A, B and C classes). They were frozen and stored at −80°C. Western blotting was performed, with some changes, as previously described (Miglionico et al., Reference Miglionico, Gerbino, Ostuni, Armentano, Monné, Carmosino and Bisaccia2016). In brief, cells were lysed in Laemmli sample buffer (20% glycerol, 100 mM Tris−HCl pH 6.8, 2% (w/v) SDS, 0.02% (v/v) β-mercaptoethanol, 0.083% bromophenol blue) with three freezing−thawing cycles. Proteins were separated on 15% SDS-polyacrylamide gels and transferred onto nitrocellulose membranes. After blocking with non-fat dried milk in PBS with 0.05% Tween 20 (PBS-T), membranes were incubated overnight at 4°C with 1:200 K-20 antibody and with 1:500 monoclonal mouse anti-β-actin antibody followed by incubation with 1:5000 donkey anti-goat IgG−HRP antibody and with 1:5000 goat anti-mouse IgG−HRP antibody, respectively, for 1 h at 25°C. The membranes were washed three times for 10 min with PBS-T and signals visualized by chemiluminescent peroxidase substrate-1, using the Chemidoc™ XRS detection system equipped with Image Lab Software for image acquisition (BioRad Italia, Milan, Italy). Densitometric analysis was performed using ImageJ software (National Institute of Health, Bethesda, MD, USA).
Fixation of granulosa cells
Aliquots of each collected sample were fixed for 1 h with 4% formaldehyde using a 1:1 ratio with the GC suspension in PBS. After fixation, cells were washed with PBS at 200 g for 10 min and stored at 4°C, up to a few weeks, in PBS supplemented with 0.1% PVA and 0.1% sodium azide.
Apoptosis detection
DNA fragmentation was evaluated by using the In Situ Cell Death Detection (TUNEL) Kit following the manufacturer’s instructions. Fixed GC were suspended in WM in order to obtain a concentration of approximately 1.5 × 10⁶ cells/ml, washed with WM for 10 min at 200 g and, then, incubated for 2 min on ice with a permeabilization solution (0.1% Triton X-100 in 0.1% sodium citrate). After a double wash with WM, GC were incubated with the TUNEL reaction mixture (containing the terminal deoxynucleotidyl transferase and the fluorescein-dUTP label solution) for 1 h at 37°C in the dark. Negative controls were prepared by omitting the label solution from the reaction mixture. Fixed and permeabilized GCs treated with 3 IU DNase/ml were used as a positive control. Before spectrofluorometric analysis, GCs were counterstained with 0.3 μg/ml DAPI. Fluorescein and DAPI fluorescence intensity peaks were obtained at 488 and 350 nm excitation wavelengths and measured at 520–530 and 450–460 nm emission wavelengths, respectively. DNA fragmentation was calculated as the ratio between fluorescein and DAPI fluorescence emission peak values (Gallo et al., Reference Gallo, Boni, Buttino and Tosti2016).
Immunofluorescence (IF) analysis
Fixed GC were washed with WM for 10 min at 200 g and, then, incubated for 30 min at RT with a blocking buffer, i.e. a 10% solution of Sea Blocker in PBS, in order to block non-specific antigenic sites. After a double wash with PBS at 200 g for 10 min, each sample was divided into two tubes receiving the primary polyclonal antibody, anti-StAR (K-20). The immune serum was diluted 1:100 and incubated with the samples for 90 min at RT. Negative controls were performed by omitting the primary antibody, which was replaced by 1:100 diluted caprine serum. Subsequently, the cells were double washed with PBS-T and incubated in the dark for 60 min with 1:200 anti-goat IgG−FITC (sc-2024), i.e. an affinity purified secondary antibody raised in donkey against goat IgG and conjugated to fluorescein isothiocyanate (FITC). After incubation, GC were double washed with PBS (10 min at 200 g). The fluorescence intensity (excitation = 482 nm, emission = ∼532 nm) was evaluated using a fluorescence microscope (EVOS Floid Cell Imaging Station, Life Technologies, Carlsbad, CA, USA). Three fields and 30–40 cells were examined per sample. The fluorescence intensity was evaluated using ImageJ software. In particular, the fluorescence intensity (F) was expressed in arbitrary units calculated by subtracting the intensity of background fluorescence (F0) measured on areas free of cells in each record field. In all experiments, single-cell analysis was performed by highlighting the cell with the ‘wizard’ procedure and recording its fluorescence intensity (F − F0).
Confocal laser scanning microscopy analysis
Each fluorochrome used in this study was first evaluated by confocal laser scanning microscopy (Leica TCS SP5, Leica Microsystems, Wetzlar, Germany) to assess its localization within a specific cell compartment.
Statistical analysis
Statistical analyses were performed using Systat 11.0 (Systat Software Inc., San Jose, CA, USA). The data for each sample were entered into a spreadsheet as follows: the day of sampling, the replication number, follicle size, degree of atresia, and evaluated on the basis of morphological characteristics of the follicle (NA, LA, A) and the COC (A, B, C). The MMP and the StAR protein expression evaluated either as IF (expressed as relative fluorescence intensity) or WB (expressed as StAR/β-actin band ratio) analysis.
The effect of follicle size and atresia grade on MMP and StAR protein expression as well as the discriminatory capacity to evaluate the atresia grade based on follicle and COC morphologies at TUNEL assay were analyzed by the Kruskal–Wallis test (Systat 11.0 release). The threshold of P <0.05 was used as the minimum level of statistical significance. All results are reported as mean ± standard error (SE).
Results
In total, 93 follicles were utilized for MMP and StAR protein expression during the 11 ovary collection sessions; the diameter of these follicles ranged from 4 to 15 mm. The number of GC obtained after filtration ranged from 0.2 × 10⁶ up to 5 × 10⁶ per follicle. Follicles with a number of GC lower than 1 × 10⁶ were grouped with follicles showing the same size and COC-based atresia grade. These combined follicles were subsequently identified as single follicles.
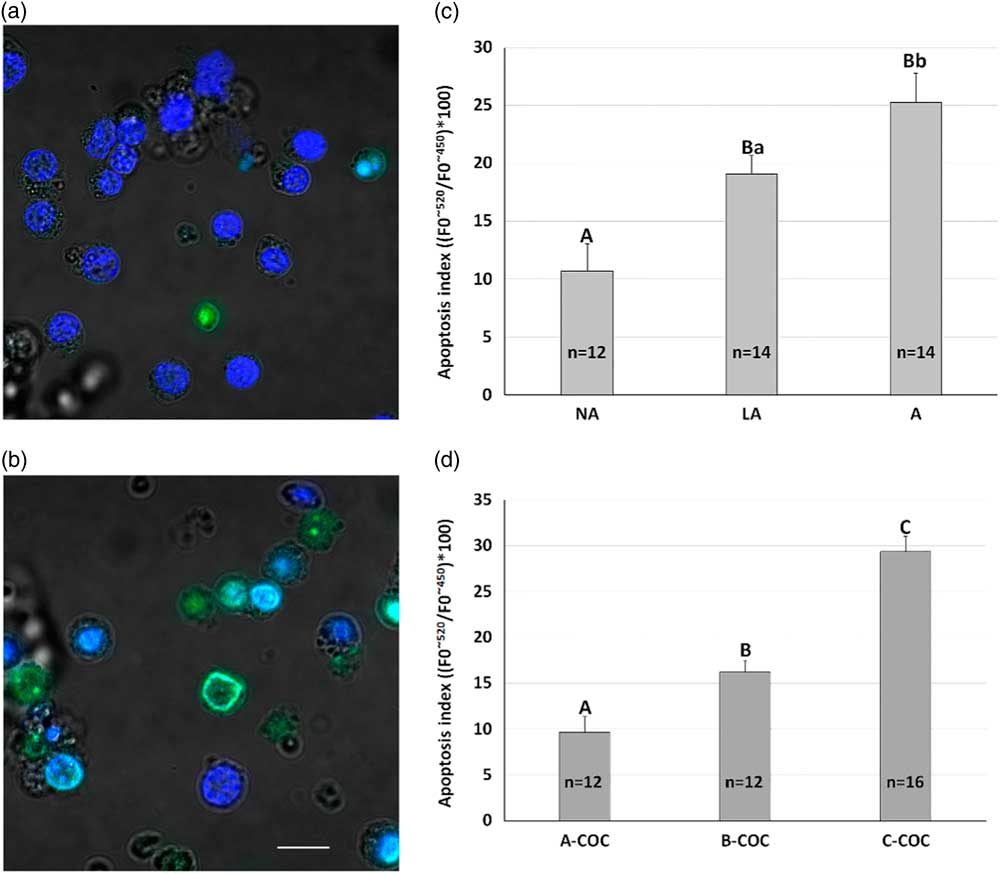
The ability to discriminate between different levels of follicular atresia by estimating the morphological characteristics of the follicular wall or the COC quality was validated by TUNEL assay and the results are shown in Fig. 1. Microphotographs using laser confocal microscopy and showing GCs treated by TUNEL are presented in Fig. 1A together with a positive DNase-treated control sample (Fig. 1B). For this analysis, 40 follicles homogeneously distributed for follicle size and atresia grade were evaluated across four ovary collection sessions. The mean (±SE) values of relative fluorescence dUTP fluorescein/DAPI ratios related to follicle morphology are reported in Fig. 1C, whereas those related to COC morphology are reported in Fig. 1D. In both cases, there is a high discriminating capability between the degree of atresia with both criteria used. Follicle size did not show any significant effect at TUNEL analysis (data not shown). Negative controls showed relative fluorescence mean (±SE) values of 8.2 ± 0.5, while the positive controls values were 146.1 ± 5.9.
Apoptosis in bovine granulosa cells (GCs) discriminated for atresia based on follicle or COC morphology. (a) Representative images of bovine GC analyzed by laser confocal microscopy for apoptosis occurrence as well as (b) positive control treated with 3 IU DNase. For both panels, the scale bar represents 5 μm. Mean (±SE) values of apoptosis index evaluated by TUNEL analysis and measured as fluorescence emission peak (dUTP fluorescein/DAPI) ratio found in GCs collected from follicles with different grades of atresia according to an estimation of follicle (c) or COC (d) morphology. The fluorescence emission peaks (F0) were measured at ∼520 nm (dUTP fluorescein, λex. 488 nm) and ∼450 nm (DAPI, λex. 350 nm) and expressed as a ratio. Capital letters (A, B) indicate P <0.01, small letters (a, b) indicate P <0.05.
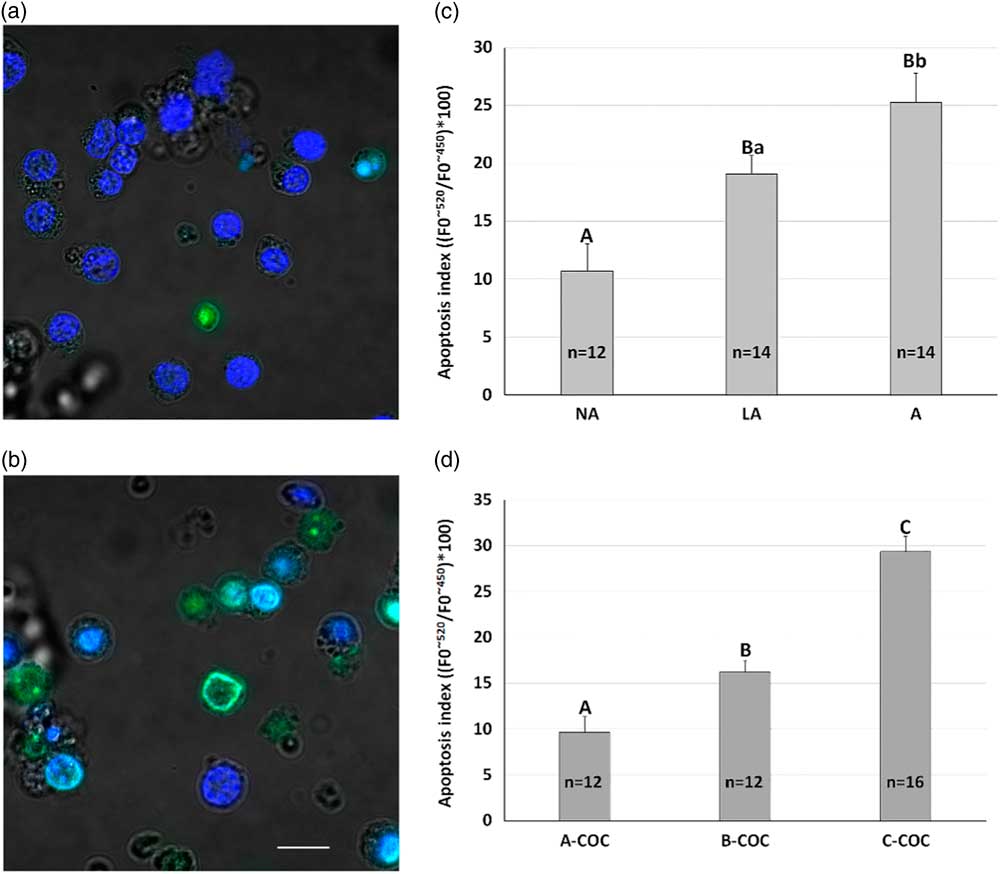
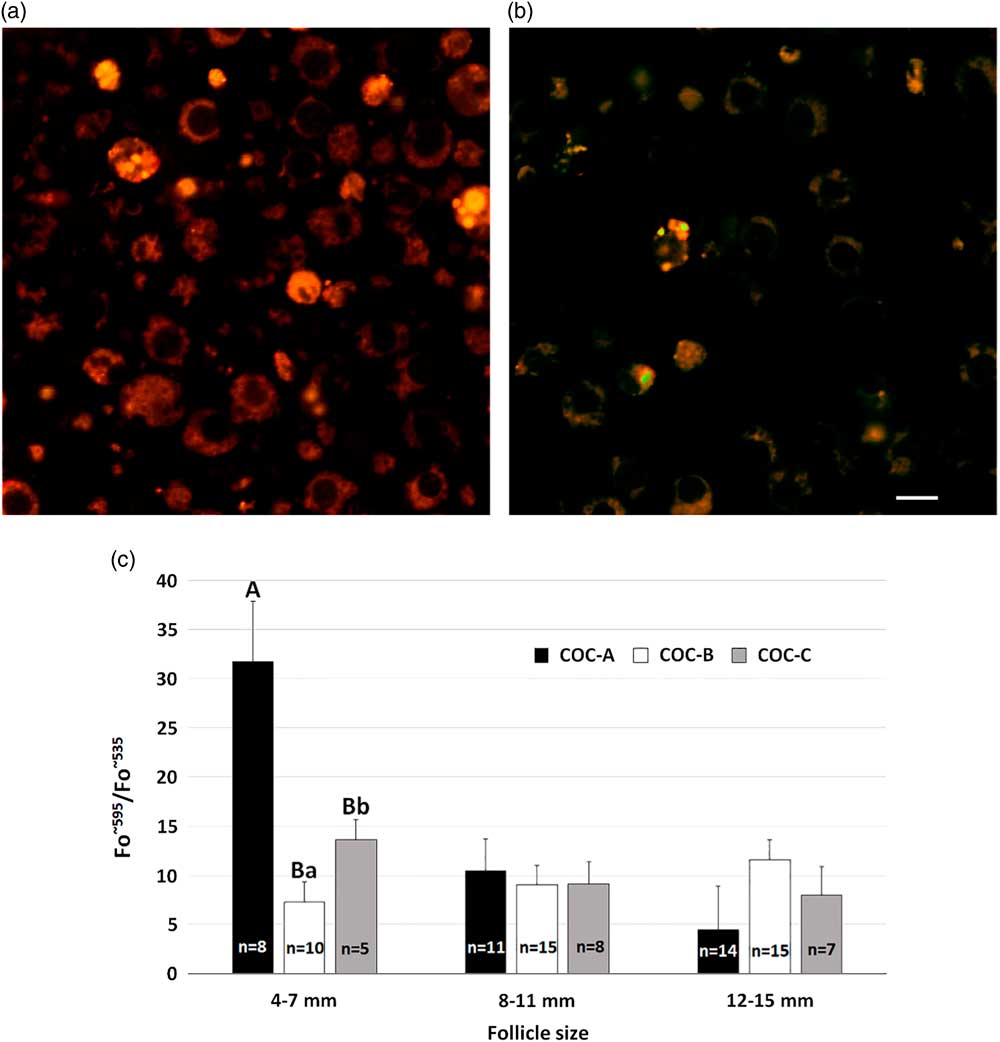
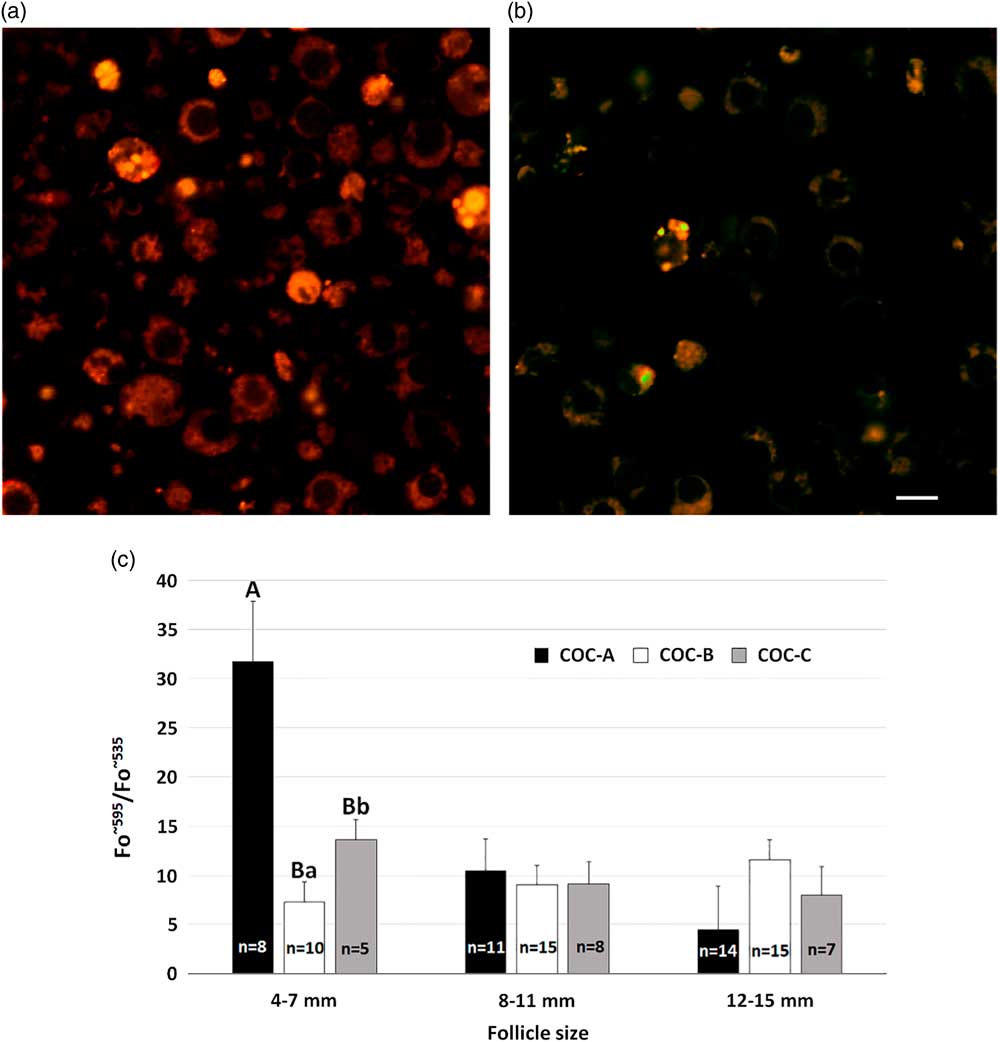
Figure 2 shows the MMP variations in relation to the size and the atresia grade of the ovarian follicles. The elective localization of JC1 in the cytoplasm (mitochondria) of GCs is shown in Fig. 2A, whereas Fig. 2B shows the CCCP-mediated mitochondrial depolarization. In non-atretic follicles, MMP progressively decreased along with follicle size increase (P <0.01). The small non-atretic follicles showed a higher MMP than medium or large non-atretic follicles (33.2 ± 5.5 versus 10.1 ± 2.9 and 4.5 ± 4.5 in small versus medium and large follicles, respectively; P <0.01). In small follicles, a significant (P <0.05) difference was also found between light atretic and atretic follicles. In this case, the latter showed a higher MMP than the former. In the medium and large follicle classes, MMP did not show significant difference in relation to the atresia grade.
Mitochondrial membrane potential in bovine granulosa cells (GCs) from follicles with different sizes and atresia grades. (a) Representative images of bovine GCs analyzed by laser confocal microscopy for mitochondrial membrane potential as well as (b) negative control treated with 5 μM CCCP. For both panels, scale bar represents 5 μm. (c) Mean (±SE) values of mitochondrial membrane potential (MMP) in bovine GCs collected from follicles with size ranging from 4 to 7, from 8 to 11 and from 12 to 15 mm in diameter and with different atresia grades. Granulosa cells were loaded with 5 μM JC-1 for 30 min and read with a spectrofluorometer. The fluorescence emission peak (F0) was measured at ∼595 and ∼535 nm and expressed as a ratio. Capital letters (A, B) indicate P <0.01, small letters (a, b) indicate P <0.05.
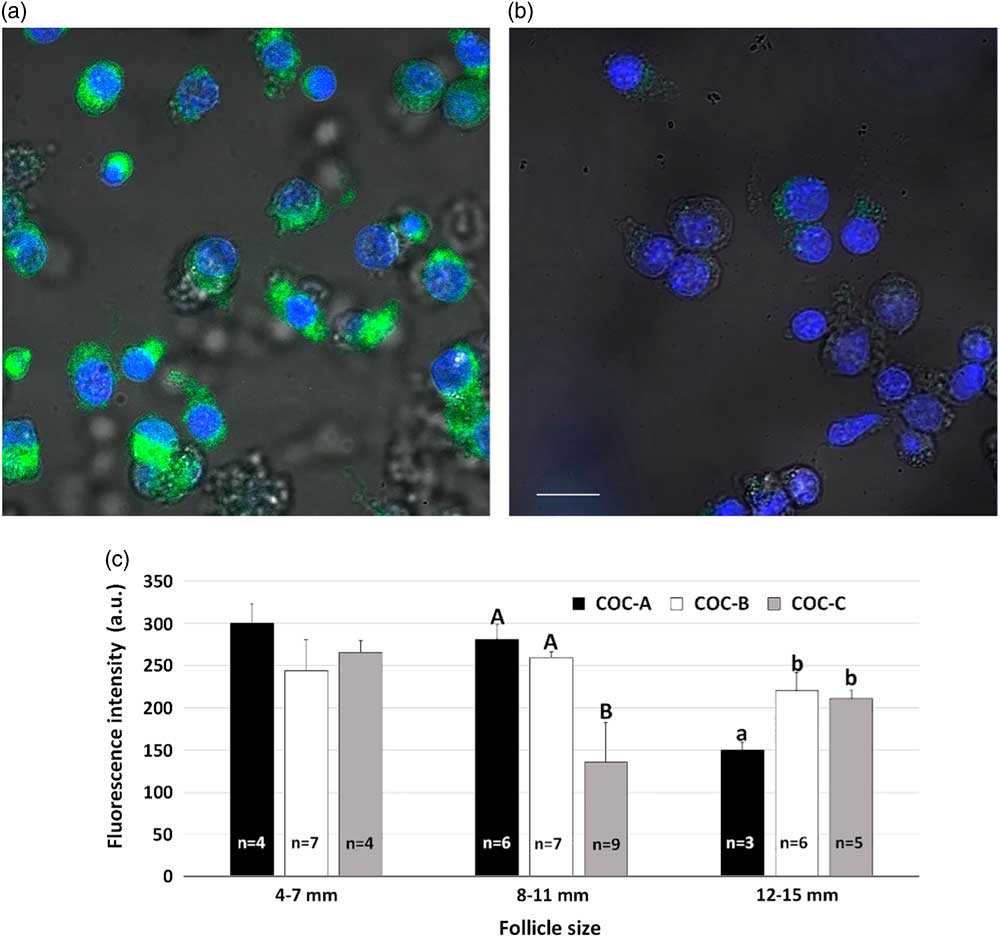
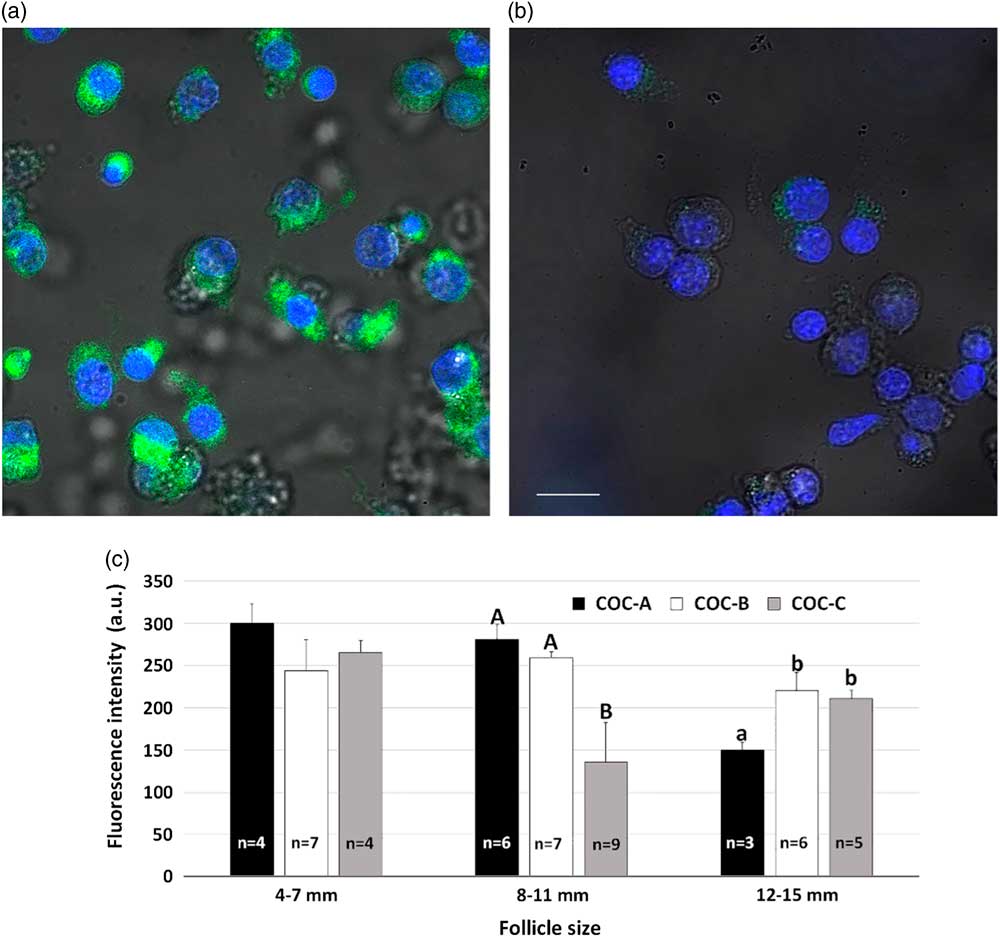
Immunolocalization of StAR in GCs using fluorescence microscopy is shown in Fig. 3A together with a negative control sample (Fig. 3B). In the fluorescence intensity analysis, only isolated GCs have been evaluated to avoid spectral overlap artefacts. The dynamics of StAR protein expression, evaluated by IF and related to the follicle size, is described in Fig. 3C. In medium follicles, GCs from atretic follicles showed a lower (P <0.01) StAR protein expression than in either non-atretic or light atretic follicles. In large non-atretic follicles, StAR protein expression was lower (P <0.05) than in light atretic and atretic follicles. In small follicles, there were not significant differences on StAR protein expression in relation to the atresia grade.
Steroidogenic acute regulatory (StAR) protein expression levels in bovine granulosa cells (GCs) evaluated by immunofluorescence. (a) Representative images of bovine GC analyzed by laser confocal microscopy for StAR protein expression as well as the negative control (b) performed by omitting the K20 primary antibody were reported. Nuclei were stained with 300 nM DAPI. For both panels, scale bar represents 5 μm; (c) Mean (±SE) values of steroidogenic acute regulatory (StAR) protein expression in bovine GCs collected from follicles ranging from 4 to 7, from 8 to 11 and from 12 to 15 mm in diameter, with different atresia grades, evaluated on the enclosed cumulus–oocyte complex morphological characteristics. The fluorescence emission peak (F0) was evaluated at 532 nm and expressed in arbitrary units (a.u.). Capital letters (A, B) indicate P <0.01, small letters (a, b) indicate P <0.05.
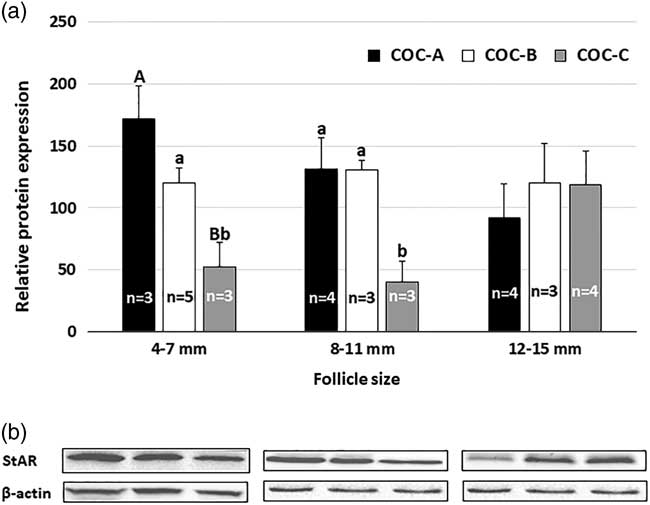
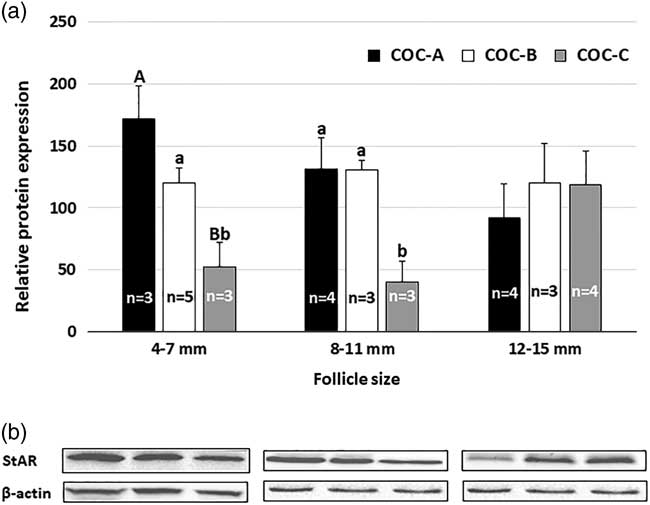
For WB analysis, GCs collected from small atretic follicles showed a lower StAR protein expression than in either light atretic (P <0.05) or non-atretic (P <0.01) follicles (Fig. 4). Similarly, in medium follicles, StAR protein expression was lower (P <0.05) in atretic follicles than in light atretic and non-atretic follicles. In large follicles, StAR protein expression did not differ in relation to the atresia grade.
Steroidogenic acute regulatory (StAR) protein expression in bovine granulosa cells (GCs) evaluated by western blotting analysis. (a) Relative protein expression of StAR in bovine GCs collected from follicles ranging from 4 to 7, from 8 to 11 and from 12 to 15 mm in diameter, with different atresia grades, evaluated on the enclosed cumulus–oocyte complex morphological characteristics, and analyzed by western blotting. (b) Following densitometric analysis of three independent experiments, data were obtained as StAR protein expression compared with the β-actin levels. Capital letters (A, B) indicate P <0.01, small letters (a, b) indicate P <0.05.
Discussion
In bovine GCs, we evaluated some indicators of mitochondria-related steroidogenic capacity such as MMP and StAR protein expression and related these to follicle growth and atresia grade.
The steroid-producing cells of the ovary (granulosa, theca, corpus luteum) contain the full enzymatic complement for steroid hormone synthesis. In thecal cells, LH controls Δ5 pathway activity and androstenedione production, whereas, in the GCs, FSH controls aromatase (CYP19) activity and, hence, oestradiol production. These relationships are the basis for the two-cell, two-gonadotropin system (Falck, Reference Falck1960; Armstrong et al., Reference Armstrong, Goff and Dorrington1979; Hillier et al., Reference Hillier, Whitelaw and Smyth1994). According to this theory, theca cells and GCs complement one another in the synthesis of oestrogens in the growing follicle. In particular, androgens leave theca cells before aromatization, which occurs in the endoplasmic reticulum of GCs (Rodgers et al., Reference Rodgers, Rodgers, Hall, Waterman and Simpson1986). This hypothesis is supported by evidence that FSH stimulates specifically the aromatization of androgens to oestrogens by GCs in tissue culture (Dorrington et al., Reference Dorrington, Moon and Armstrong1975). Moreover, FSH receptors are present on GCs but absent in theca cells (Camp et al., Reference Camp, Rahal and Mayo1991).
The aromatase activity in GCs increases together with follicle growth and, in turn, brings about physiological and behavioural changes that culminate with oestrous signs. GCs hardly express the cytochrome P450 17α-hydroxylase (CYP17) activity that is crucial for androgen synthesis and is regulated by LH (Hillier et al., Reference Hillier, Whitelaw and Smyth1994). This, in turn, leads to the need for two cell types (theca and granulosa) to produce oestrogens. However, the variations of either mitochondrial activity, evaluated as MMP, or one indicator of cholesterol transport into mitochondria, as StAR protein expression, suggest that a decrease in the Δ4 and/or the Δ5 pathways occurs along with the increase in CYP19 activity.
Mitochondrial activity represents an essential requirement for the steroidogenic activity related to the conversion of cholesterol to pregnenolone (Allen et al., Reference Allen, Shankara, Janus, Buck, Diemer, Held Hales and Hales2006). To date, information on mitochondrial activity in GCs is scarce. In this study, we evaluated mitochondrial activity, as MMP, and demonstrated that, in non-atretic follicles, it undergoes a progressive decrease with increase in the follicle size. These results are consistent with those reported by Gottlieb et al. (Reference Gottlieb, Armour, Harris and Thompson2003) who showed in IL-3 cells a MMP decrease following a reduction in growth factors and glucose concentrations. This appears to be a consequence of the decrease in oxidizable substrates (NADH and FADH2) that are no longer available for the formation of the proton gradient responsible for MMP status. In addition, the decrease in MMP appears to be correlated with the increase in the production of pro-apoptotic factors (such as cytochrome c). The relationship between MMP and cell health in GCs is further supported by Zhu et al. (Reference Zhu, Yuan, Guo, Lu, Deng, Yang, Wei, Wen and He2012) who reported a significant decrease in MMP in porcine GCs after exposure to increasing concentrations of the mycotoxin zearalenone. More recently, in bovine GC, other authors have demonstrated the deleterious effects of another mycotoxin, i.e. deoxynivalenol, that increased apoptosis, inhibited estradiol and progesterone secretion, and reduced the levels of mRNA that encoded oestrogenic (CYP19A1), but not progestogenic (CYP11A1 and StAR), proteins (Guerrero-Netro et al., Reference Guerrero-Netro, Chorfi and Price2015).
StAR is an indispensable component for cholesterol transportation from the outer to the inner mitochondrial membrane, and is one of the rate-limiting steps for steroid synthesis. In this study, we found a clear interaction between follicle size and atresia occurrence for StAR protein expression. In particular, while StAR protein expression decreased in non-atretic follicles along with follicle size increase, an opposite pattern occurred in atretic follicles. In large follicles, the higher StAR protein expression under atretic conditions could be possibly associated with progesterone production. In fact, large degenerated follicles showed a higher progesterone production than large healthy follicles (Kruip and Dieleman, Reference Kruip and Dieleman1985). Moreover, these results partially agreed with those previously obtained using in situ hybridization (Bao et al., Reference Bao, Calder, Xie, Smith, Salfen, Youngquist and Garverick1998). This study was carried out on either dissected follicles ≥8 mm in diameter or blocks of ovarian tissue-containing follicles of different sizes but also considered those ≥2 mm in diameter. These samples showed a preferential localization of StAR mRNA within the follicular theca cells. The StAR protein expression of these cells increased with the increase in follicular size and decreased with the increase in the levels of atresia. The GCs showed, however, a poor positivity with the presence of StAR mRNA and a decreasing trend at the increase of follicle size. Unfortunately, higher degrees of atresia were found in smaller follicles and this study was not able to discriminate the effect of follicle size from atresia grade. Recent studies (Zhang et al., Reference Zhang, Wu, Zhao, Liu, Zeng and Zhang2015) have demonstrated the expression of StAR, measured by either real-time PCR or WB analyses, in primary cultures of bovine GC. The transcription of this protein was correlated to the availability of cholesterol provided to the cell culture in the form of low density lipoprotein (LDL). In addition, in heifers treated with anabolic androgens and estrogens implants for 84 d, real-time PCR analysis in response to follicle-stimulating hormone treatment demonstrated a decrease in StAR mRNA expression and an increase in P450 side-chain cleavage (CYP11A1) mRNA in GCs compared with non-implanted females (Stapp et al., Reference Stapp, Gifford, Hallford and Gifford2014). However, no difference in expression of 3β-hydroxysteroid dehydrogenase and aromatase activities was demonstrated in implanted or non-implanted heifers.
Two simple methods for the assessment of the follicular atresia were simultaneously evaluated in the present study and validated by TUNEL assay. Both methods showed a high reliability. Consequently, they can be proposed for future studies on follicular quality. The use of the COC morphology for the evaluation of follicle atresia might greatly reduce the time needed to discriminate GC samples from follicles with different atresia grades by direct aspiration of individual follicles whose diameter might be estimated on the volume of the follicular fluid collected. In this study, the follicle size was not related to the atresia occurrence. This finding agrees with previous studies (Yang and Rajamahendran, Reference Yang and Rajamahendran2000) demonstrating that apoptosis occurs in GCs from all sizes of follicles and can be also detected in some healthy follicles. The relationship between follicular atresia and COC quality is still unclear. Zeuner et al. (Reference Zeuner, Müller, Reguszynski and Jewgenow2003) found that follicle wall apoptosis was not correlated to COC morphology or to the percentage of apoptotic free-floating GCs or cumulus cells. However, they found a higher expression of apoptosis in GC-containing grade 3 COCs (worst morphology) than in those containing grade 1 (best quality) and 2 (intermediate quality) COCs. The oocyte diameter is negatively related with apoptotic ratio in the bovine GV stage oocyte (Anguita et al., Reference Anguita, Vandaele, Mateusen, Maes and Van Soom2007). At this stage, a higher proportion of apoptotic cumulus cells also surrounds oocytes with a small diameter. However, after maturation, these differences are no longer present and the oocyte developmental competence seems to be not related to the incidence of apoptosis among oocyte diameters (Anguita et al., Reference Anguita, Vandaele, Mateusen, Maes and Van Soom2007). More recently, Janowski et al. (Reference Janowski, Salilew-Wondim, Torner, Tesfaye, Ghanem, Tomek, El-Sayed, Schell ander and Hölker2012) grouping bovine oocytes and respective follicular cells, as brilliant cresyl blue (BCB)+ and BCB−, found that the follicular cells enclosing developmentally competent oocytes had a higher level of apoptosis compared with follicular cells enclosing non-competent oocytes. These findings may be explained by either the different criteria used to evaluate COC morphology or a discrepancy observed between COC morphology and the oocyte developmental competence (Blondin and Sirard, Reference Blondin and Sirard1995; Boni et al., Reference Boni, Cuomo and Tosti2002). In the latter case, many studies indicated that a low level of atresia tends to improve the in vitro competence of oocytes (De Wit et al., Reference De Wit, Wurth and Kruip2000; Feng et al., Reference Feng, Sui, Han, Chang, Zhou, Liu, Bao and Tan2007). To deepen this information, very recently Landri and colleagues (Landry et al., Reference Landry, Rossi-Perazza, Lafontaine and Sirard2018) identified a set of granulosa cell biomarkers capable of discriminating optimal follicle differentiation from late differentiation and atresia in order to assess differences in ovarian stimulation between pre- and post-pubertal donors. By monitoring these biomarkers, the authors proposed a new possibility to characterise the follicular status of atresia in bovine GCs. Finally, the use of spectrofluorimeter, used in the present study, is an interesting alternative to microscopy (Boni et al., Reference Boni, Cocchia, Silvestre, Tortora, Lorizio and Tosti2008) or flow cytometry (Maillet et al., Reference Maillet, Breard, Benhaim, Leymarie and Feral2002) for TUNEL analysis as it significantly reduces the time required for the analyses and provides a mean evaluation based on millions of cells and a high repeatability as evidenced by a low variability (data not shown) obtained in replicate readings.
Conclusion
In conclusion, the analyses of bovine GCs performed immediately after their recovery from the ovarian follicle allowed the evaluation of physiological parameters with a novel methodological approach never reported before demonstrating: (i) follicle size and atresia grade significantly affected the considered steroidogenic indicators; (ii) follicle and COC morphological evaluations had a high discriminatory ability in atresia estimation. All together this information will provide in cattle new insight in the evaluation of follicular activity.
Acknowledgements
We thank Dr Elisabetta Tosti for kindly revising the manuscript and Dr Giuseppe Cascini and the Org. Gestione Aziendale S.r.l. (Tito – Potenza) for providing the ovaries.
Financial support
Grant sponsor: University of Basilicata (R.I.L.)
Conflict of interest
The authors declare that there is no conflict of interest that could be perceived as prejudicing the impartiality of the research reported.
Ethics approval
All procedures involved cells collected from animals regularly slaughtered.