Introduction
The search for a true Earth-analogue planet is one of the boldest scientific and intellectual endeavours ever undertaken by humankind. If such a planet can be found orbiting a nearby Sun-like star, it will constitute an ideal target for extensive follow-up studies from the ground and with future space missions. These follow-up studies can include a detailed characterization of the planetary system and, ultimately, a search for bio-signatures in the atmosphere of an Earth-like planet in the habitable zone. For the far future, many decades to centuries from now, one can even imagine that the first interstellar probe will be launched to travel to one of the systems, where we found evidence for a nearby Earth twin. The discovery of such a planet will have an unprecedented cultural as well as scientific impact.
NASA's Kepler mission (Borucki et al. Reference Borucki2010) has been extremely successful in finding small, possibly rocky planets orbiting stars in the Kepler search field. Some of them even reside within the circumstellar habitable zones: e.g., Kepler-22b (Borucki et al. Reference Borucki2012) and two planets in the Kepler-62 system (Borucki et al. Reference Borucki2013). One of the most significant results from Kepler is the planet occurrence rates, which show that small radius planets are quite frequent and outnumber the giant planets to a large extent (e.g., Howard et al. Reference Howard2012; Dressing & Charbonneau Reference Dressing and Charbonneau2013; Fressin et al. Reference Fressin2013; Petigura et al. Reference Petigura, Marcy and Howard2013). We are tempted to extrapolate from these high Kepler planet frequencies to the immediate solar neighbourhood and conclude that many nearby stars, possibly even the nearest star to the Sun, are orbited by one or more Earth-like planets.
The precision of stellar radial velocity (RV) measurements has steadily improved from a modest 15 m s−1 (Campbell & Walker Reference Campbell and Walker1979), more than three decades ago, to a routine 3 m s−1 (Butler et al. Reference Butler1996), and in the best case, with the highly stabilized HARPS spectrograph (Mayor et al. Reference Mayor2003), even 1 m s−1 or better. The discovery space of the RV method was, therefore, extended from the giant planet domain down to Neptunes and super-Earths (with minimum masses between 2 and 10 M⊕). In terms of RV precision, we are still more than an order of magnitude from the 0.09 m s−1 RV amplitude of an Earth at 1 AU orbiting a G-type star. Future projects aim for RV precision of 0.1 m s−1, but they are still years away from being operational. ESPRESSO (Pepe et al. Reference Pepe2014) is currently under construction for the ESO Very Large Telescope and G-CLEF (Szentgyorgyi et al. Reference Szentgyorgyi, Frebel, Furesz, Hertz, Norton, Bean, Bergner, Crane, Evans and Evans2012) has been selected as a first-light instrument for the Giant Magellan Telescope (GMT).
However, there is an alternative to extreme precision: with a large enough number of measurements, even signals with amplitudes orders of magnitude below the individual measurement uncertainties can be detected with high significance. Instead of waiting for the new instruments to be deployed, several groups have started ambitious RV programmes that observe a small sample of suitable stars in the solar neighbourhood with high temporal cadence. Owing to the extreme observational effort, these searches have to be dedicated to a few systems rather than to include as many targets as possible. The need of RV searches to focus on nearby bright stars has an attractive side-effect: the targets are all very close to the Sun, unlike the Kepler targets or microlensing systems, which are at typical distances of several hundreds or thousands of parsecs. The HARPS team has focused on ten Solar-type stars and reported very low-mass planets around HD 20794, HD 85512 and HD 192310 (Pepe et al. Reference Pepe2011). In order to properly perform such an RV search for low-mass planets, it is important to pay careful attention to RV signals that are intrinsic to the star and that can have larger amplitude than a planetary signal.
Special attention has been given to our closest neighbour in space, α Centauri, and several groups (see Table 1) have chosen this star system as the prime target of their planet detection efforts. Recently, Dumusque et al. (Reference Dumusque2012) presented the case for the presence of a low-mass planet in a 3.2-day orbit around α Cen B using 459 highly precise RV measurements with HARPS obtained over a time span of 4 years. Tuomi et al. (Reference Tuomi, Jones, Jenkins, Tinney, Butler, Vogt, Barnes, Wittenmyer, O'Toole and Horner2013) discussed the possible existence of a five-planet system around τ Ceti, another very close Sun-like star for which no planets have yet been reported. These important results need to be confirmed by independent data and analysis. Indeed, Hatzes (Reference Hatzes2013) re-analysed the HARPS RV results for α Cen B using a different approach to filter out the stellar activity signals than that of Dumusque et al. and cast serious doubt on the reality, or at least on the planetary nature of the 3.2-day signal. In this paper, we describe our α Cen programme with the High Efficiency and Resolution Canterbury University Large Échelle Spectrograph (Hercules) at the McLellan 1 m telescope at Mt John University Observatory (MJUO) in New Zealand.
Precise radial velocity surveys that target the α Cen system

The α Centauri system
The α Cen system is our closest neighbour in space (d=1.347 pc) and thus constitutes a target of fundamental importance for any exoplanet search programme. It is so close that a future spacecraft travelling at 0.1 c reaches the system within 50 years. The α Centauri binary consists of a G2V primary (HR 5459, HD 128620, V=−0.01) and a K1V secondary (HR 5460, HD 128621, V=1.33) moving in an eccentric (e=0.518) orbit with a semi-major axis of a=23 AU and a period of almost 80 years (Heintz Reference Heintz1982; Pourbaix et al. Reference Pourbaix, Neuforge-Verheecke and Noels1999). The possible third member of the system, Proxima Cen (M5V, V=11.05), is located at a much larger separation of ≈12 000 AU. It is not clear yet whether Proxima is indeed gravitationally bound to the inner binary (Wertheimer & Laughlin Reference Wertheimer and Laughlin2006). Stringent upper mass limits for planets in the habitable zone of Proxima Cen have been presented by Endl & Kürster (Reference Endl and Kürster2008) and Zechmeister et al. (Reference Zechmeister, Kürster and Endl2009).
The star α Cen A is also very similar to our Sun. A mass ratio of the binary (m B/mA=0.75±0.09) was first presented by Murdoch et al. (Reference Murdoch, Hearnshaw and Clark1993). A recent study of the atmospheric parameters and abundances of the two stars was presented by Porto de Mello et al. (Reference Porto de Mello, Lyra and Keller2008). Both stars are almost twice as metal-rich as the Sun (England Reference England1980; Furenlid & Meylan Reference Furenlid and Meylan1990 and Porto de Mello et al. Reference Porto de Mello, Lyra and Keller2008). The age of the system has been estimated to be between 5.6 and 6.5 Gyr (e.g., Eggenberger et al. Reference Eggenberger2004). The masses of the two stars have been determined with high accuracy by Pourbaix et al. (Reference Pourbaix, Nidever, McCarthy, Butler, Tinney, Marcy, Jones, Penny, Carter and Bouchy2002): M A=1.105±0.007 M ⊙ and M B=0.934±0.006 M ⊙.
The α Cen system was included in the original 1992 target sample of the RV planet search at the ESO Coudé Echelle Spectrometer (Ces) (Kürster et al. Reference Kürster1994). In Endl et al. (Reference Endl2001) we presented our Ces RV data and a full analysis of the system including mass upper limits for planets. Based on the first five and a half years of Ces RV measurements, we were able to set stringent constraints on the presence of any gas giant planets in the systems. We basically excluded the presence of any giant planet with a minimum mass greater than 3.5 M Jup. Moreover, we combined the RV-derived mass limits with the limits on stable orbits around each star imposed by the presence of the other star from Wiegert & Holman (Reference Wiegert and Holman1997). They found that stable regions for planets orbiting in the binary plane (corresponding to a viewing angle i=79.23°) extend to roughly 3 AU around each star, for prograde orbits, and to 4 AU, for retrograde orbits. If the planets orbit in the binary plane, the RV measured m sini values are close to the actual mass.
The formation of terrestrial planets in the α Cen system was studied by Quintana et al. (Reference Quintana, Lissauer, Chambers and Duncan2002, Reference Quintana, Adams, Lissauer and Chambers2007), Barbieri et al. (Reference Barbieri, Marzari and Scholl2002), Quintana & Lissauer (Reference Quintana and Lissauer2006) and Guedes et al. (Reference Guedes2008). These studies suggest that the formation of several Earth-mass planets at separations <2 AU was possible, despite the perturbing influence of the stellar companion.
Guedes et al. simulated the RV detectability of these planets using synthetic RV data sets. They demonstrated that a 1.7 M ⊕ planet with a period of 1.2 years can be clearly detected after 3 years of observations, if the noise distribution is sufficiently close to Gaussian (see Fig. 5 in their paper). They used a noise level of 3 m s−1 and nearly 105 synthetic RV points.
Thebault et al. (Reference Thebault, Marzari and Scholl2008, Reference Thebault, Marzari and Scholl2009), however, argue that these Earth-like planets might not have formed around α Cen B as the mutual velocities of planetesimals were too high to allow accretion and continued growth to proto-planets beyond the planetesimal phase. These authors also state that the situation would have been more benign for the formation of terrestrial planets if the binary was initially wider (by about 15 AU) or had a lower eccentricity than currently. On the other hand, Xie et al. (Reference Xie, Zhou and Ge2010) conclude that the formation of terrestrial planets around α Cen B was possible, even in the current binary configuration.
The MJUO α Centauri programme
The University of Canterbury in Christchurch, New Zealand, owns and operates the MJUO at the northern end of the Mackenzie Basin in the South Island. We selected MJUO as the site for this project, as α Cen, at lower culmination, is still 15° above the horizon. While other observatories are limited to observe α Cen for 9–10 months, we are able to obtain RV data for 12 months a year. We are in a unique position that allows us optimal sampling of periods close to 1 year.
Observing strategy
Terrestrial planets orbiting inside the classical habitable zone around F, G and K-type stars only induce reflex velocities of ≈0.1 m s−1 on their host stars. This is still well below the current state-of-the-art level of measurement precision.
But the sensitivity to low-amplitude signals is not only a function of measurement precision, but also of data quantity. With a large enough number of measurements, even signals with amplitudes below the individual measurement uncertainties can be detected with high significance. Cochran & Hatzes (Reference Cochran and Hatzes1996) presented analytical expressions for the detection sensitivity of an RV survey of a given precision. Their analytical relationship between noise and the total number of independent measurements (N) demonstrates that at least N=100 is necessary to detect a signal with an amplitude equal to the noise. If the errors are sufficiently close to white noise, this trend continues towards lower amplitudes and with the appropriate high value of N even signals with amplitudes much lower than the noise can be detected. From this we see that, to find Earth-mass planets with minimum masses of 0.5–2 M ⊕ with habitable zone periods, N has to be of the order of several 103–104, depending on the measurement uncertainties. This is the strategy that we adopted for the Mt John programme: to obtain a very large number of RV measurements at a modest 2–3 m s−1 precision level.
The Hercules spectrograph
The Hercules (Hearnshaw et al. Reference Hearnshaw2002) has been in operation at MJUO since 2001. It is fibre fed from the 1 m McLellan telescope, and is enclosed inside a vacuum tank (P<0.005 atm). The spectrograph uses an R2 échelle grating in combination with a 200 mm collimated beam size. Cross-dispersion uses a BK7 prism in double pass. A large format CCD with 4130×4096 pixels each 15 μm in size allows complete wavelength coverage from 370 to 850 nm. A 4.5 arcsecond fibre feeding a 2.25 arcsecond entrance slit gives a resolving power of R=70 000 with high throughput (≈12% including telescope, fibres and CCD quantum efficiency). The spectrograph is located in a temperature-stabilized room (T≈20±0.05 °C) and has no moving parts apart from focus, which remains unchanged. An exposure meter is used to ensure precise control of exposure lengths and signal-to-noise (S/N) ratios. Because it was known that when observing bright stars the RV precision of Hercules was limited by the effects of small guiding and centring errors, Hercules was also equipped with an iodine cell, which superimposes a dense reference spectrum on the stellar spectrum and also allows us to reconstruct the shape of the spectrograph's instrumental profile at the time of observation. All RV results shown here were obtained with the iodine cell.
Hercules RV results for α Cen
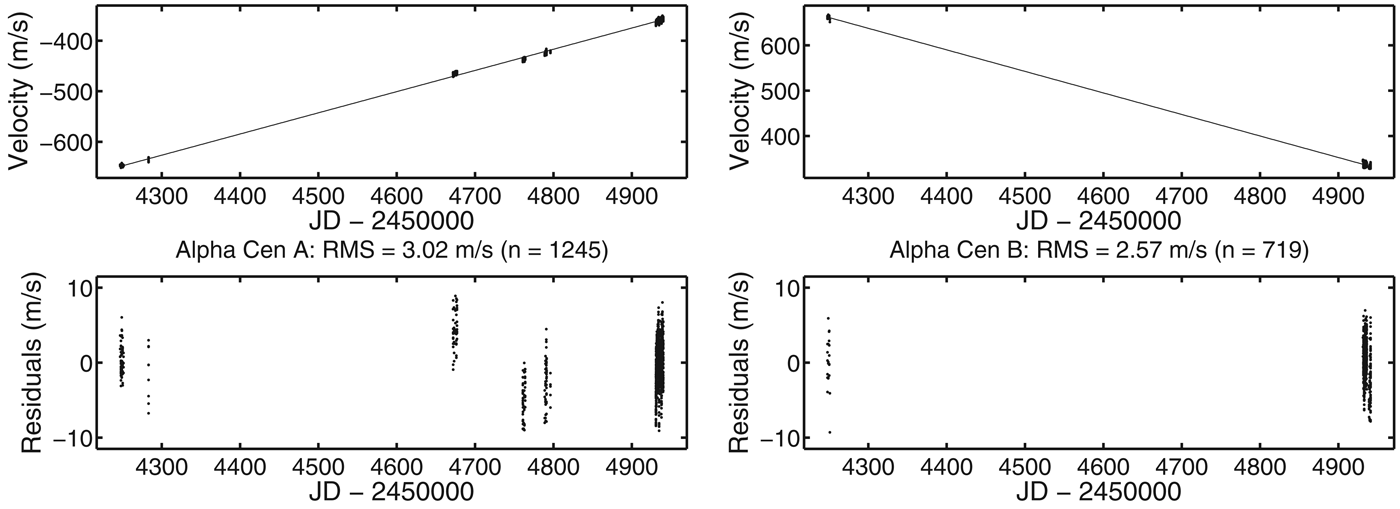
From 2007 to 2009 we collected RV data over seven observing runs and 28 nights, with typical exposure times for component A ranging from 30 to 45 s and for B from 90 to 120 s. The RV results have a long-term RV scatter of 2.5–3.0 m s−1 after subtracting the large trend due to the binary motion (see Fig. 1). About 4% of the data were rejected as outliers by a simple σ-clipping routine, removing all poor S/N-ratio spectra. In April 2009, we obtained more than 500 individual spectra for α Cen B over the course of five nights. The weighted means of the nights have a very small RMS scatter of 0.5 m s−1 (see Fig. 2). These first RV results demonstrate that we achieve a single shot RV precision of ~2.5 m s−1, sufficient to carry out this programme.
The 2007–2009 Hercules+I 2 RV data for α Cen A & B. The top panels show the data with the strong slope due to the binary orbit (solid line) and the lower panel displays the residuals. The residual scatter after removal of the slope is 2.5–3.0 m s−1. The data also show a larger level of RV variability for A than for B (which is expected from their spectral types and level of magnetic activity).

Five consecutive nights of Hercules RV measurements for α Cen B from our 2009 April run. The >500 individual measurements have a total scatter of 2.71 m s−1 and show very little night to night variations. The weighted mean values of these five nights have a standard deviation of only 0.5 m s−1.
However, since 2010 the angular separation of the two stars has shrunk from ≈7 to 5 arcseconds. With a mean seeing at Mt John of 2 arcsecond (with 95% of the time better than 3 arcsecond) we have an increasing level of cross-contamination in our α Cen spectra. The nominal 4.5 arcsecond fibre of Hercules is simply too large for isolated observations of the two components of α Cen, as discussed in Wittenmyer et al. (Reference Wittenmyer2012).
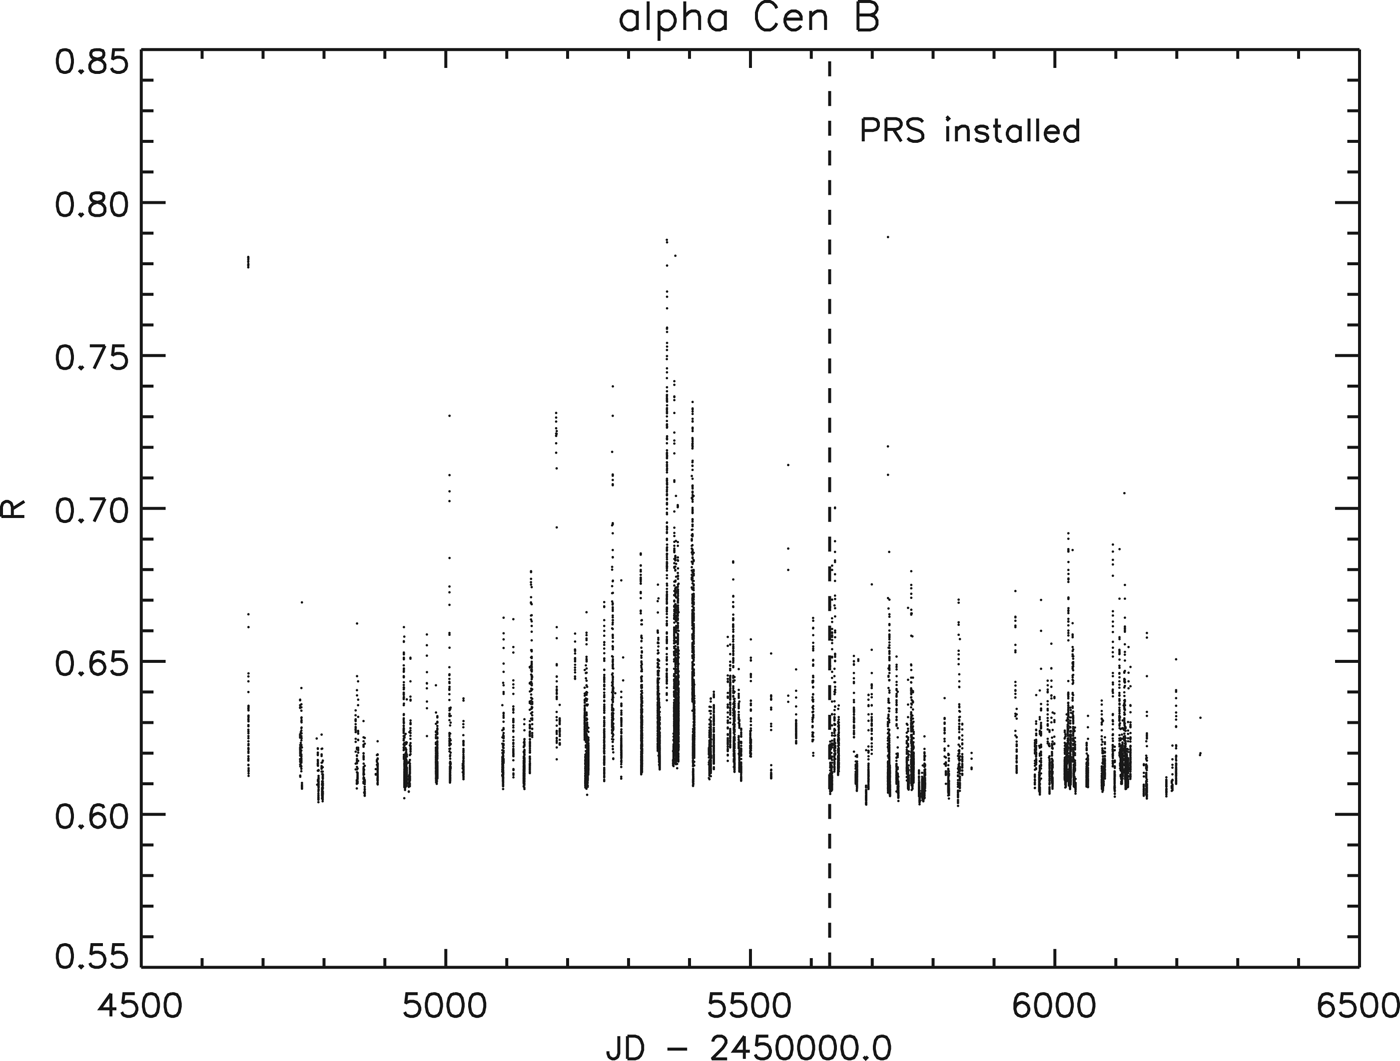
To minimize this effect we placed a pinhole at the focal plane of the telescope followed by a set of lenses to relay the light passing through the pinhole into the fibre. Apertures of 3 to 2 arcsecond can be used to reduce the size of the fibre on the sky. This pinhole relay system was installed in February 2011, and reduced, but did not remove the spectral cross-contamination. Figure 3 shows the level of contamination in our data for α Cen B (the effect for component B is, of course, stronger than for component A) as measured with a line index R. The quantity R is defined as the ratio of the two line indices calculated as the flux in the line core as compared to the surrounding continuum for the Hα and Na D lines, respectively. As the shapes of these two strong lines are different for the A and B we can estimate the amount of contamination from the other star. The pinhole relay system also contains the iodine cell on a moving stage to insert it into the collimated beam between the Cassegrain focus and the fibre entrance. It can be quickly removed for flat field spectra and thorium-argon spectra, but inserted for the stellar spectra.
Line index R measurements using our α Cen B spectra demonstrating the level of spectral contamination from component A. A higher value of R represents a higher level of contamination. The installation of the Pinhole-Relay-System (PRS) reduced the amount of contamination somewhat, but did not remove it. Note that without the PRS the amount of contamination would have steadily increased as the angular separation of the two stars is still shrinking.
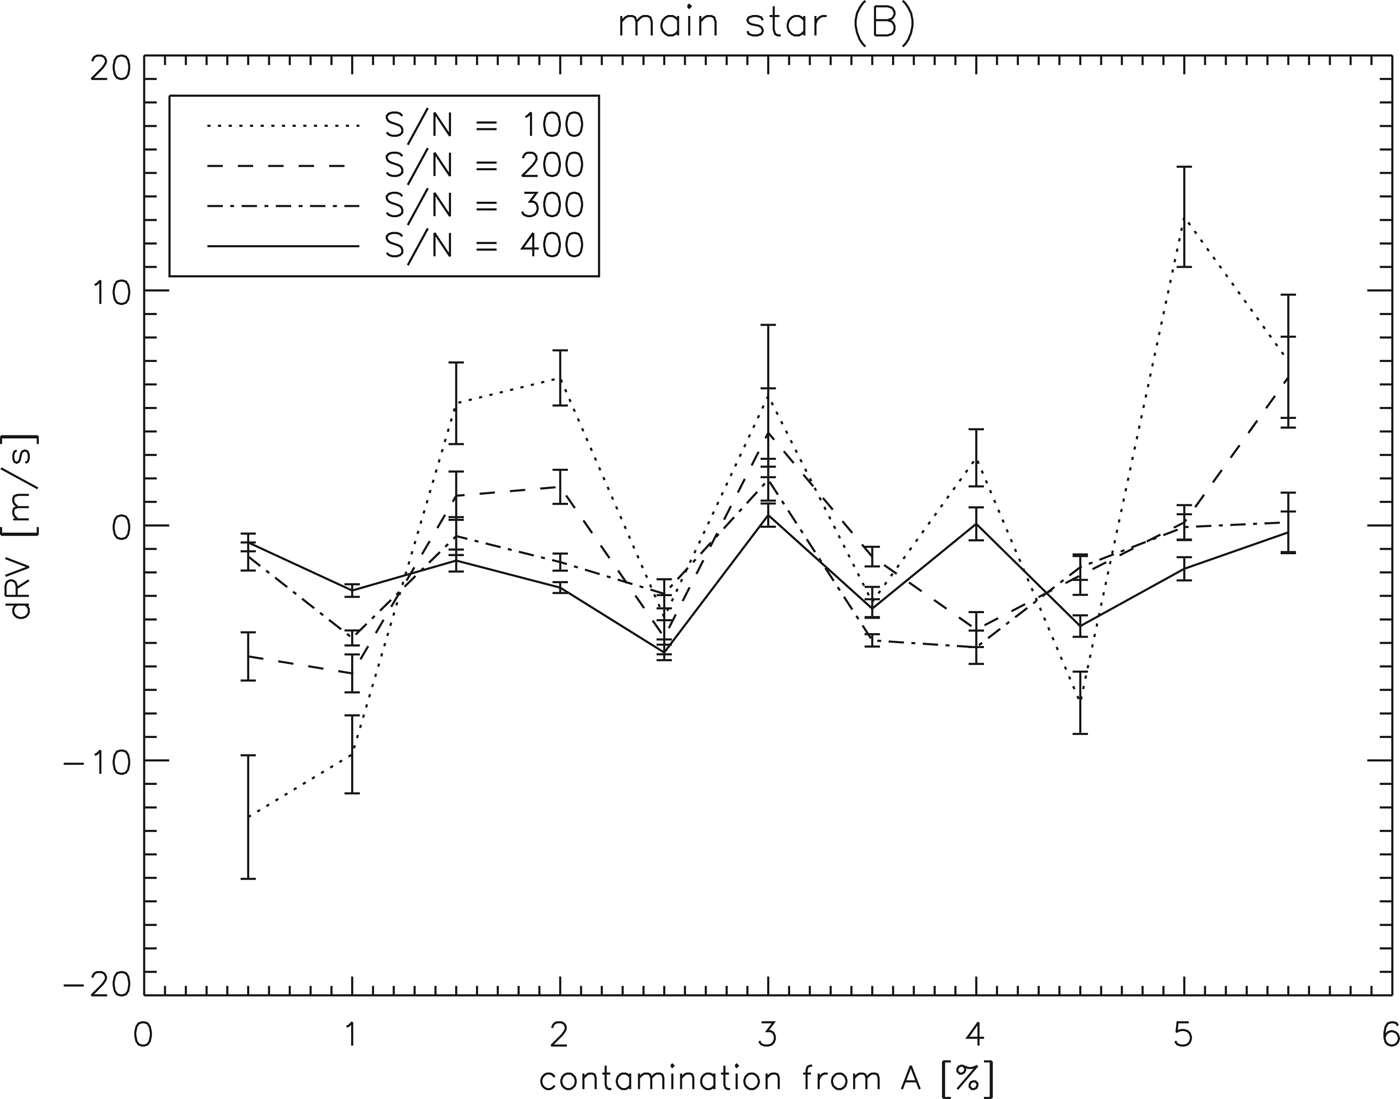
We pursue now an additional approach (Bergmann et al. Reference Bergmann2012): to include and account for the spectrum of the contaminating star in our iodine cell data modelling pipeline Austral (Endl et al. Reference Endl, Kürster and Els2000). First test results for synthetic spectra with different amounts of contamination and S/N levels are shown in Fig. 4. These initial test results show that with a sufficiently high S/N level (>300) we are able to compute the RV of the main target independent of the level of contamination from the second star. A detailed description of this new version of Austral is the topic of a paper that is currently in preparation (Bergmann et al. in preparation). We use this new data modelling algorithm now to reprocess all of our 2010–2013 data for the α Cen system.
RV results from tests performed with an advanced version of our Austral iodine cell code that includes a second low-level spectrum from a contaminating star. In this case, we simulated that the target is α Cen B with varying amount of contamination from α Cen A (x-axis gives amount of contamination in %). The initial RV of the uncontaminated spectra is at 0. We performed this test for four values of the S/N of the data. For each S/N value we created a set of ten spectra. The RV result is the mean value of these ten spectra with the size of the error bar determined by the RMS scatter around this mean. The RV separation for the two stars was set to 2.0 km s−1, which is the current RV separation of α Cen A and B. This shows that for S/N values in the 300–400 range, we can successfully recover the RV of the main target, nearly independent of the amount of spectral contamination.
Detectability of low-mass planets with the Hercules programme
We performed simulations to determine the expected detection efficiency of our programme, once the effect of spectral contamination is removed. We use the actual times of our current 19 316 observations of α Cen B taken over 5 years and created artificial RV data sets with various different levels of white noise. The noise in our data is currently dominated by the effect of cross-contamination, which is highly systematic in nature. This is a critical issue, as the strategy to detect low-amplitude signals with a large number of measurements is only successful if the dominant noise in the data is random (white noise). Our goal is therefore to correct for the contamination and get as close as possible to white noise for the final noise structure in our RV data. The detection simulations will therefore inform our expected sensitivity to low-mass planets once the systematic noise from the cross-contamination is removed.
Sensitivity to the purported 3.24-day planet signal
As a first test we simulated RV data that contains the purported 1.1 Earth-mass planet in a 3.24-day orbit as suggested by Dumusque et al. (Reference Dumusque2012). We created various white-noise RV data sets and injected the eight signals intrinsic to the star (taken from Table 2 from Hatzes (Reference Hatzes2013)) with the correct period, amplitude and phase. These eight signals are the rotation period of α Cen B of 39 days and its harmonics. We then added the planetary signal with a period of 3.24 days and an RV semi-amplitude of 0.40 m s−1 and phase as reported in Hatzes (Reference Hatzes2013).
We did not add the binary orbit to the simulated data as the effect of the second star is sufficiently linear over the time of our observations. With the dense sampling of our data this slope is very well defined and it makes no difference whether we create simulated RV data with a slope, and then fit it and subtract it, or not. If our sampling would be sparse, the fitting of the slope could affect longer periodic signals. But this is not the case, as we are interested in signals with at least a few cycles covered by the survey combined with the very dense sampling of the slope.
We then performed the same pre-whitening procedure as Dumusque et al. (Reference Dumusque2012) and Hatzes (Reference Hatzes2013): to identify the strongest peak in the Lomb-Scargle periodogram (Lomb Reference Lomb1976; Scargle Reference Scargle1982), then fit and subtract this signal and start over again. Figure 5 shows this step by step procedure for a simulation with a white noise level of 3.0 m s−1. The final periodogram (panel (k)) shows very clearly that the 3.24-day signal is highly significantly detected by our survey at this noise level. This is not surprising, as the Hercules survey covers about 600 cycles of this signal.
Simulation of the RV detection of the purported Earth-mass planet in a 3.24-day orbit around α Cen B (see text for details). Panels (a)–(k) show the periodogram of the data after each step of pre-whitening. In each panel, we state the period of the strongest signal that is subsequently fitted and subtracted from the data. Panel (k) displays the periodogram after removal of all signals intrinsic to the star, the RV signal of the Dumusque et al. planet candidate with a period of 3.24 days and an amplitude of ±0.40 m s−1 (as reported in Hatzes Reference Hatzes2013) is recovered with high confidence.
Figure 6 shows the results for four different simulations with white noise levels ranging from 2 to 5 m s−1. As expected, the significance of the signal of the low-mass planets drops with higher noise levels. Still, even with a relatively high noise level of 5 m s−1, we should be able to confirm this signal with the Hercules data, owing to the large number of measurements.
Sensitivity to the 3.24-day signal as a function of white noise in our simulated RV data. For each case we performed the same pre-whitening procedure as shown in Fig. 5. Each panel displays the final periodogram after subtraction of the stellar intrinsic signals.
Sensitivity to planets in the habitable zone
As the next test case we simulated RV data that contain the eight stellar signals, as in the previous case, but no 3.24-day signal and instead injected the RV signature of a super-Earth planet with a semi-amplitude of 0.35 m s−1 (minimum mass of 3.2 M ⊕) and a period of 234.3 days (at random phase). This period places the planet at the inner edge of the narrow habitable zone estimate given by Kaltenegger & Haghighipour (Reference Kaltenegger and Haghighipour2013). As in the previous simulation we filtered the dominating stellar signals with a pre-whitening procedure until we arrived at residuals that contain only noise and the planetary signal.
Figure 7 summarizes the results of four simulations using white noise from 1 to 4 m s−1. This shows that with a 2 m s−1 RV precision, we should be able to discover super-Earth planets in the habitable zone of α Cen B with the Hercules survey data.
Period search results in our simulated RV data that includes a sinusoidal signal with K=35 cm s−1 with a period of 234 days (vertical dashed line) and after removal of the stellar intrinsic signals. Four different white noise levels (1–4 m s−1) are shown. The signal of the 3.2 M ⊕ planet drops below the noise between 3 and 4 m s−1.
These results show us that we require our final white noise budget not to exceed the 3 m s−1 level. Based on our older data, we do expect final RV uncertainties to be below this level. This would mean that we are sensitive to super-Earths in the habitable zone of α Cen B with the Hercules RV survey data.
However, we used some assumptions in our simulations that might limit the significance of these results: (1) we used the exact periods, phases and amplitudes of the signals intrinsic to the star as found by HARPS. We can expect that these signals will show up differently in our Hercules data and (2) we only considered circular orbits. The periodogram is most sensitive to sinusoidal variation and sensitivity to more eccentric orbits drops typically for e>0.4 (Endl et al. Reference Endl2002). This would mean that we could miss even more massive planets on eccentric orbits by using periodogram analysis alone. We will therefore use various methods (Fourier-based pre-whitening, local de-trending, a genetic algorithm, etc.) to perform this signal extraction. A planetary-type RV signal must be successfully recovered by several techniques.
Conclusions
The field of exoplanets has steadily moved forward to allow the detection of planets with masses similar to Earth and with orbital periods inside the circumstellar habitable zone of their host star. Owing to its proximity, the α Centauri system is a very attractive target for such an intensive search for rocky planets using the RV technique. Any planets around the nearest stars to the Sun would allow a large variety of follow-up investigations to study these planets for their potential habitability. If the planet even happens to transit, we would be able to use JWST and the next generation of extremely large telescopes to probe the atmospheres of such a planet using transmission spectroscopy.
Recently, Dumusque et al. (Reference Dumusque2012) announced the discovery of a very low-mass planet in a short 3.2-day orbit around α Cen B using 4 years of HARPS data. However, Hatzes (Reference Hatzes2013) casts doubt on the existence of this planet. Clearly, an independent falsification or confirmation is needed.
We are performing a concentrated observing campaign on the α Centauri system with the Hercules spectrograph at the 1 m McLellan telescope at MJUO in New Zealand. As of January 2014 we have observed over 26 000 spectra of α Cen A and over 19 000 spectra of α Cen B. The goal of our programme is to achieve sensitivity to RV signals of rocky planets with orbital periods inside the circumstellar habitable zone. Since 2010 we see the effect of cross-contamination in the spectra by the second star. We have developed an advanced version of our RV code that can include and compensate for contamination in the data modelling to compute the RV of the main target. The 45 000 Hercules α Cen spectra are currently in the process of being re-reduced with this new pipeline.
We explored the expected sensitivity of our programme as a function of final noise level (after the removal of the systematic noise of contamination). These simulations demonstrated that we should be able to confirm the purported Earth-mass planet with a period of 3.24 days even with a high noise level of 5 m s−1. To be sensitive to super-Earths in the habitable zone we require the noise budget to be below 3 m s−1.
The Mt John programme is funded by Marsden grant UOC1007, administered by the Royal Society of New Zealand. This project is also supported in part by the Australian Research Council Discovery Grant DP110101007. The authors would like to thank McDonald Observatory, University of Texas at Austin for allowing the use of the Sandiford iodine cell. SB acknowledges the support of McDonald Observatory which made the 2007 pilot study possible. We thank the two referees; their comments were very helpful to improve this manuscript.