Implications
Calf milk replacers commonly contain 40% to 50% lactose. Lactose is expensive compared with starch, but digestibility is lower for starch than for lactose. It is currently unknown which enzyme is rate limiting for starch digestion. The current study suggests that maltase limits starch digestion in milk-fed calves, indicating that a major part of the starch will undergo fermentation rather than enzymatic hydrolysis. This leads to a lower faecal quality and possibly a reduced growth performance in calves.
Introduction
Calf milk replacers (MR) contain 40% to 50% lactose. Lactose is highly digestible (Burt and Irvine, Reference Burt and Irvine1970; Coombe and Smith, Reference Coombe and Smith1974; Van den Borne et al., Reference Van den Borne, Verstegen, Alferink, Giebels and Gerrits2006), and in a typical MR, lactose accounts for 40% of the digestible energy available to the calf. However, the volatility of lactose prices stimulates MR producers to replace lactose by other sources, particularly starch or products originating from starch.
Starch digestion has been studied in calves, and total tract digestibility varies from 63% to 95% (Huber et al., Reference Huber, Natrajan and Polan1968; Burt and Irvine, Reference Burt and Irvine1970; Nitsan et al., Reference Nitsan, Ben-Asher, Nir and Zoref1990). Ileal disappearance of lactose averaged 97% of intake, whereas ileal disappearance of starch averaged 60% of intake in calves (Coombe and Smith, Reference Coombe and Smith1974). Similar ileal disappearance (66%) was found in steers after infusion of starch in the abomasum (Kreikemeier and Harmon, Reference Kreikemeier and Harmon1995). The low ileal disappearance of starch compared with lactose indicates that enzyme activity required for the hydrolysis of starch to glucose is limited in calves. Which enzyme limits starch digestion in milk-fed calves is, however, unknown.
Starch requires different enzymes for complete hydrolysis to glucose. Pancreatic α-amylase cleaves accessible α-1,4-glycosidic bonds (Dona et al., Reference Dona, Pages, Gilbert and Kuchel2010), resulting mainly in maltose, maltotriose and dextrins, although glucose can appear as well. Thereafter, maltase is required for the further hydrolysis of maltose and maltodextrins to glucose, whereas isomaltase is required to remove α-1,6-branches present in isomaltodextrins. Unlike in calves with a developed rumen, where little starch escapes rumen fermentation, starch inflow in the small intestine in milk-fed calves is directly related to inclusion of starch in the MR. The measurement of activities of luminal or brush border enzymes is usually conducted in calves fed little or no starch. Under these conditions, lactase activity is usually high, up to 180 U/g mucosal protein, maltase activity does not exceed 27 U/g protein and isomaltase activity is even lower than maltase activity (Siddons, Reference Siddons1968; Toofanian et al., Reference Toofanian, Hill and Kidder1973; Le Huerou et al., Reference Le Huerou, Guilloteau, Wicker, Mouats, Chayvialle, Bernard, Burton, Toullec and Puigserver1992). α-Amylase activity measured in pancreatic juice varied considerably between individual milk-fed calves, but was overall considered low (19 mg glucose equivalent/ml pancreatic juice), because no significant amount of starch would be cleaved at this level of α-amylase activity (Morrill et al., Reference Morrill, Stewart, McCormick and Fryer1970). Adaptation of enzyme activities to substrate supply has been shown in rats (glucose/sucrose, Howard and Yudkin, Reference Howard and Yudkin1963; starch, Deschodt-Lanckman et al., Reference Deschodt-Lanckman, Robberecht, Camus and Christophe1971); pigs (protein, Corring and Saucier, Reference Corring and Saucier1972; starch/pectin, Mosenthin et al., Reference Mosenthin, Sauer and Ahrens1994); and calves (lactose, Huber et al., Reference Huber, Keith and Rifkin1964; Toofanian et al., Reference Toofanian, Hill and Kidder1973). Enzyme activity measured in absence of its specific substrate might therefore be misleading. This hampers the identification of the rate-limiting enzyme in starch hydrolysis in milk-fed calves. Therefore, the objective was to identify the rate-limiting enzyme in the hydrolysis of starch in milk-fed calves.
In addition, time required for enzymes to adapt to specific available substrates is an important factor when assessing enzyme activity. In pigs, chymotrypsin and trypsin activity increased 2 days after switching from a protein-free diet to a 30% protein diet (Corring and Saucier, Reference Corring and Saucier1972). In rats, α-amylase activity tripled in 5 days after switching from a 0% starch diet to a 67% starch diet (Deschodt-Lanckman et al., Reference Deschodt-Lanckman, Robberecht, Camus and Christophe1971). It seems that enzymes adapt to a specific diet in 2 to 5 days, at least in omnivores. In ruminating calves and steers, α-amylase responses to starch infusion in the abomasum are absent or even negative (Walker and Harmon, Reference Walker and Harmon1995; Swanson et al., Reference Swanson, Matthews, Woods and Harmon2002). However, often only short-term effects are investigated. It is unknown how enzyme activity responds to an increase in starch availability in milk-fed calves.
Previous studies have shown that faecal dry matter (DM) content decreased with decreased starch utilisation (i.e. faecal starch concentration, blood reducing sugar response) in ruminants (Huber et al., Reference Huber, Jacobson, McGilliard and Allen1961; Ørskov et al., Reference Ørskov, Fraser, Mason and Mann1970). Furthermore, a linear decrease was found in ileal pH when infusing starch or dextrin in the abomasum of steers (Kreikemeier et al., Reference Kreikemeier, Harmon, Brandt, Avery and Johnson1991; Branco et al., Reference Branco, Harmon, Bohnert, Larson and Bauer1999). This decreased pH may indicate that starch is fermented rather than enzymatically hydrolysed. In the current study, it is proposed that gradually exchanging lactose for a selected starch product (SP), allowing ample time for the adaptation of starch-degrading enzymes, and measuring changes in faecal DM content and pH can be used to identify the maximum capacity for the enzymatic digestion of that particular SP. It is assumed that the rate-limiting enzyme for starch hydrolysis can be identified by comparison of the response in faecal DM and pH to SP, selected based on the requirement for different (ratios of) digestive enzymes for their complete degradation to glucose.
The objectives were to determine which enzyme limits starch digestion and to assess the maximum capacity for starch digestion in milk-fed calves.
Material and methods
Experimental design, animals and housing
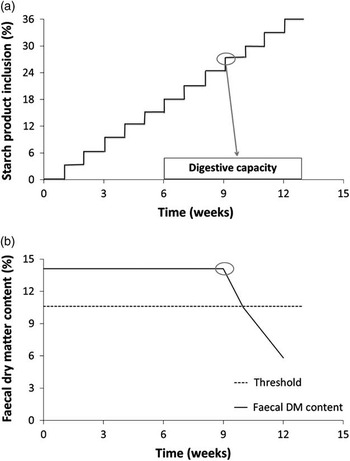
Forty male Holstein Friesian calves of 13 weeks of age (103.6±1.1 kg) were used. Calves were assigned to one of five MR treatments varying in carbohydrate source. The control treatment (CON) contained lactose as the only carbohydrate source. In the other MR treatments, one of four SP was increased stepwise at the expense of lactose. The selected industrial SP originated from corn and included gelatinised starch (GS; Tate&Lyle Europe, Boleraz, Slovakia), maltodextrin (MD; Tereos Syral, Marckolsheim, France; dextrose equivalent (DE)=~13), maltodextrin with a high level of α-1,6-branching (MDB; Tereos Syral, Marckolsheim, France; DE=~9) and maltose (MT; Tereos Syral, Marckolsheim, France). These SP (see the ‘Diets and feeding’ section for details) differ in size and branching and consequently require different ratios of starch-degrading enzymes for their complete hydrolysis to glucose. GS requires α-amylase and (iso)maltase; MD requires (iso)maltase and α-amylase; MDB requires isomaltase, maltase and α-amylase; and MT requires maltase only. The inclusion level of SP increased every week by 3% at the expense of lactose, to a maximum of 36%. For CON, the lactose content was maintained at 52.7%. Different faecal responses to increasing exposure of these SP can be used to identify the rate-limiting enzyme in starch digestion and the maximum capacity for starch digestion (Figure 1). The hypothetical maximum capacity for the digestion of a SP for an individual calf is defined as the inflection point in the relation between inclusion level of SP and the faecal DM content or pH, estimated using non-linear regression. Differences in inflection points can then be used to identify the rate-limiting enzyme in starch digestion.
Approach to identify the maximum digestive capacity for each of the four starch products (SP) tested. (a): The solid line represents the inclusion level of a SP, which was increased every week by 3% points. (b): The dotted line represents the lower reference threshold for faecal dry matter (DM) content. When the faecal DM content was below the threshold for 3 consecutive weeks, the titration was stopped. The solid line represents the hypothetical response of the faecal DM content, decreasing when the calf’s capacity to enzymatically hydrolyse SP is exceeded. The capacity for SP digestion is defined as the estimated inclusion level after which this decrease occurs.

As faecal DM content and pH tend to fluctuate over time, criteria were developed in order to determine when the increase in SP inclusion should be stopped. A faecal DM content of 10.6% was set as the lower reference threshold (see the ‘Results’ scetion for details). For each calf, SP inclusion increased until the faecal DM content was below this reference threshold for 3 consecutive weeks. Calves may also respond to high SP intakes by increasing MR refusals. In calves with a faecal DM content below 10.6%, the increase in SP inclusion was therefore stopped when MR refusals exceeded 10% for 3 consecutive days. In calves with a faecal DM content above 10.6%, the increase in SP inclusion was stopped when MR refusals exceeded 25% per week, with MR refusals occurring during at least seven feedings.
Calves were housed in pairs on wooden-slatted floors. Per calf, 2.7 m2 were available. Lights were on from 0600 to 1800 h. The stable was mechanically ventilated and the average temperature was 11±2.9°C and the average humidity was 94±8.8% (both mean±s.d.). The experiment was approved by the Animal Care and Use Committee of Wageningen University.
Diets and feeding
Until 13 weeks of age, calves were fed a commercial MR and crushed barley from 3 to 8 weeks of age. At 13 weeks of age, all calves were adapted to the CON diet in 4 days (Table 1), which all calves received thereafter for a week. After this week, calves were assigned to the dietary treatments.
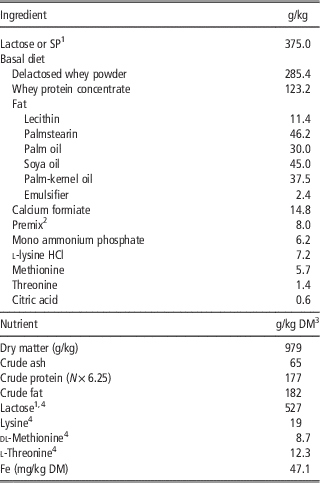
Ingredient and analysed nutrient composition of the experimental milk replacer

SP=starch product; DM=dry matter.
1 In the control treatment, lactose was the only source of carbohydrate. In the four SP treatments (i.e. gelatinized starch, maltodextrin, maltodextrin with a high degree of α-1,6-branching and maltose), lactose was stepwise replaced by a specific SP as presented in Figure 1.
2 Provided (per kg of experimental diet): crude protein, 1.2 g; starch, 0.1 g; lactose, 3.8 g; crude ash, 0.3 g; Ca, 2.5 mg; P, 335 mg; Na, 0.5 mg as sodium selenite; K, 1.0 mg as potassium iodide; Cl, 0.6 mg as choline chloride; Mg, 129 mg as magnesium oxide; Fe, 13 mg as ferrous sulphate; Cu, 2.0 mg as copper sulphate; Zn, 26 mg as zinc sulphate; Mn, 10 mg as manganese sulphate; Se, 0.1 mg as sodium selenite; I, 0.3 mg as potassium iodide; retinol, 2.2 mg; cholecalciferol, 26 μg; dl-α-tocopherol acetate, 26 mg; menadione, 0.5 mg; l-ascorbic acid, 25 mg; thiamine, 1.3 mg; riboflavin, 2.6 mg; niacin, 8.9 mg; d-pantothenic acid, 4.6 mg; pyridoxine, 1.6 mg; cobalamin, 26 μg; biotin, 25 μg; choline, 52 mg; foline, 186 μg.
3 Values are given in g/kg DM unless stated otherwise.
4 Calculated content.
All calves were fed individually according to their metabolic BW (kg0.75) at twice the metabolisable energy requirements for maintenance (ME m ) with estimated ME content based on the CON treatment. ME m was set at 460 kJ/kg0.75 per day (Van Es et al., Reference Van Es, Nijkamp, Van Weerden and Van Hellemond1967). For SP treatments, lactose was exchanged for SP on a weight basis. MR was provided in buckets. Solid feed was not provided, as this would lead to difficulties in estimating starch entry into the intestinal tract.
To allow the SP inclusion level to increase up to 36%, a basal MR was formulated, which was included at 625 g/kg for each experimental MR. The remaining 375 g/kg consisted of lactose for the CON treatment and a combination of lactose and SP for the SP treatments. The ingredient and nutrient composition of MR is shown in Table 1. Each calf received 8.9 g crude protein/kg0.75 per day, 9.5 g crude fat/kg0.75 per day and 27 g carbohydrate/kg0.75 per day.
MR was mixed with water at 66°C to obtain a concentration of 143 g/kg and was supplied to the calves at a temperature of ~42°C at 0600 and 1600 h in two equal portions. Water was available ad libitum.
Measurements
Each week, measurements were performed in order to determine whether the titration of SP for individual calves should be pursued or stopped according to the criteria described above. Faeces were collected directly from the rectum 4 days after exposure to the SP inclusion level and at the same day for the CON calves. Collection started directly after the morning feeding. Throughout the experiment, faeces were collected successfully during the first attempt for ∼75% of the calves. For the other calves, faeces were collected after the next feeding. A maximum of three attempts was required in order to collect faecal samples from all calves. Faecal samples were analysed directly after sampling for DM content and pH. Calves were weighed weekly in order to adapt the feeding level to their metabolic BW.
Analytical procedures
Faecal samples were analysed for DM content by drying at 70°C overnight followed by drying at 103°C for 4 h (ISO, 1999). Faecal pH was determined within 60 min after sampling using a pH meter (Hanna instruments, type: HI 9024, Woonsocket, Rhode Island, USA). The SP were characterised by high-performance size exclusion chromatography (HPSEC) and by high-performance anion exchange chromatography (HPAEC; Zhao et al., Reference Zhao, Schols, Chen, Jin, Buwalda and Gruppen2012). The molecular weight distribution of the SP samples was analysed by HPSEC using an Ultimate 3000 HPLC system (Dionex, Sunnyvale, CA, USA), equipped with a RI72 refractive index detector (Showa Denko K.K., Tokyo, Japan). The SP samples were solubilised in water (2.5 mg/ml) and 25 μl of the solution was injected. Separation of molecular weight fractions was performed on three TSK gel superAW columns in series (AW4000-AW3000-AW2500, each 6×150 mm; Tosoh Bioscience, Tokyo, Japan) in combination with a guard column (3.5×46 mm; Tosoh). For elution, 0.2 M sodium nitrate was used at a flow rate of 0.6 ml/min at 55°C.
The oligosaccharide profile of the SP samples was analysed by HPAEC (Dionex ISC 3000; Dionex), equipped with a DionexCarboPac PA-1 column (2×250 mm) in combination with a CarboPac PA-1 guard column (2×50 mm). The SP samples were solubilised in water (0.01 to 0.1 mg/ml) and 10 μl of the solution was injected using a Dionex ISC3000 autosampler and eluted (0.3 ml/min) using a gradient of 5 to 400 mM NaOAc in 100 mM NaOH during 50 min. Detection was performed using a Dionex ED40 detector in the pulsed amperiometric detection mode.
The degree of branching of SP was analysed by determining the molecular weight distribution before and after de-branching the SP samples with pullanase. Solubilised SP samples were analysed by SEC using Multi Angle Laser Light Scattering for detection and dimethyl sulfoxide as eluent. The degree of polymerisation (DP) of the de-branched part was determined using Pullulan standard calibration. From the increase in the chromatogram after de-branching and the DP of this de-branched part, the percentage of branches in the SP was calculated.
Statistical analysis
Initial BW, faecal DM content and pH were analysed for treatment effects by ANOVA using the GLM procedure in SAS 9.2. To analyse the effect of SP inclusion, faecal DM content and pH was regressed against time. In this way, it was analysed whether faecal DM content or pH changed over time for CON calves. For SP-fed calves, time coincided with increasing inclusion level of SP. One week corresponded to a 3% increase in SP. Faecal DM content and pH decreased already at very low SP inclusion levels. Therefore, linear regression provided a better fit of the data (faecal DM content or pH v. time) than non-linear regression (linear-plateau model (Koops and Grossman, Reference Koops and Grossman1993), Y=a+b×TIME−b×log(1+exp(TIME−c)); or quadratic model, Y=a+b×TIME+c×TIME2), based on the F-test and correction for the number of model parameters. Inflection points were therefore not estimated. The mixed procedure in SAS 9.2 was used to investigate the effect of time (corresponding to SP inclusion for SP-fed calves) on faecal DM content, pH and BW.
The following model was used:
 $$Y_{{ij}} =\mu {\plus}{\rm TREAT}_{i} {\plus}{\rm TIME}_{j} {\plus}({\rm TREAT}{\times}{\rm TIME})_{{ij}} {\plus}{\rm TIME}_{0} {\plus}{\varepsilon}_{{ij}} $$
where, Y is the dependent variable (faecal DM content, faecal pH or BW) during the titration, μ the mean intercept, TREAT i the treatment (i=1, 2, 3, 4, 5), TIME j the time in weeks (j=1, 2, ... ,13, where 1 week corresponds to an increase of 3% in inclusion level of SP for the SP-fed calves), TIME0 represents the faecal DM content, faecal pH or BW during the 1st experimental week, which was taken as a covariate in the model and ε ij the error term. Calf was included in the repeated statement to account for repeated measurements per calf. Based on fit statistics (AIC and BIC), the first-order autoregressive covariance structure was used for faecal DM content and pH and the Toeplitz covariance structure was used for BW. Model residuals were checked on homogeneity of variance. Data transformations were used for pH (square) and for BW (transformed BW=(BW c −1)/c, with c=4) to obtain homogeneity of variance. Differences were considered significant when P<0.05. When main effects were significant, pairwise comparisons were made using the estimate statement. Pearson correlation coefficient was estimated between faecal DM content and faecal pH using the CORR procedure. Results are expressed as non-transformed estimates for parameters analysed with the mixed procedure and as means for the initial parameters analysed with the GLM procedure.
Results
SP characteristics
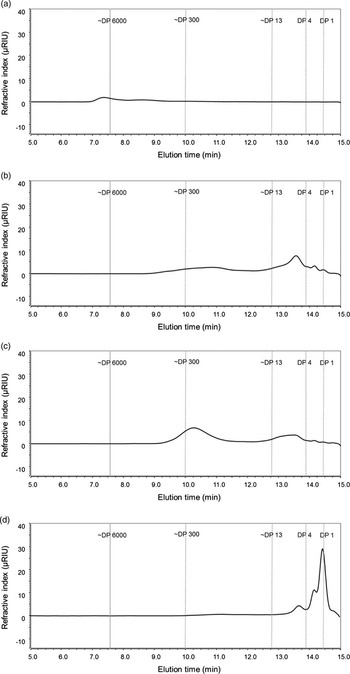
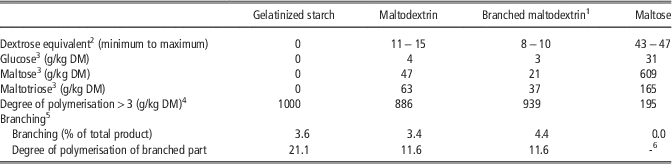
The characteristics of the industrial SP are shown in Table 2 and the molecular weight distributions of the SP are shown in Figure 2. Figure 2 shows that GS contained only polymers and was therefore a suitable product for evaluating α-amylase activity when comparing results of the GS treatment with the MT treatment. Table 2 shows that MT contained 609 g/kg DM maltose and was therefore a suitable product for evaluating maltase activity. MD and MDB were selected so that the main difference between these SP would be the degree of branching in order to evaluate isomaltase activity. The degree of branching was higher for MDB than for MD, although the difference in degree of branching was only 1%. This branching is located in the higher molecular weight fraction, because no iso-linkages were detected in the oligomers with HPAEC (data not shown). The dextrose equivalent was slightly higher for MD compared with MDB, which was (partly) caused by higher concentrations of glucose, maltose and maltotriose in MD.
The molecular weight distribution of the four starch products fed to milk-fed calves. (a): Gelatinized starch; (b): maltodextrin; (c): maltodextrin with a high degree of α-1,6-branching; (d): maltose.

Characteristics of the four starch products used in the experimental milk replacers fed to calves

1 Maltodextrin with a high degree of α-1,6-branching.
2 Adapted from product specifications for maltodextrin, maltodextrin with a high degree of α-1,6-branching and maltose.
3 Analysed by high-performance anion exchange chromatography.
4 Calculated as 1000−glucose−maltose−maltotriose.
5 Analysed by size exclusion chromatography and enzymatic de-branching.
6 Maltose has no branched part and therefore no degree of polymerisation is given.
General
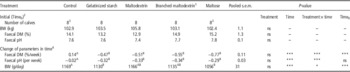
At the start of the 1st experimental week, when all calves received CON, calves weighed 103.6±1.1 kg. Faecal DM content averaged 14.1±1.3% and faecal pH averaged 7.6±0.1 (Table 3). The faecal DM content, rather than faecal pH, was taken as the main criterion in the titration, because it appeared from our initial observations that faecal pH responded less sensitively to SP inclusion than faecal DM content. Therefore, a faecal DM content of 10.6%, being 75% of the initial DM content, was set as the lower reference threshold. The increase in SP inclusion of one calf was stopped according to MR refusal criteria as described previously. For all other calves, the increase in SP inclusion was stopped according to the faecal DM content criterion.
Initial BW, faecal DM content and faecal pH and estimated changes in faecal DM content, faecal pH and BW in time of calves fed a milk replacer containing only lactose (control) or increasing inclusion levels of gelatinized starch, maltodextrin, maltodextrin with a high degree of α-1,6-branching or maltose

DM=dry matter.
1 Maltodextrin with a high degree of α-1,6-branching.
2 Initial values were determined at the start of the experiment when all calves received the control diet. Initial values are expressed as means.
3 n=8 for the initial BW, faecal DM and faecal pH, n=7 for the change of parameters in time.
4 Changes of parameters in time were estimated as described in the text. One week corresponds to an increase in starch product inclusion of 3%. Changes of parameters in time are expressed as non-transformed estimates.
ABMeans in the same row with different superscripts are significantly (P<0.01) different.
***P<0.001; *P<0.05; ns P>0.10.
One calf from the CON treatment was excluded from the experiment based on persistent MR refusals and ruminal drinking, which resulted in bloating. One calf from the MT treatment died during the titration, but the cause of death could not be established. At an inclusion level of 18%, DM intake equalled 50.3 g/kg0.75 for GS, 50.4 g/kg0.75 for MD, 50.2 g/kg0.75 for MDB and 50.5 g/kg0.75 for the MT treatment. At this time point in the titration, DM intake equalled 51.0 g/kg0.75 for the CON treatment. An interaction between treatment and time was detected for BW (P<0.05; Table 3). The estimated BW gain of the calves was 1131±31 g/day, but BW gain of GS and MT calves was lower compared with CON calves.
Digestive capacity
For CON calves, faecal DM content and pH did not change over time. Only for 8 out of 38 calves, the linear-plateau model converged. However, for none of these eight calves, the linear-plateau model provided a better fit than the linear model. For 87% of the SP-fed calves, faecal DM content and pH decreased already at low SP inclusion levels. For these calves, linear regression provided a better fit of the data (faecal DM content or pH v. time) than quadratic regression. Hence, inflection points could not be estimated. For all SP treatments, the faecal DM content and faecal pH decreased in time (P<0.001), where time corresponded to an increasing inclusion level of SP. Slopes of faecal DM content and pH in time are shown in Table 3. The slopes for faecal DM content and faecal pH of all SP treatments differed from CON (P<0.001 for all SP treatments). Slopes did not differ among SP treatments. The mean squared error for the time-related slope in faecal DM content decreased from 6.9 to 6.1 when the covariate was included. The mean squared error for the slope in untransformed faecal pH was 0.5, both with and without inclusion of the covariate. Furthermore, faecal DM content and pH were positively correlated (r=0.62, P<0.001).
Discussion
SP characteristics
The SP were selected based on their size and branching in order to assess enzyme activity. GS contained only polymers and MT contained only low molecular weight fractions and mainly maltose. Therefore, these treatments were used to assess α-amylase activity. Although MDB was more branched compared to MD (29% increase), only 4.4% of the MDB was branched. This contrast was smaller than anticipated and might have been too small to detect differences in isomaltase activity. However, both MD and MDB contained α-1,6 linkages, whereas no α-1,6 linkages were detected in MT. Therefore, the faecal responses of calves fed MD and MDB can be compared with calves fed MT in order to assess isomaltase activity indirectly.
General
All SP treatments had a numerically lower daily BW gain compared with the CON treatment, although this could (partly) be ascribed to the lower DM intake for SP-fed calves because of the lower DM content in the SP than in the lactose. However, the reduction in faecal DM content with increasing intake of SP did only lead to a significant reduction in daily gain for the GS and MT treatment. Although the study was not designed to measure a response in daily gain, a reduction in growth (Huber et al., Reference Huber, Natrajan and Polan1968; Natrajan et al., Reference Natrajan, Polan, Chandler, Jahn and Huber1972), as a result of fermentation instead of digestion, was expected. The lower daily gain for the MT treatment is associated with a greater numerical decrease in faecal DM content in time, but not with faecal pH. Probably, the MT treatment resulted in a higher osmotic pressure and subsequent greater passage rate and therefore resulted in a decreased daily gain. There was a strong positive correlation between faecal DM content and pH, which corresponds with previous findings in milk-fed calves (Roy, Reference Roy1969). The decrease in faecal pH with increasing inclusion level indicates the increase in fermentative degradation of SP.
We used a within-animal approach to investigate the effect of inclusion level of SP on faecal DM content and pH in milk-fed calves. This approach allowed us to incorporate the initial faecal DM content and pH as a covariate. Including this covariate in the model for faecal DM content improved the estimation of the slopes (mean squared error decreased from 6.9 to 6.1 when including the covariate). Another advantage of this approach is that it requires less animals compared with the conventional between-animal titration approach. Testing four SP treatments at for instance five inclusion levels and five animals per treatment would already require 100 calves, whereas our approach required only 40 calves. However, in our approach inclusion level of SP was confounded with time and therefore age. Therefore, the control treatment was included. For the CON treatment, no change over time was found in faecal DM content and pH. The slopes for faecal DM content and pH of the SP treatments differed from CON, indicating that these negative slopes found for the SP treatments were caused by inclusion of SP and not by other factors such as age.
Digestive capacity
Faecal DM content and pH did not change in time for CON calves. A linear relation between time and faecal DM content and pH was found for most SP calves, indicating that the digestive capacity was already exceeded at low levels of SP intake. The linear relation shows that every per cent increase of SP in the MR, results in a constant decline in faecal DM content and pH, regardless the inclusion level. This indicates that fermentation contributes to starch disappearance already at low inclusion level. Apparent ileal digestibility of lactose is high in calves (97% of intake; Coombe and Smith, Reference Coombe and Smith1974), and including SP in the MR instead of lactose is therefore likely to reduce feed efficiency. Nonetheless, it may still be attractive to include starch in MR when starch is relatively cheap compared with lactose.
Roughly 50% of the calves suffered from diarrhoea (faecal DM content <10.6%) at an SP inclusion level of 18% (9 g of SP/kg0.75 per day). This is in contrast with data from Nitsan et al. (Reference Nitsan, Ben-Asher, Nir and Zoref1990), where diarrhoea was not observed (DM content 16% to 20%) in calves fed 9 g of corn starch/kg0.75 per day. However, starch concentration in the MR was not equal between the morning and afternoon meal in the study of Nitsan et al. (Reference Nitsan, Ben-Asher, Nir and Zoref1990) and the calves used were younger compared with the calves used in the current study. The faecal pH after the afternoon meal was lower for the corn starch-fed calves (6.0±0.13) compared with glucose-fed calves (7.3±0.28; Nitsan et al., Reference Nitsan, Ben-Asher, Nir and Zoref1990), which is in agreement with our findings for SP-fed calves. The occurrence of diarrhoea when providing starch has been documented before in milk-fed calves (Flipse et al., Reference Flipse, Huffman, Duncan and Webster1950; Huber et al., Reference Huber, Jacobson, McGilliard and Allen1961) and sheep (Ørskov et al., Reference Ørskov, Fraser, Mason and Mann1970). We found a linear decrease in faecal DM content with increasing inclusion level of SP, indicating that, despite the slow increase in SP inclusion level, adaptation of enzymes is limited in milk-fed calves. This corresponds with findings by Natrajan et al. (Reference Natrajan, Polan, Chandler, Jahn and Huber1972) who did not find differences in total tract starch digestibility between milk-fed calves that were adapted for either 4 days or 12 weeks to starch inclusion. At the ileal level, however, differences in starch digestion may have occurred in that study.
The decline in faecal pH with increasing SP inclusion is in agreement with studies in ruminants. An inverse linear relation was found between abomasal starch or dextrin infusion and ileal digesta pH in steers (Kreikemeier et al., Reference Kreikemeier, Harmon, Brandt, Avery and Johnson1991) and between ileal glucoside content and ileal pH in sheep (Mayes and Ørskov, Reference Mayes and Ørskov1974). This linear decline indicates that the enzymatic capacity for starch digestion is already low at low inclusion levels of starch and suggests that fermentation may contribute substantially to SP disappearance. Small intestinal starch disappearance has been studied in ruminants. In steers, small intestinal disappearance was 66% for corn starch after abomasal infusion of 66 g/h. Of this corn starch disappearance, only 23% was recovered as glucose in the portal vein (Kreikemeier and Harmon, Reference Kreikemeier and Harmon1995). The unaccounted part of the starch disappearance can be explained by intestinal fermentation or glucose metabolism in gastro-intestinal tissues. The latter was accounted for by correcting for the negative portal glucose uptake when infusing water, leading to a corrected portal glucose flux of 57% of the small intestinal disappearance. This indicates that 43% of the corn starch that disappeared in the small intestine could have been fermented. The fermentation hypothesis is supported by a higher concentration of short-chain fatty acids in the ileal digesta of starch- and dextrin-infused steers (Kreikemeier and Harmon, Reference Kreikemeier and Harmon1995).
The relationship between faecal DM content and SP inclusion level appeared linear and no inflection points could be estimated. We assumed that differences in slopes, instead of differences in inflection points, between SP treatments would enable us to deduce the rate-limiting enzyme. As the slopes of the GS and MT treatment did not differ, α-amylase can be considered non-limiting in starch hydrolysis. If isomaltase would be the limiting enzyme in starch hydrolysis, the drop in faecal DM content and pH for MD and MDB calves would be expected to be larger than the drop for MT calves. The lack of differences between SP treatments implies that maltase activity limits starch digestion in milk-fed calves, because all SP need maltase to achieve complete hydrolysis to glucose.
Alternatively, glucose absorption from the intestinal lumen could limit the uptake of starch-derived glucose and result in a reduced faecal DM content. To further investigate this, maltose feeding should be compared with glucose feeding. However, a high oral glucose load could lead to osmotic diarrhoea, not necessarily coinciding with a decrease in faecal pH. Indeed, infusion of glucose in the abomasum of steers at 80 g/h (Kreikemeier et al., Reference Kreikemeier, Harmon, Brandt, Avery and Johnson1991) and feeding a glucose solution of 4.8 g/kg BW to calves by nipple bottle (Sen et al., Reference Sen, Constable and Marshall2006) resulted frequently in diarrhoea. Comparing glucose to maltose feeding in a titration approach, as in the current study, would therefore be difficult because osmotic diarrhoea is likely to occur. Even in our study, osmotic pressure could have contributed to the decrease in faecal DM content, especially in the MT treatment. Providing a maltose solution to cattle resulted in diarrhoea in all age groups (varying from 22 to 600 days), whereas diarrhoea was not observed after providing a starch solution (Huber et al., Reference Huber, Jacobson, McGilliard and Allen1961). Results from other studies suggest that glucose absorption is not rate limiting in starch uptake from the small intestine. When maltose was fed to calves, apparent ileal maltose disappearance was 43% of intake and the remaining sugars in the ileum did not contain any free glucose (Coombe and Smith, Reference Coombe and Smith1974). Abomasal infusion of corn starch in steers resulted in an ileal disappearance of starch of 66% and the remaining sugars in the ileum contained only 4% free glucose (Kreikemeier and Harmon, Reference Kreikemeier and Harmon1995). Abomasal infusion of glucose in steers resulted in a higher portal glucose uptake compared with starch or dextrin infusion (Kreikemeier et al., Reference Kreikemeier, Harmon, Brandt, Avery and Johnson1991; Kreikemeier and Harmon, Reference Kreikemeier and Harmon1995). We suggest that maltase activity probably limits starch digestion in milk-fed calves.
In conclusion, faecal DM content and pH sensitively respond to incremental inclusion of SP. This suggests that the maximum capacity for starch digestion is already exceeded at low levels of SP intake. The linear decrease is independent of the SP size and degree of branching. This indicates that maltase limits starch digestion in milk-fed calves and that fermentation may contribute substantially to total tract starch disappearance in milk-fed calves.
Acknowledgements
The authors would like to thank the personnel of the experimental facilities of the VanDrie Group for their skilled technical assistance. The analytical assistance of Simone Albrecht and the practical assistance of Francine Wartena were highly appreciated. This project was jointly financed by the European Union, European Regional Development Fund and The Ministry of Economic Affairs, Agriculture and Innovation, Peaks in the Delta, the Municipality of Groningen, the Provinces of Groningen, Fryslân and Drenthe as well as the Dutch Carbohydrate Competence Center (CCC2 WP21). Financial support was also provided by Tereos Syral and VanDrie Group.