I. INTRODUCTION
Calcium citrate (as the tetrahydrate) is a common dietary calcium supplement, as well as a food additive. It is supposed to be more bioavailable than calcium carbonate when used as a calcium supplement (Tondapu et al., Reference Tondapu, Provost, Adams-Huet, Sims, Chang and Sakhaee2009). Calcium citrate is an intermediate in the isolation of citric acid from the fermentation process by which citric acid is produced industrially. The citric acid in the broth is neutralized by the addition of calcium hydroxide, precipitating calcium citrate.
Calcium citrate tetrahydrate has been observed as the mineral earlandite in an unconsolidated ocean floor sediment from the Weddell Sea near Antarctica (Bannister, Reference Bannister1936). A powder pattern of earlandite is included in the Powder Diffraction File (Fawcett et al., Reference Fawcett, Kabekkodu, Blanton and Blanton2017) as entry 00-028-2003; the source is a private communication from Monsanto. A monoclinic unit cell was reported by Poganis and Shaw (Reference Poganis and Shaw1957). A triclinic crystal structure of calcium citrate tetrahydrate has been reported only recently (Herdtweck et al., Reference Herdtweck, Kornprobst, Sieber, Straver and Plank2011), from a hydrothermally synthesized pseudomerohedrally-twinned crystal at 123 K. The structure is included in the Cambridge Structural Database (Groom et al., Reference Groom, Bruno, Lightfoot and Ward2016) as Refcode ISEQIH. A powder pattern calculated from this crystal structure is included in the Powder Diffraction File as entry 01-084-5956. The Herdtweck paper also reports a Rietveld refinement using room-temperature powder data.
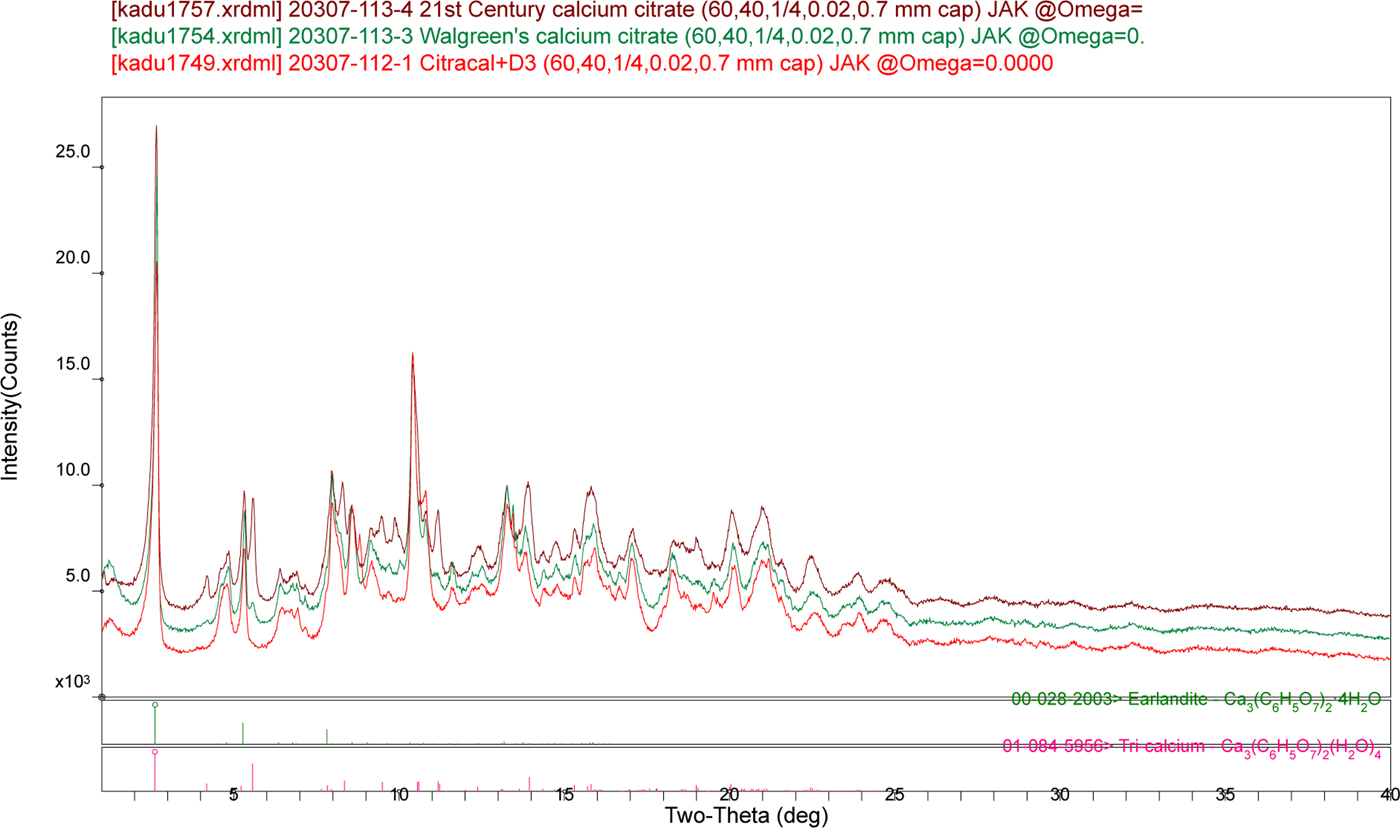
Although a search of the powder patterns of three commercial calcium supplements against the PDF (subject to the filter C, H, O, and Ca only) yields the entry 00-028-2003 as a hit, the similarity of the patterns to the database entry is not particularly good (Figure 1). The major phase in the supplements does not match the pattern calculated from the ISEQIH structure, even though it appears to be present in two of the supplements as a minor phase. To carry out quantitative phase analyses of these tablets, the crystal structure of the major form of calcium citrate tetrahydrate had to be determined.
(Colour online) Comparison of the powder patterns of three commercial calcium citrate supplements and the PDF entries for calcium citrate tetrahydrate.

II. EXPERIMENTAL
Supplements
Citracal + D3, Walgreen's calcium citrate, and Century calcium citrate were purchased from local pharmacies. The tablets were ground in a mortar and pestle, sieved to <325 mesh, and packed into 0.7 mm glass capillaries, which were sealed with petroleum jelly. The powder patterns were measured on a PANalytical Empyrean diffractometer equipped with an incident-beam focusing mirror and an X'Celerator detector. The patterns (1°–50° 2θ, 0.0167113° steps, 4 s step−1, 1/4° divergence slit, 0.02 rad Soller slits) were measured from rotated capillaries using MoKα radiation.
Ca3(C6H5O7)2(H2O)6
Calcium carbonate (1.5028 g, 15.0 mmoles) was added to a solution of 2.0759 g citric acid monohydrate (10.0 mmoles) in 8 mL distilled water. After the fizzing of the reaction, the clear colorless solution was evaporated at ambient conditions. The yield of white solid was 2.4890 g, which corresponded to the hexahydrate. The thermogravimetric analysis also confirmed the compound as the hexahydrate; the water loss occurred in two steps, at approximately 80 and 140 °C. A powder pattern was measured on a Bruker D2 Phaser diffractometer equipped with a LynxEye position-sensitive detector (5°–70° 2θ, 0.0202144° steps, 0.5 s step−1, 0.6° divergence slit, 2.5° Soller slits, 3 mm scatter screen height) using CuKα radiation. This pattern could be indexed on a C-centered monoclinic unit cell having a = 21.424, b = 6.344, c = 17.316 Å, β = 109.30°, and V = 2234.37 Å3, but structure solution was unsuccessful (because this was the wrong unit cell).
The white powder was packed into a 1.5 mm diameter Kapton capillary and rotated during the measurement at ~50 cycles s−1. The powder pattern was also measured at 295 K at beam line 11-BM (Lee et al., Reference Lee, Shu, Ramanathan, Preissner, Wang, Beno, Von Dreele, Ribaud, Kurtz, Antao, Jiao and Toby2008; Wang et al., Reference Wang, Toby, Lee, Ribaud, Antao, Kurtz, Ramanathan, Von Dreele and Beno2008) of the Advanced Photon Source at Argonne National Laboratory using a wavelength of 0.413357 Å from 0.5° to 50° 2θ with a step size of 0.001° and a counting time of 0.1 s step−1. The pattern was indexed on a C-centered monoclinic unit cell having a = 33.015, b = 10.777, c = 5.957 Å, β = 91.71̊, V = 2118.4 Å3, and Z = 4 using Jade (MDI, 2016). Analysis of the systematic absences using EXPO2014 (Altomare et al., Reference Altomare, Cuocci, Giacovazzo, Moliterni, Rizzi, Corriero and Falcicchio2013) suggested the space groups Cc and C2/c. C2/c was assumed, and was confirmed by successful solution and refinement of the structure. A reduced cell search in the Cambridge Structural Database (Groom et al., Reference Groom, Bruno, Lightfoot and Ward2016) combined with the chemistry “C H O Ca only” yielded only poly[μ3-succinatocalcium(II)], [Ca(C4H5O4)]n (Mazaj et al., Reference Mazaj, Kaucic, Golobic and Zabukovec Logar2012; Refcode XAQJIK). The structure was solved by direct methods using EXPO2014.
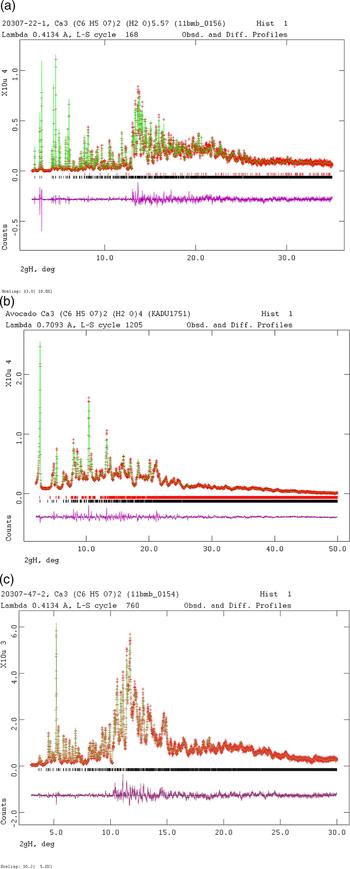
Rietveld refinement was carried out using GSAS (Toby, Reference Toby2001; Larson and Von Dreele, Reference Larson and Von Dreele2004). Only the 2.0°–35.0° portion of the pattern was included in the refinement (d min = 0.687 Å). All non-H bond distances and angles were subjected to restraints. The C–C bonds between the terminal carboxyl carbon atoms and the adjacent carbon atoms were restrained at 1.51(1) Å, the C–C bonds between the central carbon atom and the adjacent carbon atoms at 1.54(1) Å, the C–C bond between the central carbon atom and the central carboxyl carbon at 1.55(1) Å, the C–O bond to the hydroxy group at 1.42(2) Å, and the C–O bonds in the carboxylate groups at 1.27(2) Å. The tetrahedral carbon bond angles were restrained at 109(3)°, and the angles in the planar carboxyl groups at 120(3)°. The hydrogen atoms were included at fixed positions, which were recalculated during the course of the refinement using Materials Studio (Dassault, 2014). The Ca–O distances were not restrained. The restraints contributed 1.1% to the final χ 2. The U iso of the non-H atoms were grouped by chemical similarity. The U iso of each citrate hydrogen atom was fixed at 1.3× that of the heavy atom to which it was attached. The peak profiles were described using profile function #4 (Thompson et al., Reference Thompson, Cox and Hastings1987; Finger et al., Reference Finger, Cox and Jephcoat1994), which includes the Stephens (Reference Stephens1999) anisotropic strain broadening model. The background was modeled using a three-term shifted Chebyshev polynomial, with a four-term diffuse scattering function to model the Kapton capillary and any amorphous component. A sixth-order spherical harmonic model was included; the refined texture index was only 1.004, so preferred orientation was not significant. A few weak peaks were not accounted for by the major phase. They corresponded to calcite, which was included in the refinement and its concentration refined to 0.9 wt%. The final refinement of 94 variables using 33 032 observations (33 003 data points and 29 restraints) yielded the residuals R wp = 0.0774, R p = 0.0618, and χ 2 = 3.188. The largest peak (0.06 Å from Ca19) and hole (1.64 Å from O21) in the difference Fourier map were 0.35 and −0.20 eÅ−3, respectively. The Rietveld plot is included as Figure 2(a). The largest errors in the fit are in the shapes of some of the low-angle peaks.
(Colour online) (a) The Rietveld plot for the refinement of calcium citrate hexahydrate. The red crosses represent the observed data points, and the green line is the calculated pattern. The magenta curve is the difference pattern, plotted at the same vertical scale as the other patterns. The vertical scale has been multiplied by a factor of 10 for 2θ >13.0°. (b) The Rietveld plot for the refinement of the new form of calcium citrate tetrahydrate. The red crosses represent the observed data points, and the green line is the calculated pattern. The magenta curve is the difference pattern, plotted at the same vertical scale as the other patterns. The row of black tick marks indicates the calculated reflection positions for the new form, and the red tick marks indicate peaks from the 1% ISEQIH impurity. (c) The Rietveld plot for the refinement of anhydrous calcium citrate. The red crosses represent the observed data points, and the green line is the calculated pattern. The magenta curve is the difference pattern, plotted at the same vertical scale as the other patterns. The vertical scale has been multiplied by a factor of 5 for 2θ >10.2°.

Ca3(C6H5O7)2(H2O)4
Reagent calcium citrate tetrahydrate was purchased from Avocado Research Chemicals Ltd. (lot #C8307A) and Aldrich Chemical Co. (lot # 15421BO). The peaks from the Avocado sample were narrower, so that pattern was used for structure solution and refinement. The powder was ground in a mortar and pestle, sieved to <325 mesh, packed into a 0.7 mm glass capillary, and sealed with petroleum jelly. The powder pattern was measured on a PANalytical Empyrean diffractometer equipped with an incident-beam focusing mirror and an X'Celerator detector. The pattern (1–50° 2θ, 0.0167113° steps, 4 s step−1, 1/4° divergence slit, 0.02 radian Soller slits) was measured from a rotated capillary using MoKα radiation.
The relatively broad peaks [FWHM (full-width at half-maximum) ~0.10°–0.15°] and extensive peak overlap made this a difficult pattern to index. After many trials, several algorithms settled on the same triclinic cell, with a = 5.905, b = 10.463, c = 15.416 Å, α = 93.496, β = 95.736, γ = 90.602°, V = 954.8 Å3, and Z = 2. The space group was assumed to be P-1, which was confirmed by successful solution and refinement of the structure. A reduced cell search (2% tolerance) in the Cambridge Structural Database (Groom et al., Reference Groom, Bruno, Lightfoot and Ward2016) combined with the chemistry “C H O Ca only” yielded no hits.
Many attempts to solve the structure by direct methods, charge flipping, and Monte Carlo simulated annealing using independent Ca and citrate fragments were unsuccessful. Eventually, it was realized that the unit cell was similar to (and smaller than) the reduced cell of the C-centered monoclinic cell of the hexahydrate: a = 5.9570, b = 10.7728, c = 17.3590 Å, α = 108.07, β = 91.62, and γ = 90.00°. The transformation matrix is [0 0 1/0–1 0/½ ½ 0]. Using Materials Studio, the hexahydrate structure was transformed to the reduced cell. The two non-coordinated water molecules were removed, and the lattice parameters were changed to the observed values for the tetrahydrate. The structure was optimized using Forcite (fixed cell), and the Rietveld refinement was begun from this model.
Rietveld refinement was carried out using GSAS (Toby, Reference Toby2001; Larson and Von Dreele, Reference Larson and Von Dreele2004). Only the 2.0–50.0° portion of the pattern was included in the refinement (d min = 0.839 Å). All non-H bond distances and angles were subjected to restraints. The C–C bonds between the terminal carboxyl carbon atoms and the adjacent carbon atoms were restrained at 1.51(2) Å, the C–C bonds between the central carbon atom and the adjacent carbon atoms at 1.54(1) Å, the C–C bond between the central carbon atom and the central carboxyl carbon at 1.55(1) Å, the C–O bond to the hydroxyl group at 1.43(3) Å, and the C–O bonds in the carboxylate groups at 1.25(2) Å. The tetrahedral carbon bond angles were restrained at 109(3)°, and the angles in the planar carboxyl groups at 120(3)°. The hydrogen atoms were included at fixed positions, which were recalculated during the course of the refinement using Materials Studio (Dassault, 2014). The Ca–O distances were restrained to 2.43(10) Å, and non-bonded O⋯O distance restraints were applied to the water molecules in the Ca39 coordination sphere. The restraints contributed 22.7% to the final χ 2. The main deviations from the restrained values are in the Ca–O distances and the O–C–O carboxylate angles, which we expect to be more variable. A common U iso was refined for the Ca atoms, but the U iso of the other non-H atoms were fixed at reasonable values. The U iso of each hydrogen atom was fixed at 1.3× that of the heavy atom to which it was attached. The peak profiles were described using profile function #4 (Thompson et al., Reference Thompson, Cox and Hastings1987; Finger et al., Reference Finger, Cox and Jephcoat1994), which includes the Stephens (Reference Stephens1999) anisotropic strain broadening model. The background was modeled using a one-term shifted Chebyshev polynomial, with a seven-term diffuse scattering function to model the glass capillary and any amorphous component. An eighth-order spherical harmonic model was included; the refined texture index was 1.824, so preferred orientation was significant. ISEQIH was included as a second phase, and its concentration refined to 1.2 wt%. The final refinement of 155 variables using 2959 observations (2871 data points and 88 restraints) yielded the residuals R wp = 0.0543, R p = 0.0423, and χ 2 = 10.37. The largest peak (1.79 Å from O15) and hole (at Ca19 and Ca20) in the difference Fourier map were 3.71 and −6.40 eÅ−3, respectively. The Rietveld plot is included as Figure 2(b). The overall fit is excellent; the good signal/noise and the restraints result in a relatively high reduced χ 2 to accompany the low R wp. The largest errors in the fit are in the shapes of some of the peaks.
Ca3(C6H5O7)2
An aliquot of Sigma-Aldrich calcium citrate tetrahydrate was heated in air from 20 to 260 °C at 8.5 °C min−1, and held at 260° for 33 min. The resulting white powder was transferred to a sealed glass jar to cool. A powder pattern was measured on a Bruker D2 Phaser diffractometer equipped with a LynxEye position-sensitive detector (5–70° 2θ, 0.0202144° steps, 0.5 s step−1, 0.6° divergence slit, 2.5° Soller slits, 3 mm scatter screen height) using CuKα radiation. This pattern could be indexed on a primitive monoclinic unit cell having a = 12.161, b = 10.251, c = 14.034 Å, β = 95.62°, and V = 1741.33 Å3.
The white powder was packed into a 1.5 mm diameter Kapton capillary and rotated during the measurement at ~50 cycles s−1. The powder pattern was also measured at 295 K at beam line 11-BM (Lee et al., Reference Lee, Shu, Ramanathan, Preissner, Wang, Beno, Von Dreele, Ribaud, Kurtz, Antao, Jiao and Toby2008; Wang et al., Reference Wang, Toby, Lee, Ribaud, Antao, Kurtz, Ramanathan, Von Dreele and Beno2008) of the Advanced Photon Source at Argonne National Laboratory using a wavelength of 0.413357 Å from 0.5° to 50° 2θ with a step size of 0.001° and a counting time of 0.1 s step−1. Both N-TREOR incorporated into EXPO2014 (Altomare et al., Reference Altomare, Cuocci, Giacovazzo, Moliterni, Rizzi, Corriero and Falcicchio2013) and Jade (MDI, 2016) yielded the same triclinic unit cell having a = 6.103, b = 10.483, c = 13.131 Å, α = 111.75, β = 90.36, γ = 92.00°, V = 779.64 Å3, and Z = 2. The space group was assumed to be P-1, which was confirmed by successful solution and refinement. A reduced cell search (2% tolerance) in the Cambridge Structural Database (Groom et al., Reference Groom, Bruno, Lightfoot and Ward2016) combined with the chemistry “C H O Ca only” yielded the structures of calcium formate, but no other hits.
Many attempts to solve the structure by direct methods, charge flipping, and Monte Carlo simulated annealing using independent Ca and citrate fragments were unsuccessful. The successful strategy was to extract a Ca3(C6H5O7)2 fragment from the structure of Ca3(C6H5O7)2(H2O)6, and remove the Ca–O chelation bonds, leaving each Ca bonded to only one O. This complex fragment was used to solve the structure with FOX (Favre-Nicolin & Černý, Reference Favre-Nicolin and Černý2002). The structure was optimized using the (force field) Forcite module of Materials Studio (Dassault, 2014) to begin the Rietveld refinement. The final refinement was started from the result of the density functional theory (DFT) calculation.
Rietveld refinement was carried out using GSAS (Toby, Reference Toby2001; Larson and Von Dreele, Reference Larson and Von Dreele2004). Only the 3.0°–30.0° portion of the pattern was included in the refinement (d min = 0.798 Å). The lowest-angle portion of the pattern was shadowed by the beam stop, and the asymmetry of the lowest-angle peak was difficult to model. To avoid bias from an incorrect intensity, this peak was excluded. All non-H bond distances and angles were subjected to restraints. The C–C bonds between the terminal carboxyl carbon atoms and the adjacent carbon atoms were restrained at 1.51(1) Å, the C–C bonds between the central carbon atom and the adjacent carbon atoms at 1.54(1) Å, the C–C bond between the central carbon atom and the central carboxyl carbon at 1.55(1) Å, the C–O bond to the hydroxy group at 1.42(2) Å, and the C–O bonds in the carboxylate groups at 1.27(2) Å. The tetrahedral carbon bond angles were restrained at 109(3)°, and the angles in the planar carboxyl groups at 120(3)°. The hydrogen atoms were included at fixed positions, which were recalculated during the course of the refinement using Materials Studio (Dassault, 2014). The Ca–O distances were not restrained. The restraints contributed 12.4% to the final χ 2; the deviations from the restrained values were widely distributed among the geometrical parameters. The U iso of the non-H atoms were grouped by chemical similarity. The U iso of the hydrogen atoms were fixed at a reasonable value. The peak profiles were described using profile function #4 (Thompson et al., Reference Thompson, Cox and Hastings1987; Finger et al., Reference Finger, Cox and Jephcoat1994), which includes the Stephens (Reference Stephens1999) anisotropic strain broadening model. The background was modeled using a four-term shifted Chebyshev polynomial, with a four-term diffuse scattering function to model the Kapton capillary and any amorphous component. A second-order spherical harmonic model was included; the refined texture index was only 1.005, so preferred orientation was not significant. The final refinement of 122 variables using 27 059 observations (27 001 data points and 58 restraints) yielded the residuals R wp = 0.0608, R p = 0.0484, and χ 2 = 1.800. The largest peak (0.07 Å from Ca20) and hole (2.19 Å from O35) in the difference Fourier map were 0.27 and −0.24 eÅ−3, respectively. The Rietveld plot is included as Figure 2(c). The largest errors in the fit are in the shapes of some of the low-angle peaks.
DFT calculations
Density functional geometry optimizations (fixed experimental unit cells) were carried out using CRYSTAL14 (Dovesi et al., Reference Dovesi, Orlando, Erba, Zicovich-Wilson, Civalleri, Casassa, Maschio, Ferrabone, De La Pierre, D-Arco, Noël, Causà and Kirtman2014). The basis sets for the H, C, and O atoms were those of Gatti et al. (Reference Gatti, Saunders and Roetti1994), and for Ca atoms was that of Catti et al. (Reference Catti, Dovesi, Pavese and Saunders1991). The calculations were run on eight 2.1 GHz Xeon cores (each with 6 Gb RAM) of a 304-core Dell Linux cluster at IIT, used eight k-points and the B3LYP functional, and took ~1–15 days (22 h for the hexahydrate, 361 h for the new tetrahydrate, 145 h for ISEQIH, and 60 h for anhydrous).
For Ca3(C6H5O7)2(H2O)4, a density functional optimization (fixed experimental unit cell) was also carried out using VASP (Kresse and Furthmüller, Reference Kresse and and Furthmüller1996) through the MedeA graphical interface (Materials Design, 2016). The calculation was carried out on eight 2.4 GHz processors (each with 4 Gb RAM) of a 64-processor HP Proliant DL580 Generation 7 Linux cluster at North Central College. The calculation used the GGA–PBE functional, a planewave cut-off energy of 400 eV, and a k-point spacing of 0.5 Å−1 (four k-points), and took 3.5 h.
III. RESULTS AND DISCUSSION
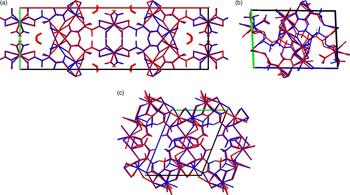
The refined atom coordinates of calcium citrate hexahydrate, calcium citrate tetrahydrate (both this form and ISEQIH), and anhydrous calcium citrate and the coordinates from the DFT optimizations are reported in the CIFs attached as Supplementary Material. The root-mean-square Cartesian displacement of the non-hydrogen atoms in the hexahydrate is only 0.086 Å [Figure 3(a)]. The excellent agreement between the refined and optimized structures is evidence that the experimental structure is correct (van de Streek and Neumann, Reference van de Streek and Neumann2014). The root-mean-square (RMS) displacement in the tetrahydrate is 0.652 Å, well outside the threshold for correct powder structures. The Ca positions are similar, as are the general positions of the citrate anions. The orientation of the O15–C6–O16 carboxyl group is unusual in the refined structure. The positions and orientations of the O13–C5–O14 and O33–C25–O34 carboxyl groups differ considerably between the refined and optimized structures. The RMS displacement in ISEQIH is only 0.059 Å, as expected for a correct single crystal structure. The RMS displacement in anhydrous calcium citrate is 0.364 Å, at the edge of correct powder structures. Although there are differences in the positions and orientations of carboxyl groups, the refined and optimized structures are quite similar. The following discussion uses the DFT-optimized structures, as I consider them to be more reliable.
(Colour online) (a) Comparison of the refined and optimized structures of calcium citrate hexahydrate. The Rietveld refined structure is in red, and the DFT-optimized structure is in blue. (b) Comparison of the refined and optimized structures of the new form of calcium citrate tetrahydrate. The Rietveld refined structure is in red, and the DFT-optimized structure is in blue. (c) Comparison of the refined and optimized structures of anhydrous calcium citrate. The Rietveld refined structure is in red, and the DFT-optimized structure is in blue.

Almost all of the bond distances, bond angles, and torsion angles in the citrate anions fall within the normal ranges indicated by a Mercury Mogul Geometry check (Macrae et al., Reference Macrae, Bruno, Chisholm, Edington, McCabe, Pidcock, Rodriguez-Monge, Taylor, van de Streek and Wood2008). The C2–C3–C4 angle of 123° in the tetrahydrate, the C2–C3–C4–C5 torsion angle of 36° in the tetrahydrate, and the C2–C3–C4–C5 torsion angle of 131° in anhydrous calcium citrate are flagged as unusual. In the hexahydrate, the single citrate is in the trans/trans conformation, which is one of the two low-energy conformations of a citrate anion (Rammohan and Kaduk, Reference Rammohan and Kaduk2018). In the tetrahydrate and anhydrous compounds, one of the two citrate anions is in the trans/trans conformation, but the other (as noted above) lies outside the usual distribution of trans/trans and trans/gauche conformations. In ISEQIH, some of the C-C-C-C torsional angles are also slightly unusual. Presumably, the coordination to Ca and hydrogen bonding has caused the citrate anions to distort slightly.
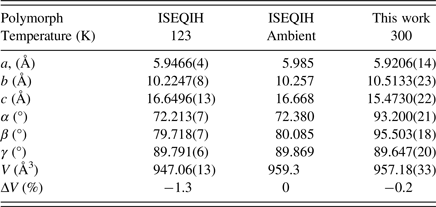
In the hexahydrate, Ca19 is 8-coordinate (bond valence sum = 2.13), and is bonded to only citrate oxygens. Ca20 is also 8-coordinate (bond valence sum = 2.19) and is bonded to four water molecules and four carboxylate oxygens. The water molecule O23 is not coordinated to Ca. In the new tetrahydrate, Ca19 and Ca20 (bond valence sums 2.14 and 2.24) are 8-coordinate, and bonded only to citrate oxygens. The third Ca39 is 7-coordinate (bond valence sum 1.92), and coordinated to three citrate oxygens and four water molecules. The carboxylate oxygen O13 is not coordinated to Ca. In ISEQIH, all three Ca are 8-coordinate. Ca2 and Ca3 (bond valence sums 2.22 and 2.20) are bonded only to carboxylate oxygens. Ca1 (bond valence sum 2.19) is bonded to six citrate oxygens and two water molecules. The water molecules O32 and O33 are not coordinated to Ca. The differences in coordination result in small differences in lattice parameters (Table I). In anhydrous calcium citrate, Ca19 and Ca20 are 8-coordinate (bond valence sums 2.09 and 2.16), while Ca39 is only 7-coordinate (bond valence sum 1.96). In three of the compounds, the Mulliken overlap populations in the Ca–O bonds range from 0.01 to 0.03 electrons, indicating a small degree of covalent character. In the new tetrahydrate, the overlap populations are slightly negative, indicating that the bonding is ionic.
Triclinic (P-1) lattice parameters of Ca3(C6H5O7)2(H2O)4.

A citrate anion is normally considered to be a good chelating agent, and several sorts of chelation are observed in these compounds. A carboxylate group acts as a bidentate ligand to a single Ca. Often, this chelation is accompanied by additional coordination to Ca on one or both of the carboxylate oxygens. All of these compounds contain at least one instance of triple chelation from a terminal carboxylate, the central carboxylate, and the hydroxyl group of a citrate.
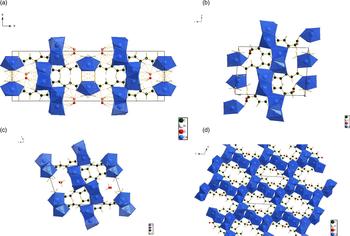
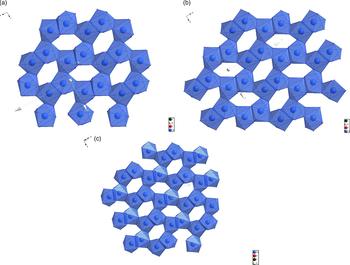
The four crystal structures are illustrated in Figures 4(a)–4(d). A prominent feature of the hexahydrate and tetrahydrate structures is a layer of edge-sharing Ca coordination polyhedra [Figures 5(a)—5(c)]. Superposition of these layers shows that they are very similar, if not identical. The Ca which is coordinated by the water molecules is isolated from these layers. The persistence of the layers suggests that the mechanisms of dehydration and polymorph conversion involve the non-layer Ca and the water molecules. The same layer is present in the ISEQIH structure. The structure of anhydrous calcium citrate is a three-dimensional network of edge-sharing Ca coordination polyhedra [Figure 4(d)]; apparently, the layers have condensed, also involving the isolated Ca in the framework.
(Colour online) (a) The DFT-optimized crystal structure of calcium citrate hexahydrate, viewed down the c-axis. (b) The DFT-optimized crystal structure of the new polymorph of calcium citrate tetrahydrate, viewed down the a-axis. (c) The DFT-optimized crystal structure of the ISEQIH polymorph of calcium citrate tetrahydrate, viewed down the a-axis. (d) The DFT-optimized crystal structure of anhydrous calcium citrate, viewed down the a-axis.

(Colour online) (a) The edge-sharing layer in calcium citrate hexahydrate. (b) The edge-sharing layer in the new polymorph of calcium citrate tetrahydrate. (c) The edge-sharing layer in the ISEQIH polymorph of calcium citrate tetrahydrate.

Analysis of the contributions to the total crystal energy using the Forcite module of Materials Studio (Dassault, 2014) suggests that bond distance, angle, and torsion distortion terms are small contributions to the intramolecular deformation energy. The intermolecular energy is dominated by electrostatic attractions, which in this force-field-based analysis include hydrogen bonds. The hydrogen bonds are better analyzed using the results of the DFT calculations.
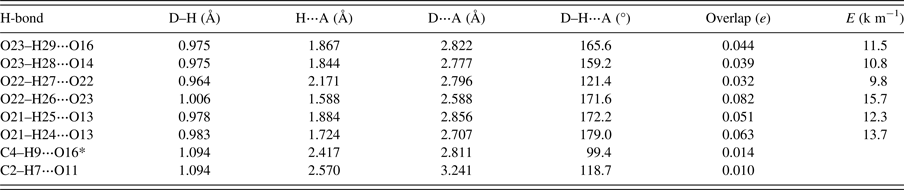
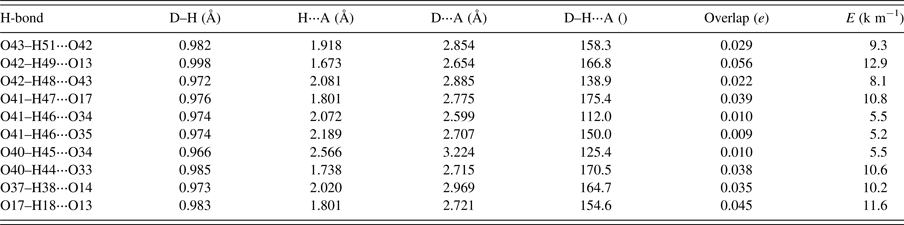
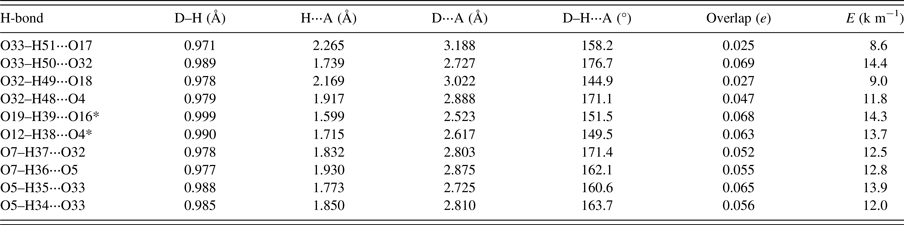
As expected, hydrogen bonds are important in the structures of the hydrated compounds (Tables II, III, and IV). Almost all of the water molecules act as hydrogen bond donors. Only the H51 hydrogen atom in the current tetrahydrate does not participate in an O–H⋅⋅⋅O hydrogen bond. It does, however, seem to participate in two bonding interactions to H10 and C4 (Mulliken overlap populations 0.021 and 0.013 electrons, respectively). Hydrogen bonding is naturally less important in anhydrous calcium citrate (Table V), in which the hydroxyl groups form intermolecular hydrogen bonds and some weak C–H⋅⋅⋅O hydrogen bonds contribute to the crystal energy.
Hydrogen bonds (CRYSTAL14) in the crystal structure of Ca3(C6H5O7)2(H2O)6.

*Intramolecular.
Hydrogen bonds (CRYSTAL14) in the crystal structure of the new polymorph of Ca3(C6H5O7)2(H2O)4.

Hydrogen bonds (CRYSTAL09) in the crystal structure of the ISEQIH polymorph of Ca3(C6H5O7)2(H2O)4.

*Intramolecular.
Hydrogen bonds (CRYSTAL14) in the crystal structure of Ca3(C6H5O7)2.

The Bravais–Friedel–Donnay–Harker (Bravais, Reference Bravais1866; Friedel, Reference Friedel1907; Donnay and Harker, Reference Donnay and Harker1937; calculated in Mercury) morphology suggests that we might expect platy morphology for all of these compounds, as expected from the layered nature of the structures. The principal faces are expected to be {200}, {001}, {001}, and {001} for the hexahydrate, the two polymorphs of tetrahydrate, and anhydrous calcium citrate respectively. Packing the capillary with the new tetrahydrate required much more tamping than for the hexahydrate and anhydrous material, so the observed larger degree of texture in the new pattern is reasonable.
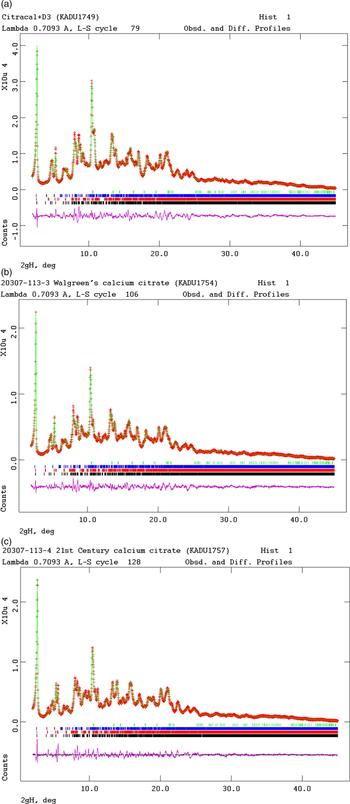
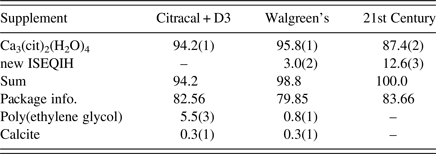
Knowledge of the crystal structure of the major polymorph of calcium citrate tetrahydrate permits determination of the relative concentrations of the crystalline components of the commercial supplements by the Rietveld method (Table VI and Figure 6). Two of the three supplements contain both polymorphs, with ISEQIH as a minor component. The Citracal + D3 also contains small concentrations of poly(ethylene glycol) (PEG) and calcite. It is worth noting that the PEG pattern is included only in the most-recent release of the Powder Diffraction File, providing a strong reason to update the database annually. The information on the packages (combined with the weights of the tablets) suggests that the calcium citrate tetrahydrate concentration in the tablets is ~80 wt%. The labels indicate that the tablets contain additional compounds, most of which are expected to be amorphous: microcrystalline cellulose, cholecalciferol, croscarmellose sodium, dl-α-tocopherol, gum arabic, hydroxypropylmethylcellulose, magnesium silicate, stearic acid, magnesium stearate, maltodextrin, medium chain triglycerides, polydextrose, poly(vinyl alcohol), oligofructose-enriched inulin, polyvinylpyrrolidone, propylene glycol dicaprylate/dicaprate, silicon dioxide, titanium dioxide, talc, sodium ascorbate, starch, sucrose, sunflower oil, tricalcium phosphate, polysorbate, and vitamin D3. Using the gravimetric concentrations of calcium citrate tetrahydrate, we can re-scale the apparent concentrations of the crystalline components, and determine the total concentration of amorphous species in these tablets.
(Colour online) Rietveld plots for the refinement of three commercial calcium citrate supplements. The red crosses represent the observed data points, and the green line is the calculated pattern. The magenta curve is the difference pattern, plotted at the same vertical scale as the other patterns. The row of black tick marks indicates the calculated reflection positions for the new form, the red tick marks indicate peaks for the known ISEQIH structure, the blue tick marks indicate positions for poly(ethylene glycol) (CSD Refcode LILYOU01, and the green tick marks indicate the peaks for calcite. (A) Citracal + D3. (B) Walgreen's calcium citrate. (C) 21st Century calcium citrate.

Quantitative analysis of commercial calcium citrate supplements. The concentrations are relative concentrations of the crystalline components, determined by Rietveld refinements.

SUPPLEMENTARY MATERIAL
The supplementary material for this article can be found at https://doi.org/10.1017/S0885715618000283
ACKNOWLEDGEMENTS
Use of the Advanced Photon Source at Argonne National Laboratory was supported by the U. S. Department of Energy, Office of Science, Office of Basic Energy Sciences, under Contract No. DE-AC02-06CH11357. I thank Lynn Ribaud and Saul Lapidus for their assistance in data collection, Andrey Rogachev for the use of computing resources at IIT, and Jose Orozco at IIT for TGA.