1. Introduction
Between the Cambrian bioradiation and the Great Ordovician Biodiversification Event, recurrent mass extinction and recovery events may have occurred during the Cambrian Furongian Epoch to Middle Ordovician time (Bambach, Knoll & Wang, Reference Bambach, Knoll and Wang2004; Kouchinsky et al. Reference Kouchinsky, Bengtson, Gallet, Korovnikov, Pavlov, Runnegar, Shields, Veizer, Young and Ziegler2008). Coincident with the biological events, a series of large-scale carbon isotope excursions have been reported, indicating drastic changes in the global carbon cycle and marine environment (Saltzman et al. Reference Saltzman, Brasier, Ripperdan, Ergaliev, Lohmann, Robison, Chang, Peng and Runnegar2000, Reference Saltzman, Edwards, Adrain and Westrop2015; Shen & Schidlowski, Reference Shen and Schidlowski2000; Maloof et al. Reference Maloof, Porter, Moore, Dudás, Bowring, Higgins, Fike and Eddy2010; Gill et al. Reference Gill, Lyons, Young, Kump, Knoll and Saltzman2011). For example, environmental changes such as oceanic redox conditions and sea level changes were thought to have influenced the extinction and recovery events around the Cambrian Furongian Epoch (Gill et al. Reference Gill, Lyons, Young, Kump, Knoll and Saltzman2011; Saltzman et al. Reference Saltzman, Young, Kump, Gill, Lyons and Runnegar2011), though the global significance of these hypotheses remains to be tested. The provisional Stage 10 (the uppermost stage of the Cambrian), as a transient period from the upper Cambrian to Ordovician, may play a critical role in exploring the palaeoenvironmental evolution from Cambrian to Ordovician times. In the past decades, biostratigraphic, lithological and geochemical studies of Stage 10 worldwide have been carried out (Ripperdan et al. Reference Ripperdan, Magaritz, Nicoll and Shergold1992; Peng & Babcock, Reference Peng and Babcock2005; Lazarenko et al. Reference Lazarenko, Gogin, Pegel, Sukhov, Abaimova, Egorova, Fedorov, Raevskaya, Ushatinskaya, Rozanov and Varlamov2008a ,Reference Lazarenko, Pegel, Sukhov, Abaimova, Gogin and Budnikov b , Reference Lazarenko, Gogin, Pegel and Abaimova2011; Landing, Westrop & Adrain, Reference Landing, Westrop and Adrain2011; Terfelt, Ahlberg & Eriksson, Reference Terfelt, Ahlberg and Eriksson2011; Peng, Babcock & Ahlberg, Reference Peng, Babcock and Ahlberg2012; Peng, Babcock & Cooper, Reference Peng, Babcock, Cooper, Gradstein, Ogg, Schmitz and Ogg2012; Miller et al. Reference Miller, Ripperdan, Loch, Freeman, Evans, Taylor and Tolbart2015b ). However, the base of Stage 10 is still to be defined. The International Subcommission on Cambrian Stratigraphy (ISCS) favours marking the base at a level coinciding with the First Appearance Datum (FAD) of the cosmopolitan agnostoid trilobite Lotagnostus americanus (Billings, Reference Billings1860). However, it was also proposed that the conodont Eoconodontus notchpeakensis FAD ± onset of the HEllnmaria–Red Tops Boundary (HERB) δ13C excursion can be used to define the base of Stage 10 (Landing, Westrop & Adrain, Reference Landing, Westrop and Adrain2011; Miller et al. Reference Miller, Evans, Freeman, Ripperdan and Taylor2011).
The Wa'ergang section in South China is one of the most continuous successions spanning the Cambrian Furongian Series (Peng, Reference Peng1990a ,Reference Peng b , Reference Peng1992; Lin, Reference Lin1991; Peng et al. Reference Peng, Babcock, Lin and Chen2001, Reference Peng, Babcock, Zhu, Zuo and Dai2014). Studies on lithology and biostratigraphy have been intensely performed on the Wa'ergang section (Peng, Reference Peng1984, Reference Peng1987, Reference Peng1990a , Reference Peng1992; Lin, Reference Lin1991; Peng et al. Reference Peng, Babcock, Lin and Chen2001). Importantly, the FAD of Lotagnostus americanus was discovered at 29.65 m above the base of the Shenjiawan Formation, which may provide an ideal opportunity to define the Global Stratotype Section and Point (GSSP) for the base of Stage 10 (Peng et al. Reference Peng, Babcock, Zhu, Zuo and Dai2014). Here, we present high-resolution carbon and oxygen isotope data for the Shenjiawan Formation in the Wa'ergang section. High-resolution C-isotope chemostratigraphic correlations provide valuable insights for defining the base of Stage 10. Using numerical simulations against the C-isotopic record, we will discuss the implications of C-isotopic excursions for understanding palaeoenvironmental change.
2. Geological setting
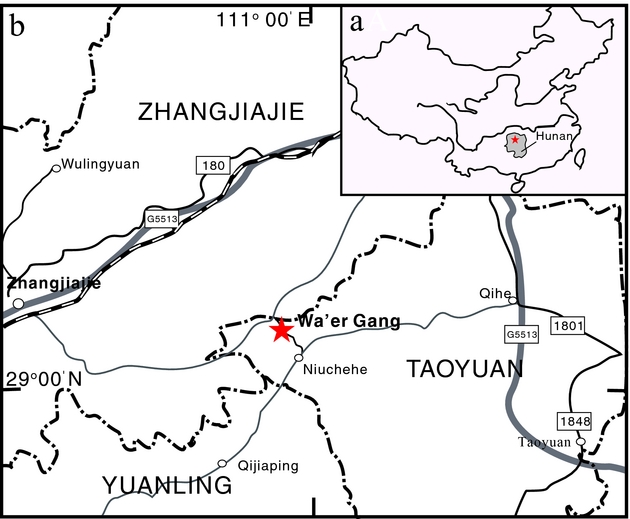
The Wa'ergang section is located in Taoyuan, northwestern Hunan Province, South China and comprises the Huaqiao and Shenjiawan formations (Peng et al. Reference Peng, Babcock, Lin and Chen2001) (Fig. 1). During late Cambrian time, the Wa'ergang section was situated in the Jiangnan Slope Belt of South China. The section constitutes a thick carbonate sequence of middle Cambrian – Early Ordovician age (Peng, Reference Peng1987, Reference Peng1990b ). The upper Wa'ergang section is dominated by dark-coloured, deep-water laminated argillaceous limestone more than 200 m in thickness (Fig. 2). The lithology, taxonomy of the Furongian trilobites and biostratigraphy of the Wa'ergang section have been well documented (Peng, Reference Peng1984, Reference Peng1987, Reference Peng1990a , Reference Peng1992; Lin, Reference Lin1991; Peng et al. Reference Peng, Babcock, Lin and Chen2001). Sedimentary and lithofacies evolution of the Wa'ergang section suggests that the strata of the uppermost Cambrian stage (Stage 10) were deposited on the lower part of an ocean-facing continental slope (Lin, Reference Lin1991).
The location of the Wa'ergang section in South China (revised from Peng et al. Reference Peng, Babcock, Zhu, Zuo and Dai2014).

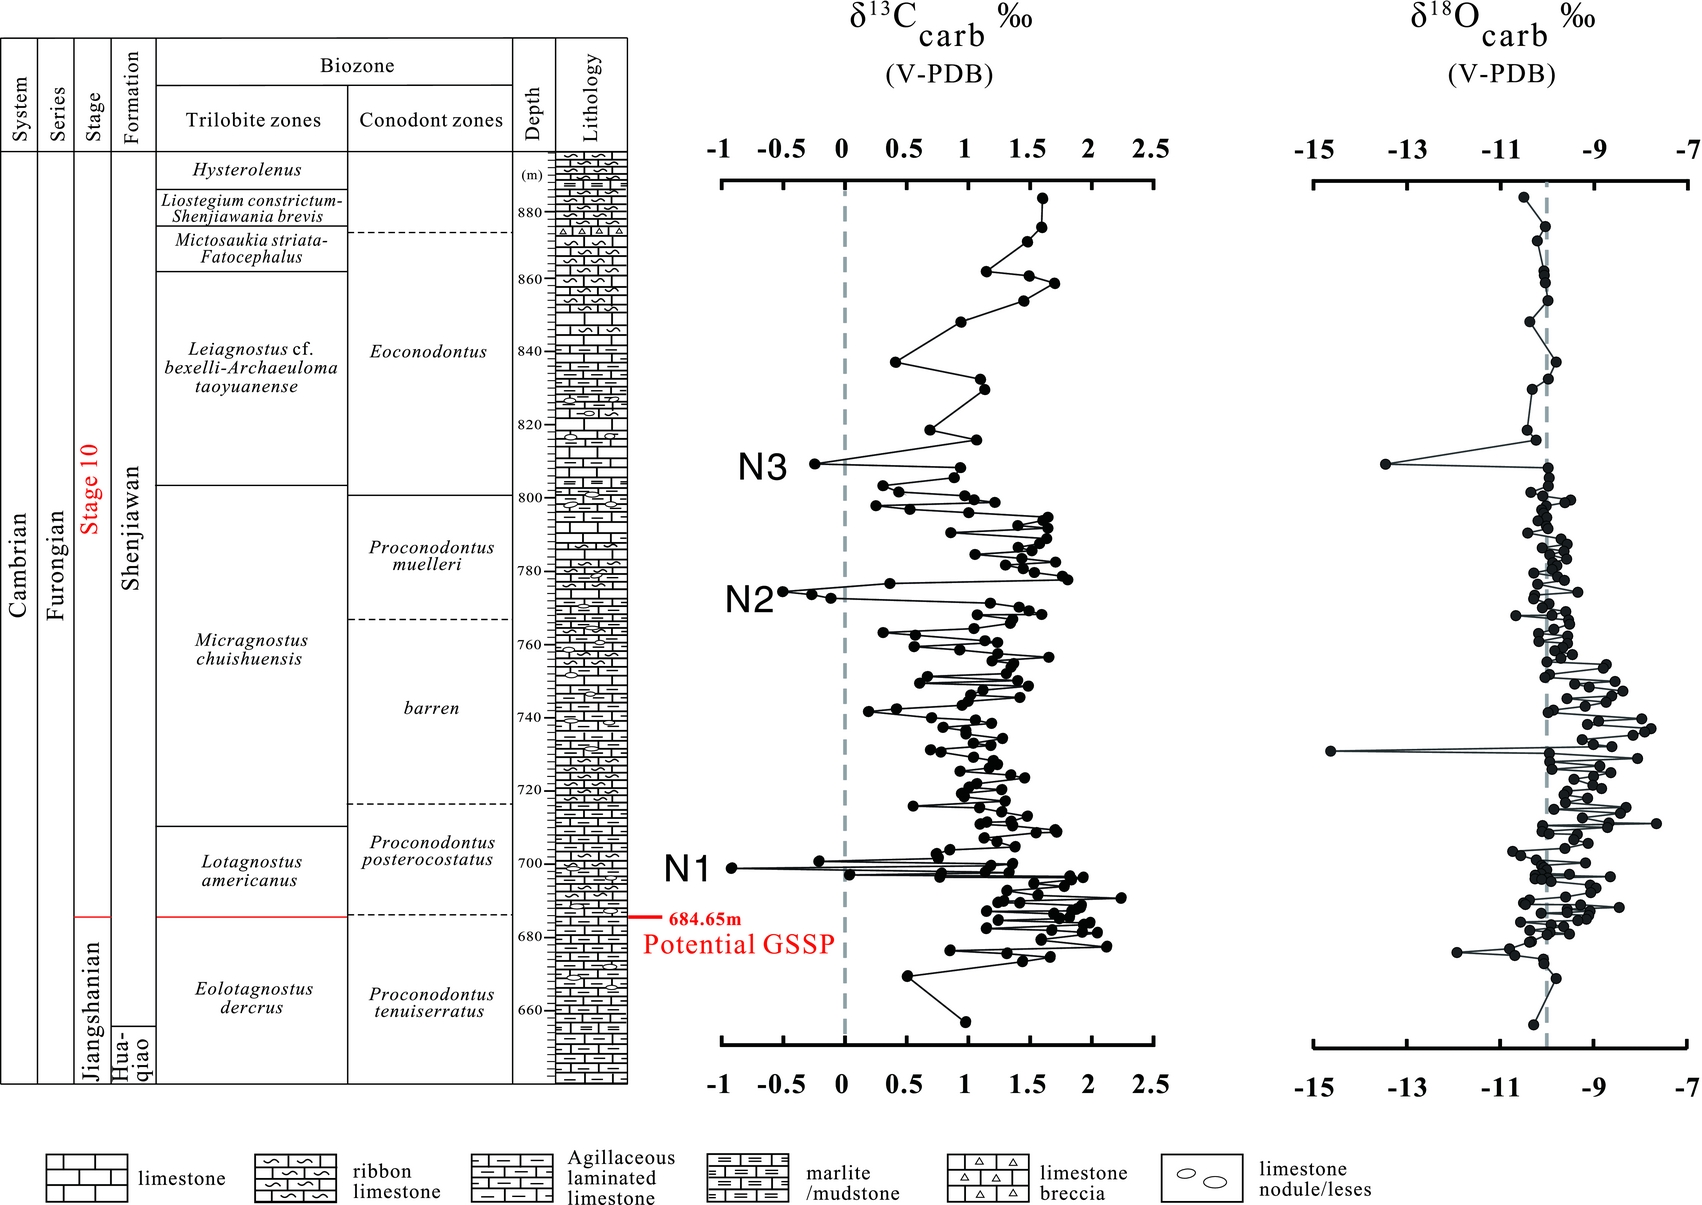
δ13C and δ18O stratigraphy for the Wa'ergang section in South China. Biozone data are from Peng (Reference Peng1990a , Reference Peng1992), Peng et al. (Reference Peng, Babcock, Zhu, Ahlberg, Terfelt and Dai2015) and Bagnoli et al. (Reference Bagnoli, Peng, Qi and Wang2017).

The trilobite and conodont zones of the Wa'ergang section have been well established (Fig. 2). The trilobite zones consist of, in ascending order, the Eolotagnostus decorus Zone, Lotagnostus americanus Zone, Micragnostus chuishuensis Zone, Leiagnostus cf. bexelli – Archaeuloma taoyuanense Zone, Mictosaukia striata – Fatocephalus Zone, Leiostegium constrictum – Shenjiawania brevis Zone and Hysterolenus Zone. The conodont zones comprise the Proconodontus tenuiserratus Zone, Proconodontus posterocostatus Zone, Proconodontus muelleri Zone and Eoconodontus Zone, in ascending order (Fig. 2). The FAD of L. americanus, an accepted marker by the ISCS for defining the base of Stage 10, was identified 29.65 m above the base of the Shenjiawan Formation at Wa'ergang, South China (Peng et al. Reference Peng, Babcock, Zhu, Zuo and Dai2014, Reference Peng, Babcock, Zhu, Ahlberg, Terfelt and Dai2015) (Fig. 2). Detailed global biostratigraphic correlation suggests that the Wa'ergang section has strong potential as a candidate for defining the GSSP marking the base of Stage 10 (Peng et al. Reference Peng, Babcock, Zhu, Zuo and Dai2014). Based on the biostratigraphic framework of the Wa'ergang section, we performed high-resolution C-isotope analyses that may help in the definition of Stage 10 as well as understanding palaeoenvironmental change during Stage 10 in South China.
3. Material and methods
A total of 161 limestone samples were collected from the Shenjiawan Formation of the Wa'ergang section. Fresh, relatively unweathered, fine-grained carbonate rock samples avoiding fractures and recrystallized portions were ground to powder (< 200 mesh). Approximately 150 μg of sample powder was reacted with 102–105% phosphoric acid at 70°C in a Kiel IV carbonate device for 12 min to generate CO2 gas. After cryogenic cleaning, the extracted CO2 gas was measured on a ThermoFinnigan MAT 253 Mass Spectrometer. Accuracy and precision were monitored by replicate analysis of a domestic carbonate standard (GBW04416) for every nine samples. The carbon (δ13C) and oxygen (δ18O) isotope ratios for carbonate are expressed as per mil (‰) deviations relative to the Vienna-PeeDee Belemnite (V-PDB) in the standard delta notation. Average external precision is estimated to be better than 0.02‰ for δ13C and 0.06‰ for δ18O.
4. Results
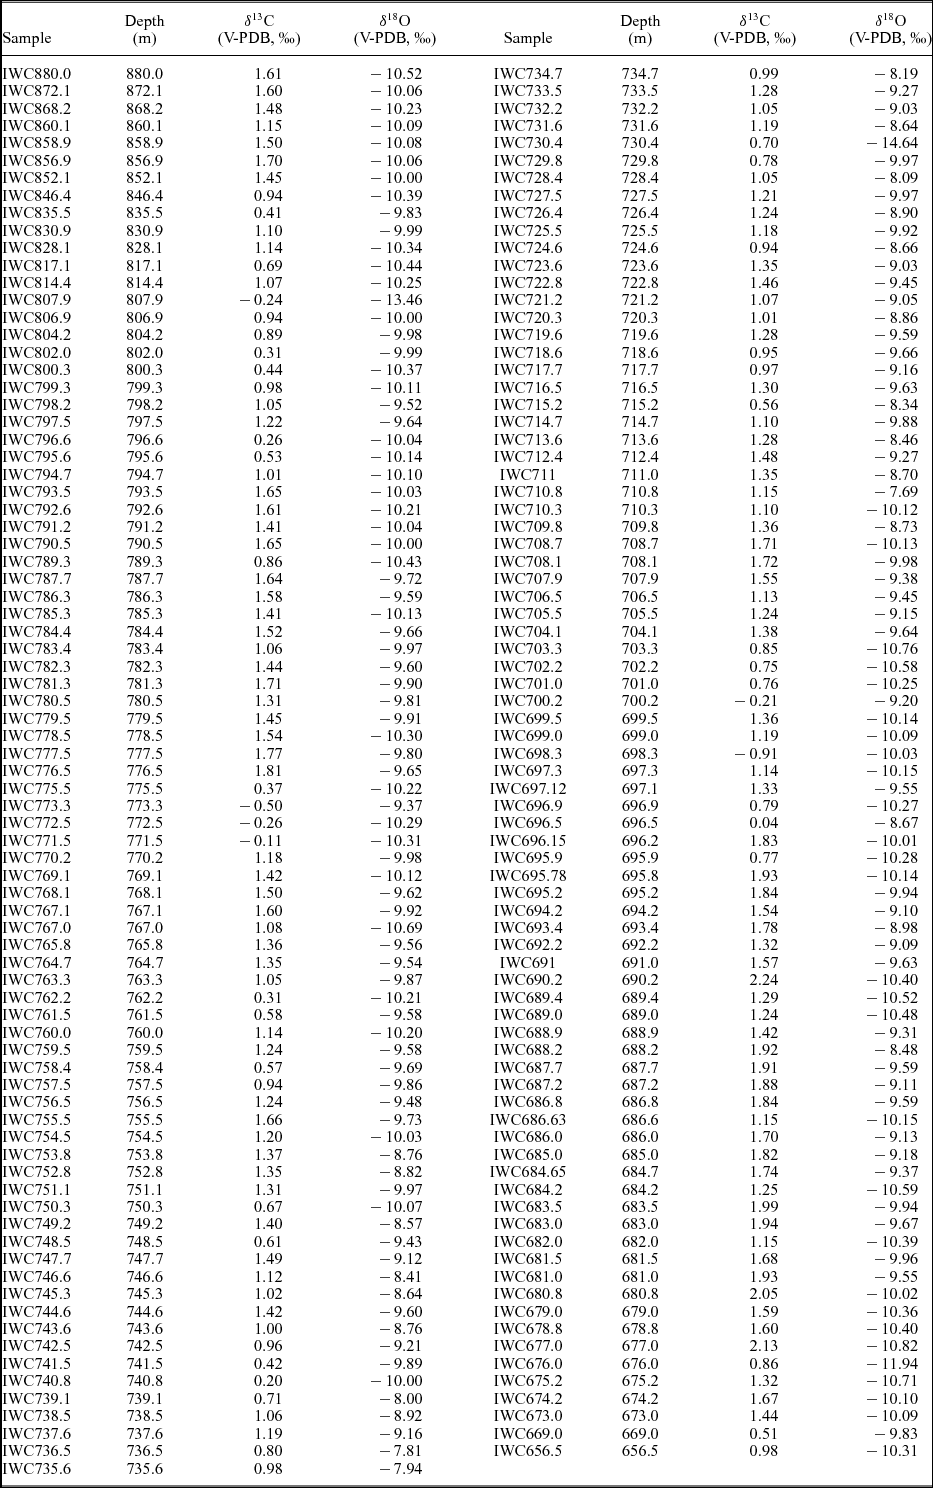
High-resolution δ13C and δ18O data for carbonates from the upper Jiangshanian Stage to Stage 10 at Wa'ergang are presented in Table 1 and Figure 2. The δ13C values range from −0.9‰ to 2.2‰, and the δ18O values vary between −14.6‰ and −7.7‰ (Fig. 2). Three significant negative δ13C excursions, namely N1, N2 and N3, were observed in the Shenjiawan Formation (Fig. 2). The negative δ13C excursion N1 from 1.9‰ to −0.9‰ is located just above the FAD of L. americanus, corresponding to the possible base of the Proconodontus posterocostatus conodont Zone (Fig. 2). The negative δ13C excursion N2 from 1.8‰ to −0.5‰ is identified within the Micragnostus chuishuensis trilobite Zone or Proconodontus muelleri conodont Zone (Fig. 2). The negative δ13C excursion N3 from 1.7‰ to −0.2‰ is displayed at the lowermost part of the Leiagnostus cf. bexelli – Archaeuloma taoyuanense trilobite Zone and Eoconodontus conodont Zone.
δ13C and δ18O of samples from the Wa'ergang section, Hunan, SW China

5. Discussion
5.a. Analysis of diagenetic alteration
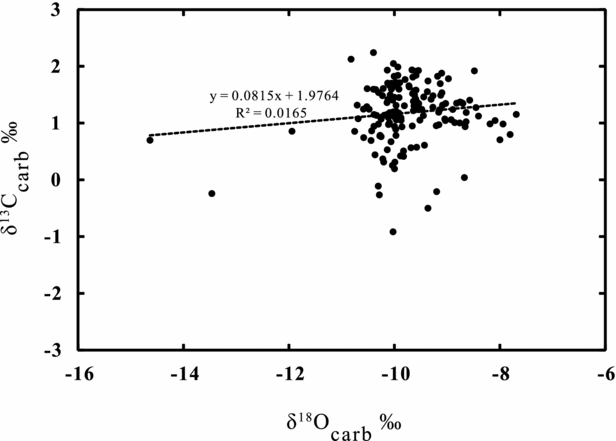
Carbonates precipitated in equilibrium with seawater can preserve carbon isotopic signals close to the composition of marine Dissolved Inorganic Carbon (DIC). However, previous studies have shown that post-depositional diagenetic processes can alter the primary isotopic signal, making the interpretation of carbon and oxygen isotope data problematic (e.g. Allan & Matthews, Reference Allan and Matthews1982). Diagenetic processes, especially meteoric water alteration, can cause δ13C and δ18O depletion synchronously (e.g. Bathurst, Reference Bathurst1975). However, δ18O values of carbonate are more sensitive to post-deposition diagenesis than δ13C. It has been shown that though diagenesis can cause remarkable δ18O depletion by oxygen exchange with pore water or meteoric water, δ13C usually remains unchanged because late diagenesis of carbonate occurs in a closed system for carbon (Holser, Reference Holser1997). The δ18O values of the Wa'ergang section show little fluctuation and are mostly between −9‰ and −10‰, though three samples show extremely low δ18O values (IWC676.0, IWC730.4 and IWC807.9) (Table 1; Fig. 3). Also, isotopic data in the cross-plot of δ13C and δ18O is quite discrete (R2 = 0.0165) and no positive correlation between δ13C and δ18O was observed (Fig. 3). These observations imply that the δ13C data from the Wa'ergang section may have experienced little alteration by post-depositional diagenesis. Therefore, the δ13C values of carbonates from the Wa'ergang section represent primary δ13C compositions of seawater.
Cross-plot of δ18O and δ13C for the Wa'ergang section.

5.b. Global C-isotope chemostratigraphic correlations
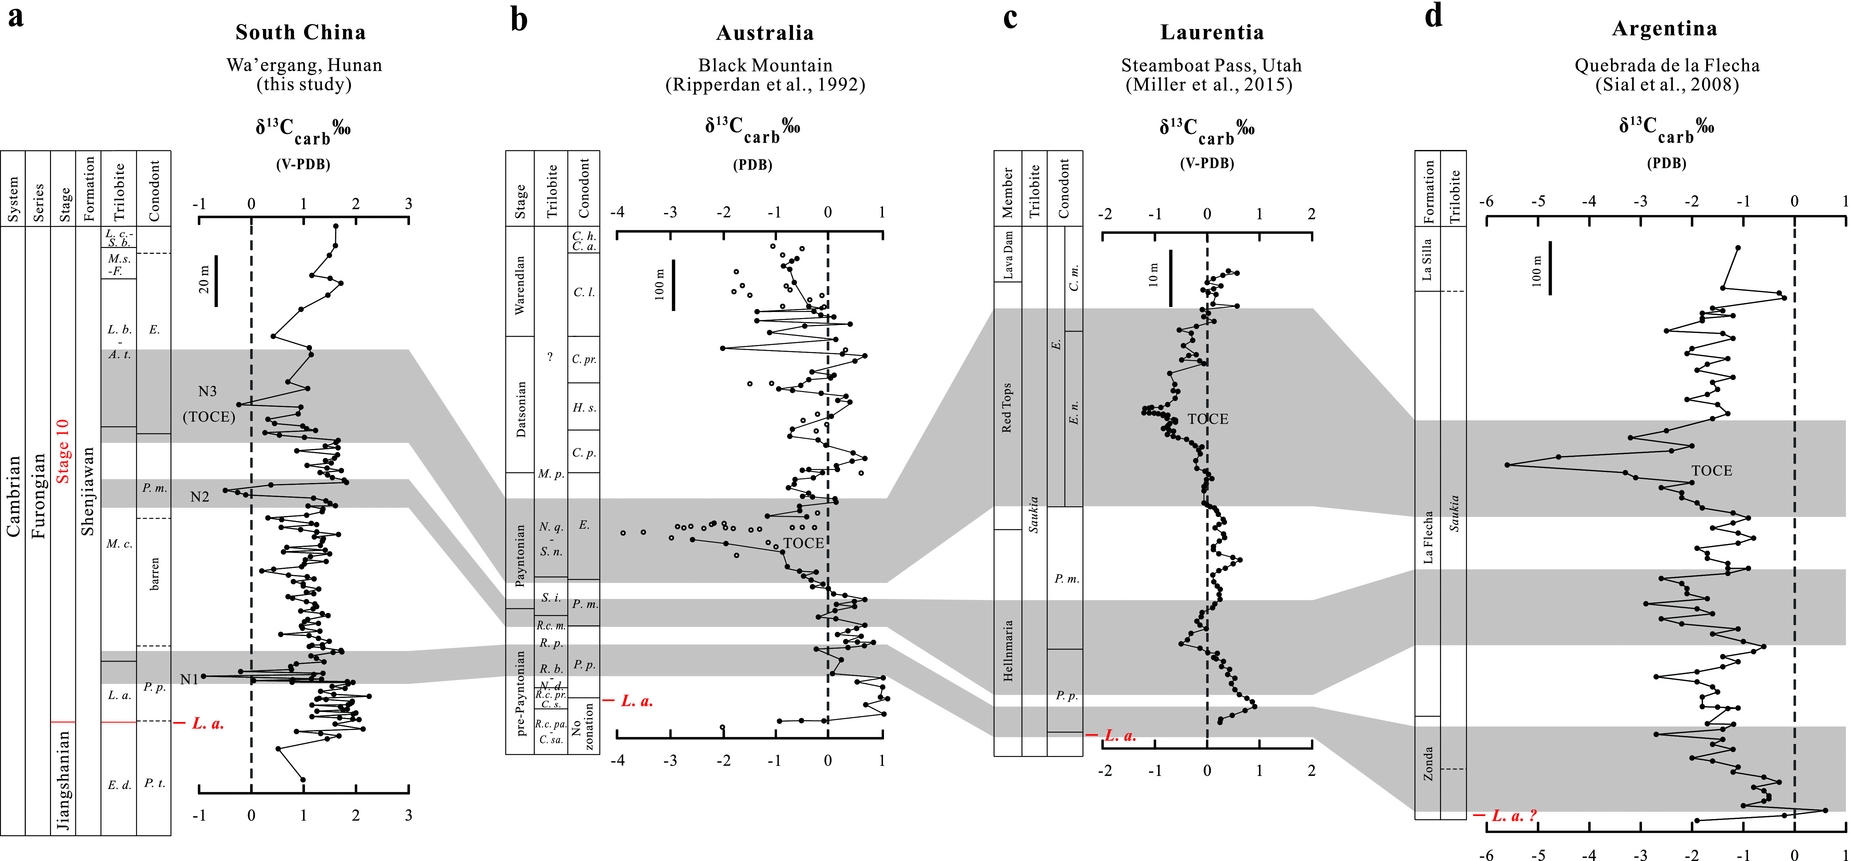
High-resolution C-isotope analyses reveal three negative δ13C excursions of N1, N2 and N3 within Stage 10 in the Wa'ergang section (Fig. 2). Integrated with trilobite and conodont biostratigraphy (e.g. Lazarenko et al. Reference Lazarenko, Gogin, Pegel and Abaimova2011; Peng, Babcock & Cooper, Reference Peng, Babcock, Cooper, Gradstein, Ogg, Schmitz and Ogg2012), the three negative δ13C excursions in the Wa'ergang section can be well correlated with the C-isotope excursions identified in the Black Mountain section of Australia (Ripperdan et al. Reference Ripperdan, Magaritz, Nicoll and Shergold1992; Miller et al. Reference Miller, Ethington, Evans, Holmer, Loch, Popov, Repetski, Ripperdan and Taylor2006), Steamboat Pass section of Utah, USA (Ripperdan & Miller, Reference Ripperdan, Miller, Cooper, Droser and Finney1995; Miller et al. Reference Miller, Ethington, Evans, Holmer, Loch, Popov, Repetski, Ripperdan and Taylor2006) and the Quebrada de la Flecha section of Argentina (Buggisch, Keller & Lehnert, Reference Buggisch, Keller and Lehnert2003; Sial et al. Reference Sial, Peralta, Ferreira, Toselli, Aceñolaza, Parada, Gaucher, Alonso and Pimentel2008, Reference Sial, Peralta, Gaucher, Toselli, Ferreira, Frei, Parada, Pimentel and Pereira2013) (Fig. 4).
Global correlation of the upper Cambrian of the Wa'ergang section. Trilobite zone: L. c. – S. b. — Leiostegium constrictum – Shenjiawania brevis; M. s. – F. — Mictosaukia striata – Fatocephalus; L. b. – A. t. — Leiagnostus cf. bexelli – Archaeuloma taoyuanense; M. c. — Micragnostus chuishuensis; L. a. — Lotagnostus americanus; E. d. — Eolotagnostus decorus; M. p. — Mictosaukia perplexa; N. q. – S. n. — Neoagnostus quasibilobus – Shergoldia nomas; S. i. — Sinosaukia impages; R.c. m. — Rhaptagnostus clarki maximus; R. p. — R. papilio; R. b. – N. d. — R. bifax – N. denticulatus; R.c. pr. — R. clarki prolatus; C. s. — Caznaia sectatrix; R.c. pa. – C. sa. — R. clarki patulus – Caznaia squamosa. Conodont Zone: E. — Eoconodontus; C. m. — Cambrooistodus minutus Subzone; E. n. — Eoconodontus notchpeakensis Subzone; P. m. — Proconodontus muelleri; P. p. — Proconodontus posterocostatus; P. t. — Proconodontus tenuiserratus; C. h. — Chosonodina herfurthi; C. a. — Cordylodus angulatus; C. l. — Cordylodus lindstromi s.s.; C. pr. — Cordylodus prolindstromi; H. s. — Hirsutodontus simplex; C. p. — Cordylodus proavus.

The N1 is observed within the L. americanus trilobite Zone and Proconodontus posterocostatus conodont Zone in the Wa'ergang section (Fig. 4a). The δ13C value rapidly decreases from 1.9‰ to −0.9‰ and returns to the value of 1.7‰ (Fig. 4a). This negative δ13C excursion can be well correlated to that of c. 1‰ in magnitude within the Proconodontus posterocostatus conodont Zone in Australia (Ripperdan et al. Reference Ripperdan, Magaritz, Nicoll and Shergold1992) (Fig. 4b) and the negative δ13C excursion of c. 2‰ in the lowermost part of the Saukia trilobite Zone in Argentina (Shergold, Bordonaro & Liñán, Reference Shergold, Bordonaro and Liñán1995; Buggisch, Keller & Lehnert, Reference Buggisch, Keller and Lehnert2003; Finney, Reference Finney2007; Sial et al. Reference Sial, Peralta, Ferreira, Toselli, Aceñolaza, Parada, Gaucher, Alonso and Pimentel2008, Reference Sial, Peralta, Gaucher, Toselli, Ferreira, Frei, Parada, Pimentel and Pereira2013) (Fig. 4d).
The N2 occurs in the Proconodontus muelleri conodont Zone, coincident with the upper part of the Micragnostus chuishuensis trilobite Zone in the Wa'ergang section (Fig. 4a). The δ13C value rapidly decreases from 1.6‰ to −0.5‰ and returns to the baseline value of 1.8‰ (Fig. 4a). The N2 can be correlated to the negative δ13C excursion of c. 1.0‰ which is within the Proconodontus muelleri conodont Zone and near the base of the Sinosaukia impages trilobite Zone in Australia (Fig. 4b). The N2 can also be correlated to the sharp negative δ13C excursion of 2.3‰ near the base of the Proconodontus muelleri conodont Zone and the lower part of the Saukia trilobite Zone in Laurentia (Fig. 4c), and to that in the lower part of the Saukia trilobite Zone in Argentina (Ripperdan et al. Reference Ripperdan, Magaritz, Nicoll and Shergold1992; Buggisch, Keller & Lehnert, Reference Buggisch, Keller and Lehnert2003; Sial et al. Reference Sial, Peralta, Ferreira, Toselli, Aceñolaza, Parada, Gaucher, Alonso and Pimentel2008, Reference Sial, Peralta, Gaucher, Toselli, Ferreira, Frei, Parada, Pimentel and Pereira2013; Miller et al. Reference Miller, Ripperdan, Loch, Freeman, Evans, Taylor and Tolbart2015b ) (Fig. 4d).
The N3 is located in the lowermost part of the Eoconodontus conodont Zone and the lower part of the Leiagnostus cf. bexelli – Archaeuloma taoyuanense trilobite Zone in the Wa'ergang section (Fig. 4a). The δ13C value decreases from 1.7‰ to −0.2‰ and returns to the pre-excursion value of 1.1‰ (Fig. 4a). The N3 can be correlated with the TOCE or HERB within the Eoconodontus notchpeakensis conodont Zone and/or the upper Saukia trilobite Zone in Australia, Laurentia and Argentina (Ripperdan et al. Reference Ripperdan, Magaritz, Nicoll and Shergold1992; Buggisch, Keller & Lehnert, Reference Buggisch, Keller and Lehnert2003; Jing et al. Reference Jing, Deng, Zhao, Lu and Zhang2008; Kouchinsky et al. Reference Kouchinsky, Bengtson, Gallet, Korovnikov, Pavlov, Runnegar, Shields, Veizer, Young and Ziegler2008; Sial et al. Reference Sial, Peralta, Ferreira, Toselli, Aceñolaza, Parada, Gaucher, Alonso and Pimentel2008, Reference Sial, Peralta, Gaucher, Toselli, Ferreira, Frei, Parada, Pimentel and Pereira2013; Miller et al. Reference Miller, Ripperdan, Loch, Freeman, Evans, Taylor and Tolbart2015b ) (Fig. 4). The TOCE and HERB events are equivalent to the upper part of Stage 10, though Landing, Westrop & Adrain (Reference Landing, Westrop and Adrain2011) argued that the TOCE is younger, occurring at about the base of the Cordylodus proavus conodont Zone. However, this assertion has been challenged because no significant negative δ13C excursion has ever been identified in the Cordylodus proavus Zone in either Laurentia or Australia (Miller et al. Reference Miller, Ethington, Evans, Holmer, Loch, Popov, Repetski, Ripperdan and Taylor2006, Reference Miller, Evans, Freeman, Ripperdan and Taylor2011, Reference Miller, Evans, Ethington, Freeman, Loch, Popov, Repetski, Ripperdan and Taylor2015a ,Reference Miller, Ripperdan, Loch, Freeman, Evans, Taylor and Tolbart b ).
5.c. The definition for the base of Stage 10
The FAD of conodont Eoconodontus notchpeakensis has been proposed to be an alternative to defining the base of the provisional Stage 10 (Landing, Westrop & Adrain, Reference Landing, Westrop and Adrain2011; Miller et al. Reference Miller, Evans, Freeman, Ripperdan and Taylor2011). However, E. notchpeakensis is a long-ranging species, extending from the base of the Eoconodontus Zone to the Lower Ordovician (Miller, Reference Miller1969; Dong, Repetski & Bergström, Reference Dong, Repetski and Bergström2004; Miller et al. Reference Miller, Evans, Freeman, Ripperdan and Taylor2011; Peng et al. Reference Peng, Babcock, Zhu, Zuo and Dai2014). In contrast, L. americanus, with a distinctive morphology, has a relatively narrow stratigraphic range but wide geographic distribution in open-shelf lithofacies worldwide. Also, the co-occurrence of L. americanus and the widely distributed Hedinaspis regalis and Charchaqia norini, as well as the status in synonym with L. trisectus, L. asiaticus and L. punctatus, facilitates global biostratigraphic correlation with L. americanus (Taylor & Cook, Reference Taylor and Cook1976; Lu & Lin, Reference Lu and Lin1984; Peng & Babcock, Reference Peng and Babcock2005; Peng et al. Reference Peng, Babcock, Zhu, Zuo and Dai2014, Reference Peng, Babcock, Zhu, Ahlberg, Terfelt and Dai2015).
The FAD of L. americanus occurs about two-thirds of the way up from the base of the Furongian (Babcock et al. Reference Babcock, Ahlberg, Peng, Terfelt and Eriksson2012) and has been reported worldwide, including Canada, USA, Argentina, Australia, China, Kazakhstan, Uzbekistan, western Newfoundland, UK (England and Wales), Siberia and Sweden (Ergaliev, Reference Ergaliev, Apollonov, Bandeletov and Ivshin1983; Lu & Lin, Reference Lu and Lin1984, Reference Lu and Lin1989; Xiang & Zhang, Reference Xiang and Zhang1985; Ludvigsen, Westrop & Kindle, Reference Ludvigsen, Westrop and Kindle1989; Peng, Reference Peng1992; Peng & Babcock, Reference Peng and Babcock2005; Lazarenko et al. Reference Lazarenko, Gogin, Pegel, Sukhov, Abaimova, Egorova, Fedorov, Raevskaya, Ushatinskaya, Rozanov and Varlamov2008a ,Reference Lazarenko, Pegel, Sukhov, Abaimova, Gogin and Budnikov b , Reference Lazarenko, Gogin, Pegel and Abaimova2011; Terfelt, et al. Reference Terfelt, Eriksson, Ahlberg and Babcock2008; Terfelt, Ahlberg & Eriksson, Reference Terfelt, Ahlberg and Eriksson2011; Westrop, Adrain & Landing, Reference Westrop, Adrain and Landing2011; Peng, Babcock & Cooper, Reference Peng, Babcock, Cooper, Gradstein, Ogg, Schmitz and Ogg2012; Peng et al. Reference Peng, Babcock, Zhu, Zuo and Dai2014, Reference Peng, Babcock, Zhu, Ahlberg, Terfelt and Dai2015). Therefore, it has been proposed that the FAD of L. americanus may represent the best level for defining the base of the provisional Stage 10 (Peng & Babcock, Reference Peng and Babcock2005; Peng et al. Reference Peng, Babcock, Zhu, Zuo and Dai2014, Reference Peng, Babcock, Zhu, Ahlberg, Terfelt and Dai2015).
The HERB C-isotope excursion has been used as a complementary marker to define the base of Stage 10 based on the FAD of Eoconodontus notchpeakensis. This prominent negative δ13C excursion was first identified in the uppermost Chatsworth Limestone in the Black Mountain section (Ripperdan et al. Reference Ripperdan, Magaritz, Nicoll and Shergold1992). Correlative negative δ13C excursions with the HERB in the Black Mountain section have been reported elsewhere (e.g. Ripperdan & Miller, Reference Ripperdan, Miller, Cooper, Droser and Finney1995; Ripperdan, Reference Ripperdan2002), but it was later correlated with the TOCE (Peng, Babcock & Ahlberg, Reference Peng, Babcock and Ahlberg2012; Miller et al. Reference Miller, Ripperdan, Loch, Freeman, Evans, Taylor and Tolbart2015b ).
In the past decade, C-isotope profiles of the upper Cambrian from worldwide successions have been well characterized (e.g. Sial et al. Reference Sial, Peralta, Ferreira, Toselli, Aceñolaza, Parada, Gaucher, Alonso and Pimentel2008; Terfelt, Eriksson & Schmitz, Reference Terfelt, Eriksson and Schmitz2014). A few distinguished δ13C excursions such as the TOCE or HERB in the uppermost Cambrian have been reported from the Tarim Basin and Jilin Province, China (Ripperdan, Magarita & Kirschvink, Reference Ripperdan, Magarita and Kirschvink1993; Zhang, Wang & Li, Reference Zhang, Wang and Li2000; Jing et al. Reference Jing, Deng, Zhao, Lu and Zhang2008), Australia (Ripperdan et al. Reference Ripperdan, Magaritz, Nicoll and Shergold1992), western Utah and southern Nevada of the USA (Ripperdan & Miller, Reference Ripperdan, Miller, Cooper, Droser and Finney1995; Miller et al. Reference Miller, Ripperdan, Loch, Freeman, Evans, Taylor and Tolbart2015b ), northwest Siberia (Kouchinsky et al. Reference Kouchinsky, Bengtson, Gallet, Korovnikov, Pavlov, Runnegar, Shields, Veizer, Young and Ziegler2008) and Argentina (Buggisch, Keller & Lehnert, Reference Buggisch, Keller and Lehnert2003; Sial et al. Reference Sial, Peralta, Ferreira, Toselli, Aceñolaza, Parada, Gaucher, Alonso and Pimentel2008, Reference Sial, Peralta, Gaucher, Toselli, Ferreira, Frei, Parada, Pimentel and Pereira2013), among others. In this study, the detailed carbon isotope chemostratigraphic correlations reveal that N1 and N2 preceding the HERB or TOCE event can be well correlated worldwide when integrated with the trilobite and/or conodont biostratigraphy. Therefore, we suggest that the N1 might represent a significant C-isotope event following the Cambrian Steptoean Positive Carbon Isotope Excursion (SPICE) and reflects a dramatic change in the oceanic carbon cycle. More importantly, the N1 coincides with the base of the L. americanus Zone in the Wa'ergang section. Hence, we propose that the negative δ13C excursion N1 and the FAD of L. americanus can be integrated in defining the base of Stage 10.
5.d. Modelling the negative δ13C excursions
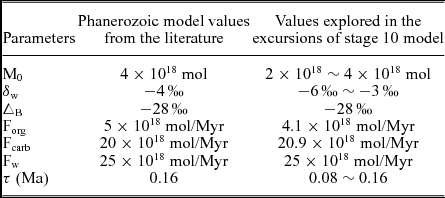
Our high-resolution C-isotopic data reveal three negative δ13C excursions that can be correlated globally and apparently require inputs of additional 13C-depleted carbon reservoirs (Figs 3, 4). In this study, we use a box model to quantify the inferred changes in the carbon cycle during Stage 10 and to explore the mechanism behind the negative δ13C excursions. A range of widely accepted estimates of the input and output fluxes and their isotopic compositions were used in our model (Table 2).
Fluxes and carbon isotope values from boundary parameters used in the model

For a change over time for δ13C of DIC in the ocean:
 $$\begin{equation}
\frac{{d{\delta _0}}}{{dt}} = \frac{{{F_w}({\delta _w} - {\delta _0}) - {F_{org}}{\Delta _B}}}{{{M_0}}}
\end{equation}$$
where M 0 is the mass of DIC in the ocean reservoir. Fw refers to the input fluxes of carbon from weathering (or other sources), and Forg represents outputs as organic carbon buried in sediment. δ w is the average δ13C of the input fluxes including the weathering of carbonate-mineral and ancient organic carbon (and/or oxygenation of oceanic organic carbon). δ0 is the C-isotopic composition of DIC. Δ B refers to the C-isotopic difference between the organic matter and carbonate.
The weathering inputs of carbon primarily include two sources: carbonate weathering and oxidation weathering of organic carbon. The δ13C of the whole weathering input can be calculated by a simple mass balance model:
 $$\begin{equation}
(1 - f) \times {\delta _{0\_w}} + f \times {\delta _{org\_w}} = {\delta _w}
\end{equation}$$
so,
 $$\begin{equation}
f = \frac{{{\delta _w} - {\delta _{0\_w}}}}{{{\delta _{org\_w}} - {\delta _{0\_w}}}}
\end{equation}$$
where f represents the fraction of organic carbon weathering (and/or oxygenation) contribution to the total carbon weathering flux. In this equation, the initial δ13C of weathering carbonate (
 ${\delta _{0\_w}}$
) equals the δ13C of DIC (δ0), which is assumed to be 1.5‰ (Kump & Arthur, Reference Kump and Arthur1999).
 ${\delta _{org\_w}}$
refers to the δ13C of oxidation weathering of organic carbon, which is supposed to be similar to that buried in sediments. Table 2 shows the isotopic compositions from boundary parameters used in the model.
As shown in Figure 5, our modelling results show that if the f in equation (3) increases by a factor of 1.7 resulting from the increase in organic carbon oxygenation, the input of δw would decrease from −3‰ to −6‰. As a result, negative δ13C excursions comparable to N1 and N2 can be produced (Fig. 5). Similarly, an increase in f in equation (3) by a factor of 1.5 would result in a δw decrease from −3 to −5.2‰. Consequently, a δ13C excursion comparable to N3 can be produced (Fig. 5).
Comparison between the δ13C record and the modelling result.

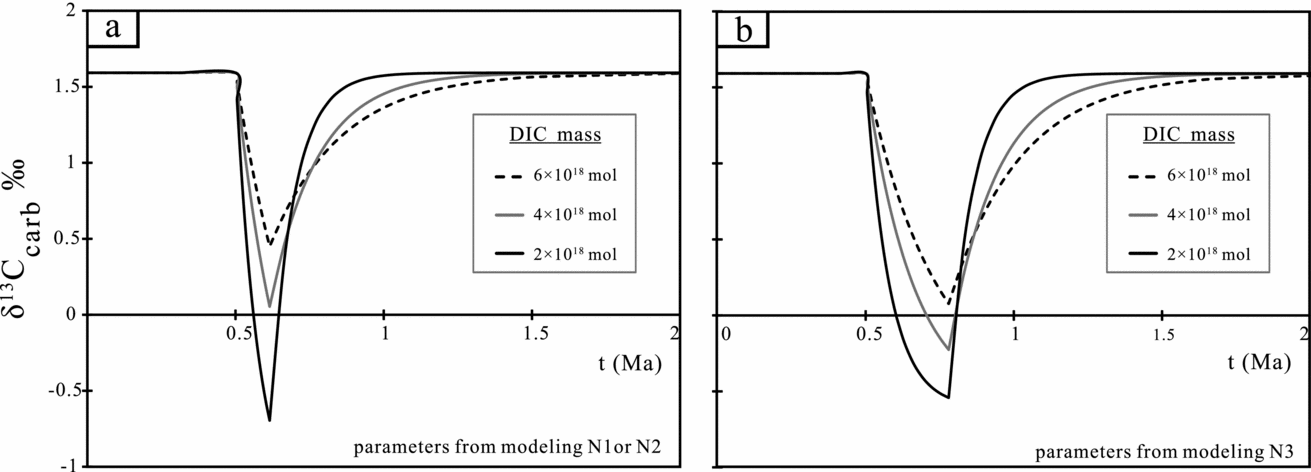
In addition, our modelling results can put quantitative constraints on the size of DIC mass associated with the negative δ13C excursions. Stage 10 is estimated to have lasted about 4.1 Ma (Peng, Babcock & Cooper, Reference Peng, Babcock, Cooper, Gradstein, Ogg, Schmitz and Ogg2012). Assuming a constant sedimentation rate for the Shenjiawan Formation, it would take about 0.25 Ma for the decrease and recovery of N1 or N2, and the decrease and recovery of N3 would take about 0.75 Ma (Fig. 5). Figure 6 shows our quantitative test on the relationships between the size of DIC mass and the nature of the δ13C excursion. It can be seen that an increase in size of DIC mass would decrease the magnitude of the δ13C excursion but increase the duration (i.e. the decrease and recovery) of the δ13C excursion (Fig. 6). For example, the decrease and recovery of N1 would take 0.8 Ma if 4×10¹⁸ mole of DIC mass in the modern ocean is applied, and it would take 1.5 Ma if 6×10¹⁸ mole for DIC mass is applied (Fig. 6a). Based on our calculations, 2×10¹⁸ mole of DIC would yield a negative δ13C excursion that is comparable to N1 or N2 in magnitude and duration (Fig. 6a). Similarly, 4×10¹⁸ mole of DIC mass would yield a negative δ13C excursion comparable to N3 lasting about 0.75 Ma (Fig. 6b). As such, our modelling results suggest that a smaller size of DIC mass in the ocean reservoir than that associated with N3 can produce N1 or N2 (Fig. 6).
A sensitivity test for the box model where the initial mass of marine DIC was varied. All other model parameters were held constant, with the exception of the influx of oxygenation of organic carbon, which we increased 1.7-fold for 0.12 Ma to simulate the N1 and/or N2 carbon excursion (a). Similarly, we increased it 1.5-fold for 0.28 Ma to simulate the N3 carbon excursion (b). The model result indicates that decreasing ocean DIC mass increases the magnitude of the excursion and decreases duration of the isotope recovery of the DIC reservoir.

5.e. Interpretation of the negative δ13C excursions
It has been shown that the TOCE (HERB) event near the Eoconodontus notchpeakensis Zone from Australia, Newfoundland and western North America coincides with sea level fall (Ripperdan et al. Reference Ripperdan, Magaritz, Nicoll and Shergold1992; Miller, Reference Miller, Webby and Laurie1992; Taylor et al. Reference Taylor, Myrow, Ripperdan, Loch, Ethington, Nelson and Erslev2004; Miller et al. Reference Miller, Ethington, Evans, Holmer, Loch, Popov, Repetski, Ripperdan and Taylor2006; Peng et al. Reference Peng, Babcock, Zuo, Lin, Zhu, Yang, Qi, Gabriella and Wang2009). Dramatic sea level fall may also have occurred within the L. americanus Zone and the late Micragnostus chuishuensis Zone (Lehnert et al. Reference Lehnert, Miller, Leslie, Repetski and Ethington2005; Álvaro et al. Reference Álvaro, Ferretti, González-Gómez, Serpagli, Tortello, Vecoli and Vizcaïno2007; Peng et al. Reference Peng, Babcock, Zuo, Lin, Zhu, Yang, Qi, Gabriella and Wang2009; Babcock et al. Reference Babcock, Peng, Brett, Zhu, Ahlberg, Bevis and Robison2015). Integrated with our modelling results, the coincidence between sea level fall and the negative δ13C excursions shed light on the interpretation of the C-isotopic record at Wa'ergang.
Our modelling results show that the increased weathering of organic carbon and the decrease in δw can play a vital role in producing the carbon cycle perturbation events observed at Wa'ergang. The increase of f, the ratio between continental organic carbon weathering and total carbon weathering flux, by a factor of 1.7 can produce N1 or N2, and by a factor of 1.5 can produce N3 (Fig. 5). We suggest that the sea level fall may have driven enhanced weathering of organic-rich sediments on the platform, contributing additional 13C-depleted carbon to the oceans. The sea level fall could also oxidize Dissolved Organic Carbon (DOC) in seawater because widespread anoxia was suggested to have persisted to the Cambrian Furongian Epoch, and the subsurface ocean was probably anoxic during Stage 10 (Gill et al. Reference Gill, Lyons, Young, Kump, Knoll and Saltzman2011; Saltzman et al. Reference Saltzman, Edwards, Adrain and Westrop2015). Additional 13C-depleted carbon from increased weathering and/or oxidation of DOC would decrease δw and yield the negative δ13C excursions seen in the Wa'ergang section.
As shown in Figure 4, there are differences in the absolute δ13C value and the magnitude of δ13C excursion among different basins, though they can be correlated. It has been hypothesized that the differences in δ13C excursions could be attributed to the spatial heterogeneity of oceanic redox conditions and different palaeogeographic environments (Ripperdan et al. Reference Ripperdan, Magaritz, Nicoll and Shergold1992; Sial et al. Reference Sial, Peralta, Ferreira, Toselli, Aceñolaza, Parada, Gaucher, Alonso and Pimentel2008; Peng et al. Reference Peng, Babcock, Zhu, Zuo and Dai2014; Miller et al. Reference Miller, Ripperdan, Loch, Freeman, Evans, Taylor and Tolbart2015b ). Alternatively, the non-steady state dynamics of the reactive DOC and DIC pools in Cambrian oceans could also contribute to the variations of δ13C in space and time (Rothman, Hayes & Summons, Reference Rothman, Hayes and Summons2003).
6. Summary
The measurements of δ13C for carbonate of the uppermost Cambrian stage (Stage 10) in the Wa'ergang section reveal three distinct negative δ13C excursions of N1, N2 and N3. Integrated with the trilobite and conodont biostratigraphy, the three negative δ13C excursions at Wa'ergang can be correlated globally. The identification of N1 just above the FAD of Lotagnostus americanus strongly supports that the base of Stage 10 may be best defined by the FAD of L. americanus. Consistent with our modelling results, sea level fall may have driven enhanced weathering of organic-carbon-rich sediments on the platform and/or oxygenation of the DOC reservoir, resulting in the negative δ13Ccarb excursions observed in the Stage 10 in South China.
Acknowledgements
This study was supported by the National Basic Research Program of China (973) (2013CB835003), the 111 project (to Y. Shen) and the National Natural Science Foundation (41330101, 41221001, 41290260, 41330102, 41520104007, 41403062).