




No CrossRef data available.
APPLICATION OF MARKOV CHAIN MODELS FOR SHORT-TERM GENERATION ASSETS VALUATION
Published online by Cambridge University Press: 12 December 2005
Abstract
This paper valuates generation assets within deregulated electricity markets. A new framework for modeling electricity markets with a Markov chain model is proposed. The Markov chain model captures the fundamental economic forces underlying the electricity markets such as demand on electricity and supplied online generation capacity. Based on this new model, a real option analysis is adopted to valuate generation assets. The Markov chain model is combined with a binomial tree to approximate the stochastic movement of prices on both electric energy and ancillary services, which are driven by the market forces. A detailed example is presented. This method is shown to provide optimal operation policies and market values of generation assets. This method also provides means to analyze the impacts of demand growth patterns, competition strategies of competitors, and other key economic forces.
Information
- Type
- Research Article
- Information
- Probability in the Engineering and Informational Sciences , Volume 20 , Issue 1 , January 2006 , pp. 127 - 141
- Copyright
- © 2006 Cambridge University Press
1. INTRODUCTION
The deregulation of the electric power industry around the world has raised many new challenges for all stakeholders. The Generation Company (GENCO) was granted operation flexibilities such as self-unit-commitment and self-dispatch when the obligation to meet electricity load was relieved after deregulation. New analytical tools for the operation and evaluation of generation assets are in great need. Traditional Discount Cash Flow (DCF) methods such as Net Present Value (NPV) used in the electric power industry before deregulation ignore the inherent flexibilities in operating generation assets, which renders them incomplete and undervaluated generation assets.
This paper proposes a new framework for modeling electricity markets with the Markov chain model. Real option analysis is combined with the Markov chain model to valuate generation assets within deregulated electricity markets. This article is organized into six sections. Section 2 reviews past research on applying financial option and real option to valuate generation assets. Section 3 analyzes electricity market structure and architecture. Section 4 models electricity markets as a Markov chain model and formulates the valuation of generation assets as a GENCO decision-making problem. Section 5 illustrates the application of the Markov chain model with an example. The optimal operation policies and values of generation assets are given. Section 6 concludes with a discussion on the strength and practical issues of the models used in this paper.
2. REVIEW OF PAST RESEARCH
Financial option theory has been deployed to model generation assets as call options on a spark spread [3,8]. A spark spread is defined as the difference between the price of electricity and the cost of fuel burned to generate electricity, as shown in Eq. (1):

The financial exchange option modeling approach explicitly accounts for the flexibility in operating generation assets and provides more insight on the operation and valuation of generation assets than the traditional NPV approach. However, the exchange option approach is incomplete, as it ignores physical generation unit operating constraints that affect the value and optimal operating policies. The absence of physical characteristics of generation units leads to the overvaluation of generation assets. The value given by the financial option is for generation assets with infinite speed and flexibility in operation and is mathematically bound to be nonnegative by Eq. (1). It is in fact an upper limit for the values of generation assets with physical constraints.
Physical constraints of generation assets, such as startup time, shutdown time, minimum on time, minimum downtime, ramp-up rate, and ramp-down rate, must be included in valuing generation assets. Startup and shutdown times define how long it takes a generator to start up or shut down. This means that the decision to exercise a spark spread call option must be made before the prices on electricity and fuel are observed. Minimum on-time and downtime constraints require a generator to remain on or off once it has been started up or shut down for a period of time. This means that spark spread options are not always available and losses are possible. The ramp-up rate constraints limit the increase of a generator's output, whereas the ramp-down rate limits the capability of a generator to decrease its output; both mean that a spark option is not always available for the full generation capacity. The extent of the physical constraint impact on valuation of generation assets is not fully understood at this time. This is especially true of ramp-up and ramp-down constraints. Deng [2] stated that startup cost, ramp-up time, and output-dependent heat rate have less impact on relatively efficient power plants like gas-fired power plants and thus could be ignored. Tseng and Barz [14] investigated the ramp constraint of power plants and concluded that ramp constraints have an impact on thermal power plants by reducing fuel economy, energy conversion efficiency, and available generation capacity. The ramp limitations also constrain what can be sold to reserve markets.
Real options analysis applies financial option pricing theory to the analysis of option opportunities in real assets and takes into account features of real assets [4]. Real option analysis provides GENCOs with a new methodology to fully value the operating flexibilities, which can be inherent in the nature of generation assets or in market trading. Real option analysis has been applied to value generation assets [2,7,13,14], where physical constraints of generation assets are included and different stochastic processes have been proposed to model the movement of prices on electricity within electricity markets.
The movements of price on electricity are modeled as stochastic processes. These are often assumed to be geometric Brownian motions (GBMs), as shown in Eq. (2):
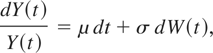
where Y(t) is the price on electricity at time t, μ is the drift rate of price on electricity, σ is the volatility of price on electricity, and dW(t) is the increment of a Brownian motion.
Modeling improvements aiming to capture features of electricity price movement have been proposed and investigated, which include mean-reversion, jumps, regime-switching, and time-varying volatilities, among others [1,9,15]. Econometric approaches are deployed to estimate the parameters of such stochastic processes using historical data. Although an econometric approach captures some features of markets, it is incomplete because the market structure and architecture of electricity markets and the underlying economic forces are ignored. Such an approach assumes electricity price movement to be autonomous and provides no means to analyze underlying economic forces.
Although physical operating constraints of generation assets have been included in recent research to define the options owned by GENCO, the impacts of physical constraints on electricity price movements are ignored. The movement of demand on electricity is also omitted.
3. MARKET STRUCTURE AND ARCHITECTURE OF ELECTRICITY MARKETS
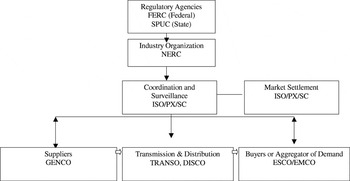
Market structure refers to the properties closely tied to the ownership and technology and market architecture defines a set of submarkets and the linkages between them [12]. Deregulation of the electric power industry breaks the vertically integrated utilities into horizontally independent entities such as Generation Company (GENCO), Transmission Company (TRANSCO), Distribution Company (DISCO), Electricity Service Company (ESCO), and Electricity Management Company (EMCO) shown in Figure 1.

Market structure of electricity markets.
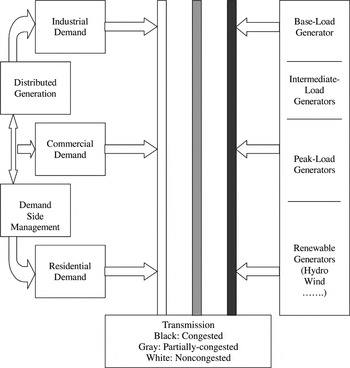
The independent entities are the buyers and sellers of both electric energy and ancillary services. They discover the time- and space-varying values of electric energy and ancillary services through electricity markets [10]. The technology of generation, transmission, storage, and consumption of electricity contributes to the time- and space-varying values of electricity. Location Marginal Price (LMP) addresses the space-varying nature of prices on electricity, demonstrating a nonlinear dependency between the prices of electricity at different locations transported by a limited capacity transmission network. The nonstorable nature of electricity inhibits temporal arbitrage based on storage and eliminates the temporal bond enforced by such arbitrages. However, the physical generation unit constraints do link the online generation capability of one hour to a previous hour. Although short-term demand on electricity is inelastic, it demonstrates some dynamic patterns. Due to these physical constraints, electricity is heterogeneous between different locations and time intervals. This leads to segments of electricity markets. A spatially segmented regional electricity market is also temporally segmented into base-load, intermediate-load, and peak-load submarkets, as shown in Figure 2. Those submarkets have different market players.

Segmentation of electricity markets.
For the base-load electricity market, the key suppliers are base-load generators that share similar technology to achieve efficiency of generating electricity. The transmission network is also less utilized during base-load periods; thus, the base-load electricity market is geographically more spanned. Peak-load generators also share similar technology to achieve fast speed. The transmission network is more utilized during peak-load periods; thus, the peak-load electricity market experiences more congestion.
Demand on electricity is composed of industry, commercial, and residential customers. Base demand is dependent on population size and macroeconomic variables. Peak demand is due to commercial and residential customers. It is tightly correlated with weather. The difference in the supply and demand forces in base-load and peak-load electricity markets suggest different market structures. This, in turn, leads to different market behaviors and models.
Market structure defines market players and their competition positions and market architecture defines how market players interact with each other and how electricity and information are exchanged and shared on electricity markets. The market architecture must be consistent with the market structure in which it is embedded, which may inhibit the proper function of some designs. Sheblé [11] defines the electricity market set to include forward and spot markets in the short term and future and planning markets in the mid-term and long term. A swap market is also deployed to facilitate the exchange of different contracts and risk sharing among all market players [11]. The linkages between submarkets may be implicit price relationships caused by arbitrage or explicit rules linking activities in one market to activities in another.
The submarkets could be categorized according to different criteria such as commodities traded, contracts traded, trading mechanism, and authority of the central ISO. The main commodities traded include electric energy and ancillary services. Physical generation unit constraints enforce implicit linkage between electric energy markets and ancillary services markets.
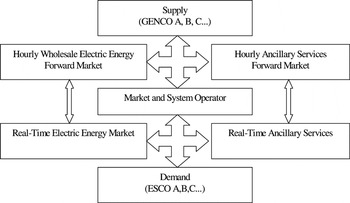
There are four major kinds of contract traded on most electricity markets: spot, forward, future, and options. Forward contracts are normally traded for physical delivery and allow the scheduling of both generation facilities and transmission networks operation. Typically, a forward is traded at least 1 day prior to the operating day and includes 24 hourly markets for the operating day. Spot contracts, real-time markets, are used to allow rescheduling and correcting for forecast errors. Future contracts are more often used as hedging instruments, and delivery is also possible. There are also options trading on all of the various contracts. The linkages between trading different contracts are implicit and come from the portfolio optimization of market players and from the physical or financial linkage of these markets. These contracts provide a GENCO with more operating flexibility such as contract selection in addition to the inherent physical operating flexibility such as unit commitment and self-dispatch. Figure 3 illustrates the simplified market architecture of electricity markets used in this paper.

Market architecture of electricity markets.
One of the most important linkages between the submarkets is time, which binds the base-load market, intermediate-load market, and peak-load market. The dynamics of both supply and demand will be modeled in the next section with a Markov chain model.
4. MARKOV CHAIN MODEL OF ELECTRICITY MARKETS
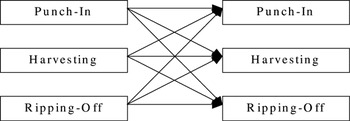
The simultaneous supply and consumption of electricity renders it heterogeneous among different time intervals. The nonstorable nature of electricity renders only online generation capacities as call options on a “spark spread.” The self-unit-commitment and dispatch of generation units lead to a Markov process for supply of online generation capacity. The aggregated online generation capacity at the next time interval only depends on the current level of online generation capacity and the decisions of GENCOs since the last time period. Demand randomness on electricity also can be approximated as a Markov process. A Markov chain model for electricity markets is shown in Figure 4.

Markov chain model for electricity markets.
In Figure 4, an electricity market is defined using three states: punch-in, harvesting, and ripping-off. Each state has a definition for the relationship between supplied online generation capacity and demand, as defined in Eqs. (3) and (4).

The market state is defined as

The initial system states S0, states' transition matrix A, and distributions of prices B for each state are defined in Eq. (5):

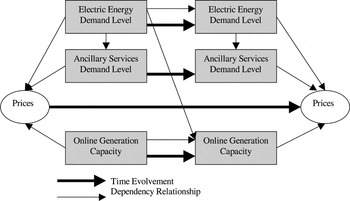
It is also possible to incorporate more structure into the Markov chain model framework. In Figure 5 demand on electric energy is assumed to evolve autonomously according to a Markov chain. The demand on ancillary services is assumed to be dependent on energy demand. The online generation capacity is modeled to be dependent on the previous supply level and energy demand. The prices on electric energy and ancillary service are determined simultaneously by supplied online generation capacities and demand level.

Markov chain model for electricity markets with supply and demand states.
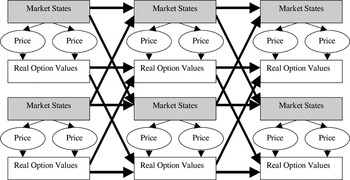
The Markov chain model can be estimated from historical data using the Baum–Welch or EM algorithm [16]. Once the Markov chain models are known, a Markov lattice is constructed for the price movement, as shown in Figure 6. The Markov states transition matrix A defines the evolvement of markets states, and electricity price at each state is defined by price distributions B and approximated with the binomial tree. Markov lattices have been shown to be easier to construct and converge faster than multiple-period multinomial trees [5].

Markov chain model with real option values.
The valuation of generation assets is formulated as a Markov decision process, which is identified as a real option analysis approach. The solution not only provides the value of generation assets but also the optimal operating policy [6]. An operating policy is a mapping from system state space to feasible action sets. The physical constraints of a generation unit determine the feasible action sets. The cost for changing operating status of a generation unit, such as startup and shutdown costs, is modeled as an immediate cost. The payoff for each state can be modeled as a portfolio of call options. The Markov decision process can be solved using linear programming or iterative algorithms [6]. The inclusion of risk is modeled by introducing a risk-free discount rate with risk-neutral probabilities. The risk-neutral probabilities do not necessarily equal the true physical probabilities, but are modified to allow a single risk-free discount rate to be used throughout the decision process.
Further improvement could be achieved by modeling electricity markets with multiple Markov chain models. Each approximates a segmented electricity market including base-load, intermediate-load, and peak-load markets. Multiple Markov chain models are linked together by the system states. The ending states of a Markov chain are the initial states of the next Markov chain.
5. NUMERICAL EXAMPLE
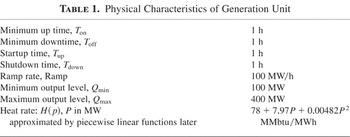
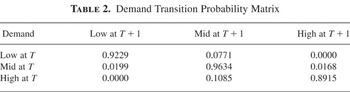
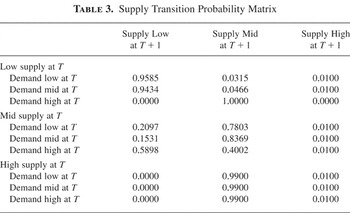
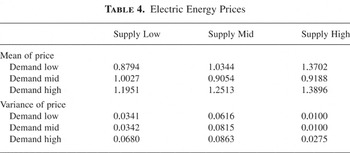
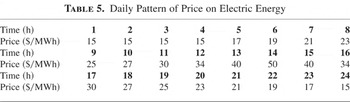
A thermal generation unit is valued using a Markov chain model in the following example. The physical constraints for the given generation unit is shown in Table 1. The demand on electricity and supplied online generation capacity are modeled to have three states: low, intermediate, and high. The transition of demand on electricity is modeled to follow a Markov chain defined in Table 2. The transition of supplied online generation capacity is assumed to be dependent on the previous level of demand and capacity supply. The interdependency is modeled following the Markov chain defined in Table 3. Only one Markov chain is utilized for the whole time span for simplicity. More Markov chains and system states could be used to increase the accuracy at the cost of computational burden. The prices on electric energy and ancillary services are assumed to follow Normal distributions, as shown in Table 4. Prices in Table 4 are normalized according to the daily price pattern shown in Table 5. Equation (6) provides mathematical definitions for Tables 2, 3, and 4. All data are generated by market simulations.

where i,j,k ∈ 1,…,N, N is the number of states.
Physical Characteristics of Generation Unit

Demand Transition Probability Matrix

Supply Transition Probability Matrix

Electric Energy Prices

Daily Pattern of Price on Electric Energy

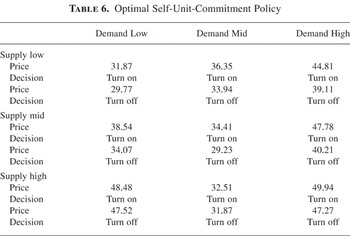
The optimal operating policy of the investigated generation unit defines the optimal action for each state. Past researchers searched for a “spark spread” threshold. A generation unit is turned on when the expected “spark spread” is greater than the threshold. This example shows that the self-unit-commitment decision should not only depend on price levels but more importantly on the current market states of demand and supplied online generation capacity. Table 6 defines the optimal generation unit operating policy for the specified electricity market. It is shown that a generation unit should not be turned on when the demand and supply is in balance, even if a relative high price is observed. The reason is that a relative high price could occur due to randomness in market forces but not demand and supply forces. Within Table 6, it is observed that the investigated generation unit should only be turned on when demand is high and the market is not in balance. A decision based on both underlying economic forces and observed prices provide more value to GENCOs.
Optimal Self-Unit-Commitment Policy

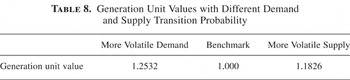
For a one-week valuation, Tables 7 and 8 give the value of a thermal generation unit with an initial state as off at 1 am. The focus is on the comparison of the impacts of changes on demand and supply and changes on the competition strategies of market players. The changes of demand and supply are based on economic forces such as demand composition, fuel prices, and new generation technologies. These changes are defined by the demand and supply transition probabilities matrix A. Competition strategy changes are defined by the distributions of prices B for each market state. Different distributions result in different volatilities and payoffs at each market state. All values are normalized to facilitate comparison.
Generation Unit Values with Different Volatility on Electricity Prices

Generation Unit Values with Different Demand and Supply Transition Probability

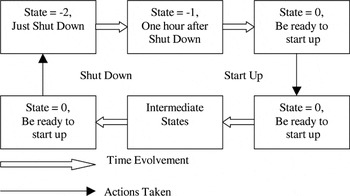
This example also addresses implementation. The minimum on and minimum off time constraints of a unit specifies that the state depends not only on its current unit state, on/off, but also the unit state history. Such constraints must be carefully modeled to satisfy Markovian properties. When the state definition includes the complete unit state history, then the Markov chain model is appropriate. For example, the shutdown time can be used to define the system state combined with the output level, as shown in Figure 7.

Markovian properties modeling.
6. CONCLUSION
Markov chain modeling of electricity markets provides the capability to include market structure and architecture. It explicitly distinguishes the underlying economic forces as well as the randomness of markets. The identification of changes in demand, supply, and competition strategies provides more insight on the operation and valuation of generation assets.
As a fundamental approach, the Markov chain model provides the capability to forecast and mitigates the dependency on historical data, as the demand and supply forces mechanism is more stable and can be predicted from other information.
As demonstrated in this paper, this modeling enables the dynamic real-time valuation of assets as new information on market state is received and better understanding of the markets and updated model parameters are available.
Acknowledgments
This work has been supported by Electric Power Research Center at Iowa State University. The opinions and models are solely the responsibility of the authors.
References
REFERENCES
Deng, S.
(2000).
Pricing electricity derivatives under alternative stochastic spot
price models. In
Proceedings of the 33rd Hawaii International Conference on System
Sciences.
Deng, S.
(2003).
Incorporating operational characteristics and startup costs in
option-based valuation of power generation capacity.
Probability in the Engineering and Informational Sciences
17(2):
155–181.Google Scholar
Deng, S.,
Johnson, B., &
Sogomonian, A.
(1998).
Exotic electricity options and the valuation of electricity
generation and transmission. In
Chicago Risk Management Conference.
Dixit, A.K. &
Pindyck, R.S.
(1994).
Investment under uncertainty.
Princeton, N.J.:
Princeton University Press.
Duan, J.C. &
Simonato, J.G.
(2001).
American option pricing under GARCH by a Markov chain
approximation.
Journal of Economic Dynamics and Control
25(11):
1689–1718.Google Scholar
Frederick, H.
(1995).
Introduction to operations research.
New York:
McGraw-Hill.
Gardner, D. &
Zhuang, Y.
(2000).
Valuation of power generation assets: A real options
approach.
ALGO Research Quarterly
3(3):
9–20.Google Scholar
Mount, T.D.
(2000).
Strategic behavior in spot markets for electricity when load is
stochastic. In
Proceedings of the 33rd Hawaii International Conference on System
Sciences.
Schweppe, F.C.,
Bohn, F.R.,
Tabors, R., &
Caramanic, M.
(1988).
Spot pricing of electricity.
Boston:
Kluwer Academic.
Sheblé, G.
(1999).
Computational auction mechanisms for restructured power industry
operation.
Boston:
Kluwer Academic.
Stoft, S.
(2002).
Power system economics: Designing markets for electricity.
New York:
Wiley.CrossRef
Svoboda, A.J.,
Tseng, C.L.,
Li, C.A., &
Johnson, R.B.
(1997).
Short-term resource scheduling with ramp constraints.
IEEE Transactions on Power Systems
12(1):
77–83.Google Scholar
Tseng, C.L. &
Barz, G.
(1999).
Short-term generation asset valuation. In
Proceedings of the 32nd Hawaii International Conference on System
Sciences.
Vucetic, S.,
Tomsovic, K., &
Obradovic, Z.
(2001).
Discovering price-load relationships in California's
electricity market.
IEEE Transaction on Power Systems
16(2):
280–286.Google Scholar
Yu, W. &
Sheblé, G.
(2004).
Modeling electricity markets with hidden Markov model.
41st Annual Power Affiliate Report.
AMES: Electric Power Research Center, Iowa State University,
Ames, IA.
Market structure of electricity markets.
Segmentation of electricity markets.
Market architecture of electricity markets.
Markov chain model for electricity markets.
Markov chain model for electricity markets with supply and demand states.
Markov chain model with real option values.
Physical Characteristics of Generation Unit
Demand Transition Probability Matrix
Supply Transition Probability Matrix
Electric Energy Prices
Daily Pattern of Price on Electric Energy
Optimal Self-Unit-Commitment Policy

Generation Unit Values with Different Volatility on Electricity Prices
Generation Unit Values with Different Demand and Supply Transition Probability
Markovian properties modeling.
 You have
Access
- 4
- Cited by