I. INTRODUCTION
Interfaces are essential for the functionality of semiconductor devices. One such interface is between the dielectric (usually some kind of silicate glass) and metal-based materials. But these interfaces have one disadvantage; they are rather weak. Reference Varchenya, Simanovskis and Stolyarova1–Reference Volinsky, Moody and Gerberich3 Therefore, it is necessary to test these interfaces using one of the methods available to measure adhesion. A summary of the most common test methods, their advantages and disadvantages, and suitability for certain material systems is found in a review by Volinsky et al. Reference Volinsky, Moody and Gerberich3 One of the methods described is nanoindentation induced delamination. Reference Marshall and Evans4–Reference Kriese, Gerberich and Moody6 However, with this method, it may be necessary to apply a compressive stressed over-layer on top to induce delamination of an interface. Reference Kriese, Gerberich and Moody5–Reference Cordill, Moody and Bahr8 Another method is the double cantilever beam test according to Barthel et al. Reference Barthel, Kerjan, Nael and Nadaud9 With this method, multilayer structures can be tested and an interface energy release rate can be calculated. Microbending beams are also often utilized for determining interface fracture energies, especially with in situ experiments. Reference Hirakata, Takahashi, Truong and Kitamura10–Reference Schaufler, Schmid, Durst and Göken12 Another method which is often used to determine an interface energy release rate for multilayer systems is the 4-point-bending test. Reference Charalambides, Lund, Evans and McMeeking13–Reference Dauskardt, Lane, Ma and Krishna15 In the beginning, it was developed to determine the interfacial adhesion for bi-layered material systems Reference Charalambides, Lund, Evans and McMeeking13 but Ma et al. Reference Ma, Fujimoto, Flinn, Jain, Adibi-Rizi, Moghadam, Dauskardt, Filter, Gadepally, Greer, Oates and Rosenberg14 modified the sample setup so it can be used to determine interface energy release rates in multilayer material systems. This method is widely used in semiconductor material systems to characterize metal/dielectric interfaces. Reference Ma, Fujimoto, Flinn, Jain, Adibi-Rizi, Moghadam, Dauskardt, Filter, Gadepally, Greer, Oates and Rosenberg14–Reference Birringer, Chidester and Dauskardt20 A disadvantage of this method, which is also shared by other tests, is that not necessarily the interface of interest fails in a multilayer system. Hence, it is necessary to identify the failing interface post-mortem. The output of successful tests which can be used to evaluate an interface energy release rate is also a challenge for the 4-point-bending technique. Earlier studies addressed this problem Reference Shaviv, Roham and Woytowitz19,Reference Birringer, Chidester and Dauskardt20 and different approaches were proposed to enhance the output of evaluable samples. For instance, Birringer et al. Reference Birringer, Chidester and Dauskardt20 suggested that the geometry of the sample should be modified to raise the output or that the orientation of the silicon counterpart glued to the Si part with the material layers on them is changed. Another method as proposed by Shaviv et al. Reference Shaviv, Roham and Woytowitz19 is varying the depth of the pre-notch.
In this study, we investigated the material systems Cu and TiN on annealed borophosphosilicate glass (BPSG) with the 4-point-bending technique. The two systems Cu/BPSG and TiN/BPSG were chosen as representatives of a weakly and a strongly adhering interface. It is known from the literature that Cu/SiO x represents a weak interface Reference Matoy, Detzel, Müller, Motz and Dehm11,Reference Kriese, Moody and Gerberich21 with an interface energy release rate of about 0.65 J/m2 as reported by Matoy et al. Reference Matoy, Detzel, Müller, Motz and Dehm11 Another result for a Cu/SiO2 interface was reported by the measurements of Kriese et al., Reference Kriese, Moody and Gerberich21 but they also found that depending on the thickness of the Cu layer the determined interfacial adhesion is changing. This can be ascribed to plastic deformation in the Cu layer, which is more suppressed in a thin film. Hence, it appears as if a thicker Cu layer adheres better than a thin one, but the plastic deformation leads to an overestimation of the energy release rate of the interface. Bulk Cu itself has a very high fracture energy, for instance an ultra-fine grained (UFG) Cu, with a grain size in the region of 340 nm, Reference Hohenwarter and Pippan22 shows a crack initiation energy of 7.6 kJ/m2. Reference Hohenwarter and Pippan22
The interface TiN/BPSG is the representative of a strong interface, if compared to the Cu/BPSG interface. In the literature, an interface adhesion of about 8 J/m2 (Ref. Reference Ma, Fujimoto, Flinn, Jain, Adibi-Rizi, Moghadam, Dauskardt, Filter, Gadepally, Greer, Oates and Rosenberg14) is reported for a TiN/SiO2 system. TiN usually is a very brittle material with a fracture energy of about 20 J/m2. Reference Kamiya, Nagasawa, Yamanobe and Saka23,Reference Massl, Thomma, Keckes and Pippan24 In these two studies, microcantilever Reference Kamiya, Nagasawa, Yamanobe and Saka23 and microbending beam approaches Reference Massl, Thomma, Keckes and Pippan24 were used to determine the fracture energy of a TiN film in the thickness regime of a few µm.
The adhesion testing in our study was performed utilizing ex situ and in situ 4-point-bending approaches under an optical microscope and in a scanning electron microscope (SEM). Experimental investigations in the optical microscope have been performed in earlier studies Reference Ma, Fujimoto, Flinn, Jain, Adibi-Rizi, Moghadam, Dauskardt, Filter, Gadepally, Greer, Oates and Rosenberg14,Reference Dauskardt, Lane, Ma and Krishna15 to observe the crack initiation and subsequent crack propagation along the interface. In our investigation, additional in situ testing in the SEM was performed to obtain a more detailed view on the crack behavior and crack path selection during the experiment. This should allow for the determination of the failing interface while the experiment is ongoing without using any additional testing methods after the experiment. In addition, the in situ observation may also shed light on the crack initiation and propagation, which helps to understand the features of the load–displacement data. In the end, an explanation shall be given why for the investigated material systems (Cu/BPSG and TiN/BPSG) certain interfaces are failing.
A lot of theoretical work has been performed to understand the crack behavior and crack path selection for an interfacial crack. Reference He and Hutchinson25–Reference Suo and Hutchinson29 An explanation of when a sample chooses to fail along the interface is given by He and Hutchinson. Reference He and Hutchinson25 They investigated the mechanical requirements for a crack in a bi-material layer system to kink onto the interface and fail along it. They found that, for a material system where there is no elastic mismatch between the two materials, the interface energy release rate has to be around ¼ or less than the fracture energy for the adjacent material, so that the crack can kink onto the interface between those two materials. In this study, we did not have a bi-layered material system. Instead, the aim of this study is to investigate if it is possible to use the findings of He and Hutchinson Reference He and Hutchinson25 and use them on a system consisting of several different films (here after termed multilayer).
In our case, the thin film multilayer structure is confined between two thick silicon substrates, which give the predominant elastic properties of the sample. It is assumed that it is possible to use the findings of He and Hutchinson Reference He and Hutchinson25 for the 4-point-bending method and see if they can be used to answer pending questions.
II. EXPERIMENTAL
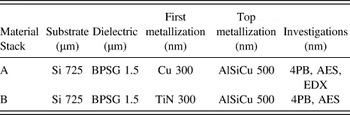
A 725 µm thick Si (100) wafer was used as a base material for the two types of multilayered samples investigated in this study. A BPSG layer with 1.5 µm thickness was deposited using plasma enhanced chemical vapor deposition. Prior to the deposition of subsequent layers, the BPSG film was densified by an annealing treatment at ∼900 °C. Following that, a 300 nm layer of one of the two metallization layers, Cu (Material Stack A) or TiN (Material Stack B), was deposited using magnetron sputtering. In a final deposition step, the top layer of AlSiCu with 500 nm thickness was applied by magnetron sputtering. After completion of the deposition, the wafers were annealed in an inert gas atmosphere at 400 °C for 1 h. Detailed information on the different material stacks and a list of the performed experiments for each one is given in Table I.
Layer structure of the two investigated material stacks and the investigations which have been performed for each material system. 4PB—4-point-bending (ex situ and in situ); AES; EDX in the TEM.

The 4-point-bending sample preparation was based on one proposed in earlier studies. Reference Shaviv, Roham and Woytowitz19,Reference Völker, Heinz, Matoy, Roth, Batke, Schöberl, Scheu and Dehm30 After finishing the wafer production, the samples were diced into the desired geometry by a wafer saw. The geometry of the samples is 7 mm by 40 mm. During dicing of the wafers, the pre-notch with 500 µm depth and 36 µm width was introduced by the wafer saw. Afterward, the wafer pieces were glued on a matching Si (100) counterpart with a thickness of 725 µm, using an EPO-TEK 375 epoxy. After the epoxy was cured for 8 h at 100 °C in a vacuum, the edges of the samples were ground and polished to get scratch free edges for the optical and SEM in situ experiments. Besides testing in situ in the optical microscope and SEM, some samples were also tested ex situ.
Ex situ and in situ 4-point-bending tests were performed using a Kammrath & Weiss bending module with a displacement rate of 0.1 µm/s. The spacing between the two inner loading pins was 20 mm and between the two outer pins was 30 mm. The ex situ and in situ 4-point-bending experiments under an optical microscope were performed until the sample completely fractured. The in situ SEM measurements were stopped at 35 N to prevent failure of the sample and possible damage to the SEM by fractured parts of the sample. The SEM used for the in situ experiments was a Zeiss LEO 1525, operated at an acceleration voltage of 20 kV.
The interface energy release rate was determined using the equation of Ma et al. Reference Ma, Fujimoto, Flinn, Jain, Adibi-Rizi, Moghadam, Dauskardt, Filter, Gadepally, Greer, Oates and Rosenberg14 :
 $${G_i} = {{21\left( {1 - {\nu ^2}} \right){P^2}{l^2}} \over {16E{h^3}{b^2}}}\quad .$$
Here, P is the load at the plateau region, at which the crack extends along the interface, b represents the 7 mm width of the sample, l is the 5 mm distance between inner and outer pins, h is the half sample height of about 725 µm, E is the Young's modulus of 130 GPa for Si (100), Reference Wortman and Evans31 and ν = 0.28 the Poison's ratio of Si (100). Reference Wortman and Evans31 Other possibilities to evaluate an interface energy release rate for multilayer systems are given in Tran et al. Reference Tran, Shirangi, Pang and Volinsky32 and Hsueh et al. Reference Hsueh, Tuan and Wei33 The equation used by Tran et al. Reference Tran, Shirangi, Pang and Volinsky32 is for a bi-layered system with two different material layers. Hsueh et al. Reference Hsueh, Tuan and Wei33 have developed a more general equation to calculate the interface energy release rate in a 4-point-bending experiment for multilayer systems in which all the layers have to be taken into account, for instance, if they all have similar thicknesses and hence, there is not one dominant layer, like the Si substrates in this investigation.
The evaluation according to Ma et al., Reference Ma, Fujimoto, Flinn, Jain, Adibi-Rizi, Moghadam, Dauskardt, Filter, Gadepally, Greer, Oates and Rosenberg14 based on the bi-layered 4-point-bending approach after Charalambides et al., Reference Charalambides, Lund, Evans and McMeeking13 was developed for a bi-layered material system with the same material properties and thickness for both layers. However, in the literature Reference Ma, Fujimoto, Flinn, Jain, Adibi-Rizi, Moghadam, Dauskardt, Filter, Gadepally, Greer, Oates and Rosenberg14–Reference Birringer, Chidester and Dauskardt20 and for coherency also in this study, Eq. (1) is used since the elastic properties are dominated by the thick Si substrate rather than very thin layers.
The standard deviation of the interface energy release rate was determined using the following equation:
 $$s = \sqrt {\left( {{1 \over {n - 1}}} \right)\mathop \sum \limits_{i = 1}^n {{\left( {{x_i} - \bar x} \right)}^2}} \quad .$$
In this case, n denotes the number of samples, x
i
the observed value, and
 $\bar x$
the mean value. Determination of the failing interface for the ex situ experiments was performed using Auger electron spectroscopy (AES) to analyze the fracture surfaces of tested 4-point-bending samples on a PHI Scanning Auger Nanoprobe, at an acceleration voltage of 5 kV. In addition, transmission electron microscopy (TEM) energy dispersive x-ray spectroscopy (EDX) investigation of the intact interface of Material Stack A was performed on a JEOL JEM-2200FS analytical TEM with a field emission gun at 200 kV with an in-column energy filter (Omega Filter), in a scanning mode. The TEM sample was prepared by following the conventional preparation route of grinding, dimpling, and Ar-ion thinning.
III. RESULTS
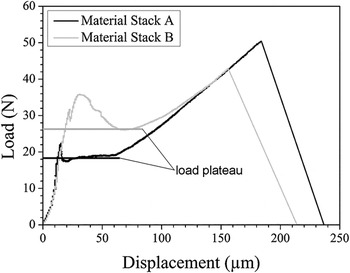
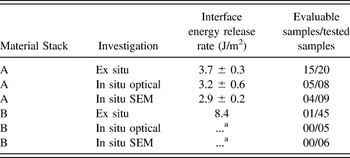
The ex situ load–displacement curves shown in Fig. 1 for Material Stack A, the Cu metallization, give an interface energy release rate of (3.7 ± 0.3) J/m2 according to Eq. (1). For Material Stack B, with the TiN layer, the calculated interface energy release rate is 8.4 J/m2. In this specific case, the failing interface (TiN/BPSG) was confirmed by post-mortem AES studies. Other samples of Material Stack B showed no significant plateau region, even though the optical appearance of the fracture surfaces suggests that an interface is failing but not necessarily the interface of interest. By an optical analysis of the fracture surfaces, it appeared that the delaminated interface is AlSiCu/epoxy. Rather surprising was the output of evaluable samples of the ex situ experiments for Material Stacks A and B. For Material Stack A, 15 of the 20 tested samples could be used to evaluate an interface energy release rate. In contrast to that, only 1 of 45 tested samples of Material Stack B gave a result for the TiN/BPSG interface. This is also the reason why for Material Stack B no standard deviation is provided. All interface energy release rate results from the ex situ and in situ 4-point-bending experiments are summarized in Table II.
Load–displacement curves of ex situ 4-point-bending fracture experiments. The curve with the lower load plateau is for Material Stack A, the Cu metallization, and the curve with the higher load plateau for Material Stack B, the TiN layer.

4-point-bending results for different material stacks. The interface energy release rates for Material Stack A are in good agreement with each other. For Material Stack B, only the ex situ experiments gave one sample, which could be used to evaluate an interface energy release rate of the TiN/BPSG interface. The failing interface was confirmed by post-mortem characterization.

a Note: That the in situ tests of Material Stack B revealed failure along the AlSiCu top layer and epoxy and thus provided no values for the interface of interest.
All in situ 4-point-bending experiments under the optical microscope revealed crack initiation from the notch at the initial load drop in the load–displacement curve. In the optical microscope, it is also possible to distinguish if the crack kinks onto an interface or not, and if the crack extends only on one side or on both sides along the interface. However, the failing interface itself cannot be identified with the optical in situ 4-point-bending experiment due to the limited resolution power.
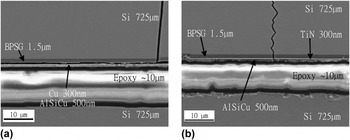
In a next step, the in situ testing was performed in the SEM. During these in situ tests, the failing interface could be resolved, because the layers have significantly different contrast in the secondary electron image. For Material Stack A, it is the Cu/BPSG which is depicted in Fig. 2(a). For Material Stack B, the in situ SEM observation (see Fig. 2) resolves that not the TiN/BPSG interface is failing, but rather the interface between AlSiCu/epoxy is delaminating. It can be seen in Fig. 2(b) that the crack arrests at the interface between AlSiCu and epoxy. This would also explain the findings in some of the ex situ and the in situ optical measurements where it seems as if the sample is failing along an interface but not the interface of interest (TiN/BPSG).
Two in situ SEM images after crack initiation for the two Material Stacks A and B are shown. (a) Image of the crack reveals fracture along the Cu/BPSG interface of Material Stack A. Note that the 300 nm Cu and 500 nm AlSiCu films appear as one layer in the image, which may be due to interdiffusion (see Fig. 4). Furthermore, it can be seen that some residues from the Al–Cu layer seem to stick to the BPSG. (b) The layer structure of Material Stack B. The image reveals that the crack does not kink onto the interface between TiN/BPSG. It rather propagates through the TiN and the AlSiCu layer and arrests at the AlSiCu/epoxy interface. All layers have significantly different contrasts, which permit their identification in the secondary electron image.

The measured interface adhesion for Material Stack A in the in situ SEM experiments was (2.9 ± 0.2) J/m2, which coincides with the results of the in situ optical measurements (3.2 ± 0.6) J/m2 and the ex situ experiments (3.7 ± 0.3) J/m2. For Material Stack B, no interface energy release rate could be evaluated for the in situ experiments, because the load–displacement curves showed no significant load plateau.
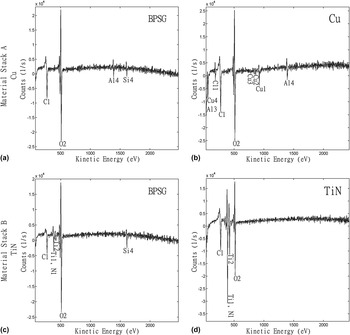
AES measurements for the fracture surfaces of Material Stack A, the Cu metallization, revealed that there was some Al present on the interface between Cu and BPSG, as shown in Figs. 3(a) and 3(b). Furthermore, AES identified the failing interface for Material Stack B as the interface between TiN/BPSG, see Figs. 3(c) and 3(d). Additionally, TiN residues were found on the BPSG fracture surface, as shown in Fig. 3(c).
AES spectra of the 4-point-bending fracture surfaces of Material Stacks A [(a) and (b)] and B [(c) and (d)]. The spectra show that for the investigated samples the failing interface is the one between Cu (Material Stack A) or TiN (Material Stack B) and BPSG. In the AES spectra in (a) and (b), Al is found on both fracture surfaces. This occurs because of Al diffusion through the Cu layer into the BPSG layer. In spectra (c) and (d), the fracture surfaces of Material Stack B are depicted. In image (c), the BPSG fracture surface, TiN residues are detected.

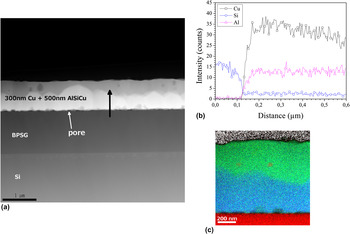
The Al found at the interface of Material Stack A led to a more detailed investigation on the Cu and AlSiCu layers using EDX scanning TEM measurements. It was possible to show by EDX that some Al from the top AlSiCu layer diffused through the Cu film to the interface [see Fig. 4(b)]. Most likely, the Al diffused during the final 400 °C anneal. In Fig. 4(a), the presence of pores at the interface between the metallic film and BPSG of Material Stack A was also observed. Additionally, it can be seen that there is a contrast difference between the left side (brighter region) and the right side (darker region) of the Cu + AlSiCu layer. Since Fig. 4(a) shows a high angle annular darkfield (HAADF) image, the main contrast difference is due to the difference in atomic number. This means that heavier elements appear brighter and lighter elements appear darker. Taking that into account, the region of the metallic film next to the BPSG layer must be Cu rich, while the top part must be Al rich. This can also be seen in the line scan profile [Fig. 4(b)], where the Cu signal loses intensity going further to the right side of the layer. Another interesting feature visible in the HAADF image is the dark spots in the Al rich side of the layer, which corresponds to Si rich particles formed in the AlSiCu layer. These findings are further supported by the EDX map presented in Fig. 4(c). Here it can be seen that an Al (green) enrichment is found on the top part of the metallic films and a Cu (blue) rich region at the lower part of the film adjacent to the BPSG diffusion barrier. In addition, the Si (red) particles embedded in the AlSiCu layer are resolved in the EDX map.
HAADF images for Material Stack A (a). Small pores [white arrow in (a)] are resolved at the interface between BPSG and the metal layer. The contrast difference indicates Cu rich (bright) and Al rich (dark) regions in the nominally 300 nm thick Cu/500 nm thick AlSiCu layers. (b) Concentration profiles for Cu, Al, and Si were revealed by EDX line scans [see black arrow in (a)]. The line scan profile of Material Stack A resolves Al diffusion through the Cu layer. In addition, it can be seen that the Cu signal intensity decreases with distance from the interface. This is supported by the EDX map of the Cu + AlSiCu layer in (c). In (c), green represents Al, blue Cu, and red Si. Note that some Si particles are found in the AlSiCu side of the layer. The Si precipitates are also resolved in the HAADF image by their scattering contrast.

IV. DISCUSSION
The main goal of the investigation is to learn from in situ fracture experiments how a crack initiates and propagates in a multilayer structure. In addition, an explanation shall be found why a certain interface is failing in a system consisting of several films. However, before discussing this issue, we have to discuss the interdiffusion of Al and Cu and its impact on the energy release rate values which we obtained.
The evaluated interface adhesion for Material Stack A (Cu/BPSG interface), (3.7 ± 0.3) J/m2, does correspond to the literature value found for similar material systems. Volinsky et al. Reference Volinsky, Moody and Gerberich3 report a value of 4.3 J/m2 for the work of adhesion of an Al–Cu layer on a SiO2 layer. Another study by Kriese et al. Reference Kriese, Moody and Gerberich21 found, for a Cu/SiO2 interface with a 400 nm thick Cu layer, an interface energy release rate of about 4 J/m2. Reference Kriese, Moody and Gerberich21 These results are in agreement with the one we found for our Al-alloyed Cu/BPSG interface, (3.7 ± 0.3) J/m2, which consisted of an 800 nm thick intermixed Cu–AlSiCu film. It further indicates that the diffused Al does not to have a significant influence on the interface energy release rate of Cu on BPSG. For Material Stack B, the TiN system, the determined value for the interface energy release rate of 8.4 J/m2 coincides well with a reported literature value of about 8 J/m2. Reference Ma, Fujimoto, Flinn, Jain, Adibi-Rizi, Moghadam, Dauskardt, Filter, Gadepally, Greer, Oates and Rosenberg14
The in situ SEM 4-point-bending experiments for Material Stack A showed that the crack kinked onto the Cu/BPSG interface [Fig. 2(a)], which is confirmed for the ex situ experiments by using AES analysis. For Material Stack B, it is depicted in Fig. 2(b) that the crack does not kink onto the TiN/BPSG interface, but rather extends completely through the layer system to the AlSiCu/epoxy interface and arrests at that interface. The failure of this interface could not be resolved because the applied load in the in situ SEM 4-point-bending experiments was not sufficiently high to fracture this interface. However, the optical inspection of the fracture surfaces, i.e., ex situ and in situ 4-point-bending tests under the optical microscope, revealed fracture along the AlSiCu/epoxy interface.
The comparison of samples from the ex situ experiments, which can be used to evaluate an interface energy release rate for the interface of interest for each material system, showed that the number is much higher for Material Stack A (15 samples) than for Material Stack B (1 sample). An explanation for this behavior is based on the theoretical findings of He and Hutchinson. Reference He and Hutchinson25 They found for a bi-material layer system that a crack chooses to kink onto the interface, if the interface energy release rate is about ¼ or less than the energy necessary to fracture the adjacent layer. The factor of about ¼ can be applied when it is assumed that there is no elastic mismatch between the two material layers. In principle, this can be assumed in the case of 4-point-bending with the sample setup used in our investigations. The elastic mismatch between the thin films can be neglected because they are confined between two thick Si substrates which provide the predominant elastic properties of the sample. If the interfacial energy release rate for the interface of interest from the 4-point-bending experiment is compared to the values for the fracture energy of the metallization layer, it should be possible to determine if the interface of interest is failing during the experiment. Literature values for the fracture energy of a TiN film of several µm thick are about 20 J/m2 (Ref. Reference Kamiya, Nagasawa, Yamanobe and Saka23,Reference Massl, Thomma, Keckes and Pippan24) and for UFG Cu 7.6 kJ/m2. Reference Hohenwarter and Pippan22 UFG Cu was chosen because the grain size of about 340 nm Reference Hohenwarter and Pippan22 corresponds to our layer thickness of 300 nm. If these literature values are compared to the calculated interface energy release rates from the 4-point-bending experiments, it becomes obvious that for TiN, with an interfacial energy release rate of 8.4 J/m2 and fracture energy of about 20 J/m2, the ratio of ¼ is not fulfilled. So the crack will prefer to fracture the TiN layer and run along another interface, which fulfills the ¼ criterion. For Material Stack A, the Cu layer, it can be seen that the interfacial energy release rate determined using the 4-point-bending experiment (3.5 J/m2) is much less than ¼ of the fracture energy of UFG Cu with 7.6 kJ/m2. Reference Hohenwarter and Pippan22 Hence, it is more probable for Material Stack A to fail along the Cu/BPSG interface. This explains why for Material Stack A the sample output is significantly higher than that for Material Stack B and it is possible to describe the failing of different interfaces, as observed for some of the 4-point-bending samples of Material Stack B. The TiN/BPSG interface does not fulfill the criterion for failure along the interface, as mentioned earlier, but many samples tend to fail along the AlSiCu/epoxy interface. This suggests that this interface fulfills the ¼ criterion and it is more probable for the crack to extend along the AlSiCu/epoxy interface. The failure of the TiN/BPSG interface can be explained as follows. There is the possibility of a flaw at the interface. This flaw gives the crack the opportunity to kink onto the interface. Once there, the energy necessary to fracture along the TiN/BPSG interface is lower than the energy to fracture along the AlSiCu/epoxy interface. So the crack stayed at the interface and extended along it. These findings also conclude that it does matter on which side the pre-notch is introduced. In our sample setup, the pre-notch is made on the Si wafers with the material layers on them. If the pre-notch would be introduced on the opposite side of the sample, the pure Si counterpart, it is possible that a different interface would fail than the one observed in our experiments. The reason for that is the crack could hit an interface which fulfills the ¼ criterion before it reaches the interface of interest. In this case, it is more likely for the crack to grow along the first interface. Taking these arguments into account, it can be concluded that the hypotheses regarding the fracture assumptions are correct and the criterion by He and Hutchinson Reference He and Hutchinson25 can be used for 4-point-bending tests of multilayer structures. In addition, the in situ measurements provide the possibility to identify the failing interface during the course of the experiment making time consuming post-mortem investigation methods of the fracture surfaces to a large extent unnecessary.
V. CONCLUSION
In this study, it was possible to show that in situ 4-point-bending experiments in the SEM allow to determine the failing interface in multilayered samples with several interfaces between materials without using additional methods. Furthermore, it could be demonstrated that in situ experiments provide information on the selection of the crack path, thus permitting to judge if a valid interface energy release rate can be calculated. The in situ experiments indicated that the theoretical findings by He and Hutchinson Reference He and Hutchinson25 for the interface failure in a bi-material system without elastic mismatch of the two materials can be used for 4-point-bending experiments of multilayer thin film structures constrained between two thick Si substrates.
ACKNOWLEDGMENTS
B.V. would like to thank R. Pippan for the discussions and T. Detzel and J. Fugger of Infineon Technologies Austria AG for their support. Part of this work was jointly funded by the Austrian Research Promotion Agency (FFG, Project No. 831163) and the Carinthian Economic Promotion Fund (KWF, contract KWF-1521|22741|34186).