Introduction
Obstructive sleep apnoea (OSA), characterised by repeated episodes of hypopnoea or apnoea events during sleep because of partial or complete occlusion of the upper airway, is a common disorder.Reference Peppard, Young, Palta, Dempsey and Skatrud1 The prevalence of OSA (apnoea/hypopnoea index of 5 or more events per hour) in the 30–70 year age group is estimated at 34 per cent in males and 17 per cent in females, and it increases with age.Reference Peppard, Young, Barnet, Palta, Hagen and Hla2 The most common symptoms are excessive daytime sleepiness, snoring and a reduction in cognitive functions.Reference Marin, Carrizo, Vicente and Agusti3 Furthermore, OSA is believed to be related to cardiovascular morbidity (e.g. hypertension, stroke, arrhythmia, myocardial infarction), metabolic consequences (e.g. diabetes) and overall mortality.Reference Somers, White, Amin, Abraham, Costa and Culebras4,Reference Jordan, McSharry and Malhotra5
Ageing increases the risk of OSA, and although a large number of studies have focused on this topic, the underlying mechanisms remain unclear. According to the current evidence, both anatomical and non-anatomical factors are responsible for OSA. In Asians, small craniofacial structures may be an important risk factor responsible for the pathogenesis of OSA.Reference Schorr, Kayamori, Hirata, Danzi-Soares, Gebrim and Moriya6 Compared with healthy controls, OSA patients tend to have a longer pharyngeal airway, an inferiorly located hyoid bone and a smaller cross-sectional area, which were proven to be related to ageing in the general population.Reference Barkdull, Kohl, Patel and Davidson7,Reference Sutherland, Lee, Phillips, Dungan, Yee and Magnussen8 However, upper airway morphology research has mainly concentrated on healthy participants, neglecting the possible effects that long-term snoring, vibration and intermittent hypoxia have on the upper airway morphology, which may be an underlying mechanism in aged patients. Whether the upper airway morphology in OSA patients changes the same way as in healthy participants is unclear.
This study aimed to investigate the effects of ageing on upper airway morphology in OSA patients. We tested the hypothesis that volume, cross-sectional area and linear dimensions are decreased, while the pharyngeal airway length, soft palate length and perpendicular distance from the hyoid bone to the mandibular plane are increased with ageing, which may predispose to pharyngeal collapse.
Materials and methods
Participants
This study included 124 male patients clinically suspected of having OSA and was conducted at Beijing Tongren Hospital. The patients’ age ranged from 18 to 65 years (mean ± standard deviation (SD) = 39.4 ± 10.48 years). Body mass index (BMI) ranged from 20.7 to 37.2 kg/m2 (mean ± SD = 27.12 ± 3.21 kg/m2). The patients’ height ranged from 1.64 to 1.9 m (mean ± SD = 1.74 ± 0.05 m). Apnoea/hypopnoea index ranged from 6.5 to 103 events per hour (mean ± SD = 49.29 ± 23.02 events per hour).
Obstructive sleep apnoea was suspected on the basis of a history of snoring, with or without daytime sleepiness. Patients were excluded if the following criteria were met: (1) severe cardiac, pulmonary, neurological, or other severe medical or psychiatric diseases; (2) an upper airway surgical history; (3) central sleep apnoea; (4) a space-occupying lesion of the upper airway; or (5) maxillofacial deformity.
Study design
A retrospective analysis of a cohort of male patients from January 2015 through February 2019, who underwent polysomnography and computed tomography (CT) of the upper airway at their initial evaluation, was performed. In addition, patients were stratified according to the following criteria: (1) apnoea/hypopnoea index – less than 30 events per hour = mild-to-moderate OSA, and 30 or more events per hour = severe OSA; and (2) BMI – less than 24 kg/m2, 24–28 kg/m2 or more than 28 kg/m2.
Polysomnography
Overnight polysomnography was carried out for each patient. Electroencephalography, electrooculography and electromyography, and other monitoring including oximetry, measurements of airflow, and measurements of ribcage and abdominal movements during breathing, were recorded. Sleep stage, arousal and respiratory events were scored according to standard criteriaReference Berry, Budhiraja, Gottlieb, Gozal, Iber and Kapur9 (hypopnoeas: 30 per cent reduction in airflow, with 3 per cent or more desaturation or arousal from sleep).
Upper airway imaging analysis
An upper airway CT scan was performed on all patients at the end of expiration in the supine position with the Frankfort plane perpendicular to the horizontal plane. Subjects were asked to stay awake, and to keep their mouths closed without swallowing or chewing.
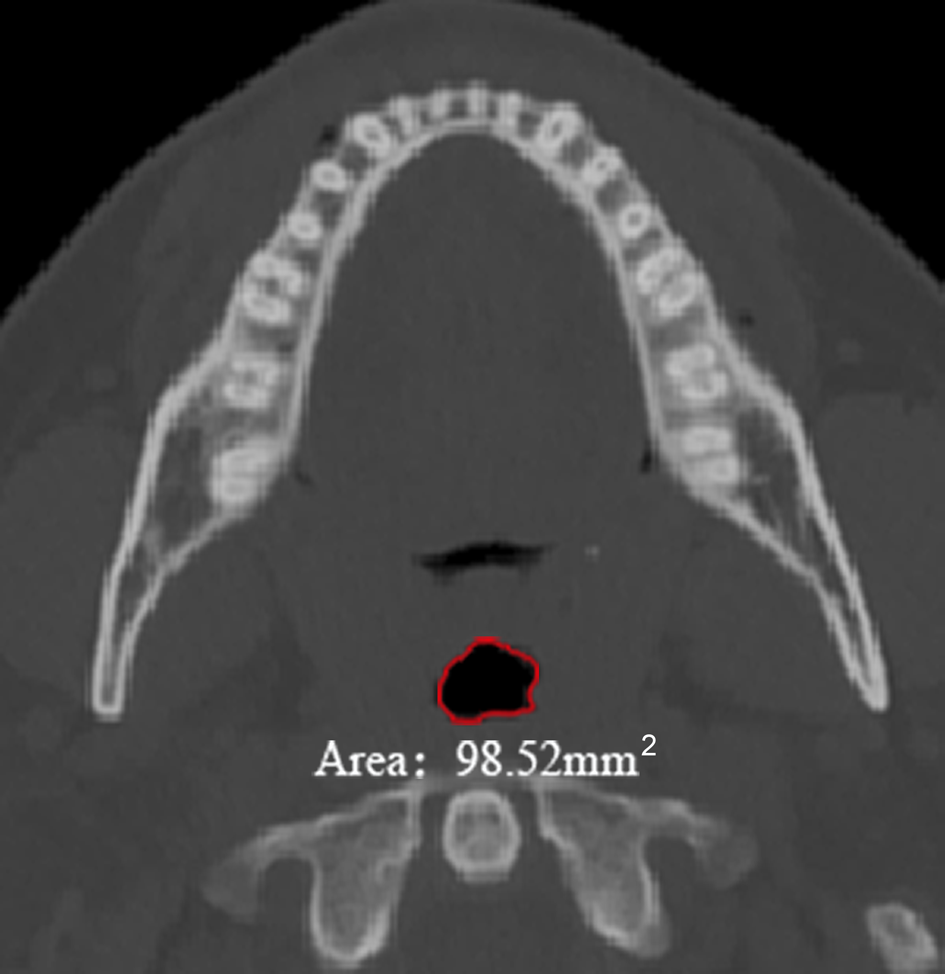
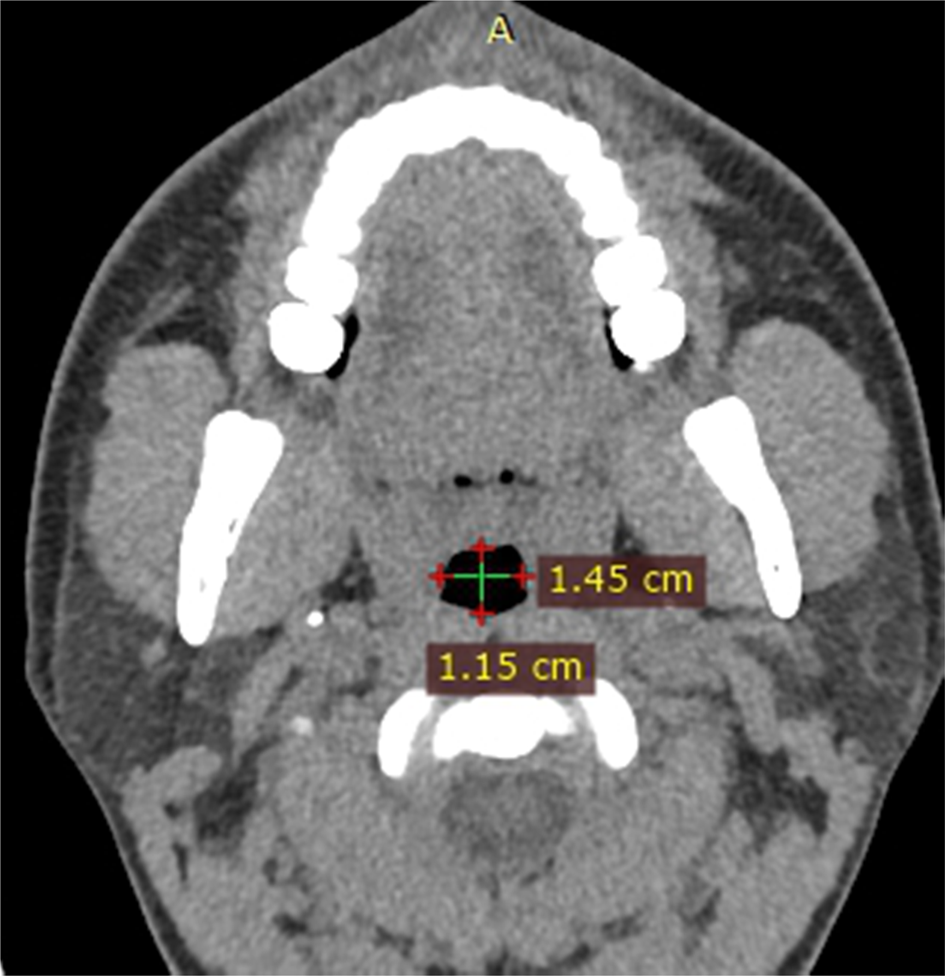
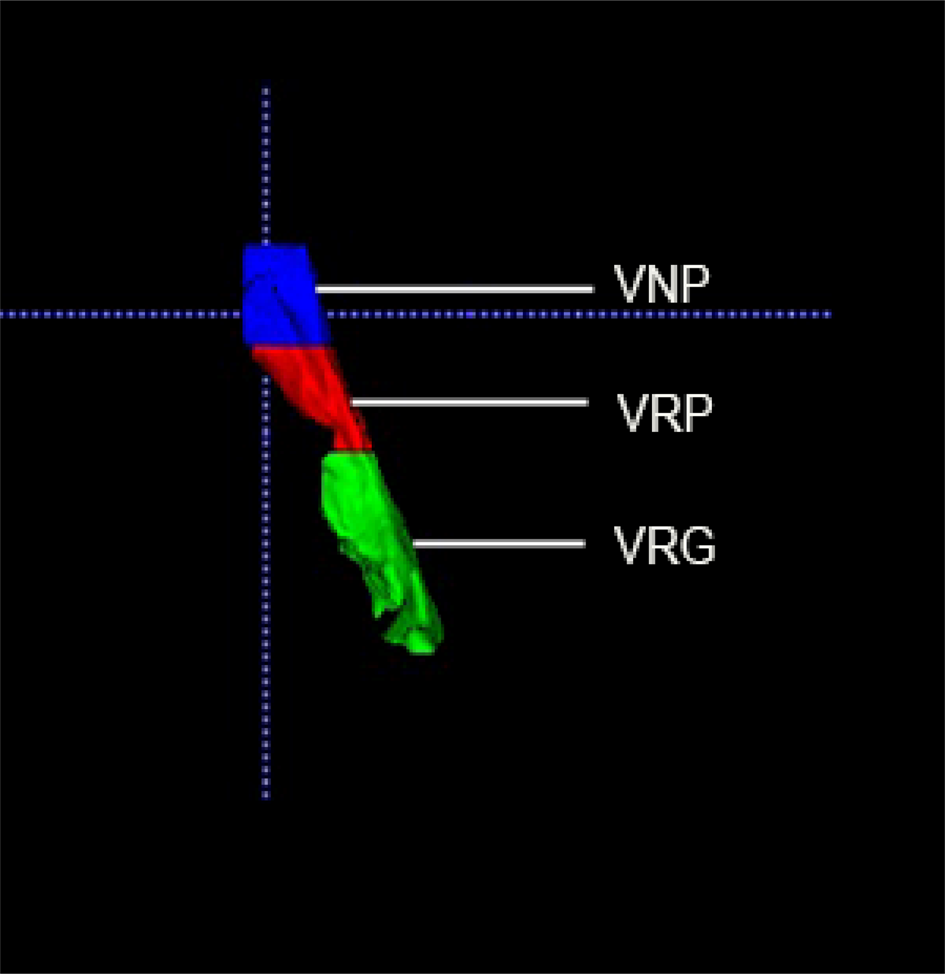
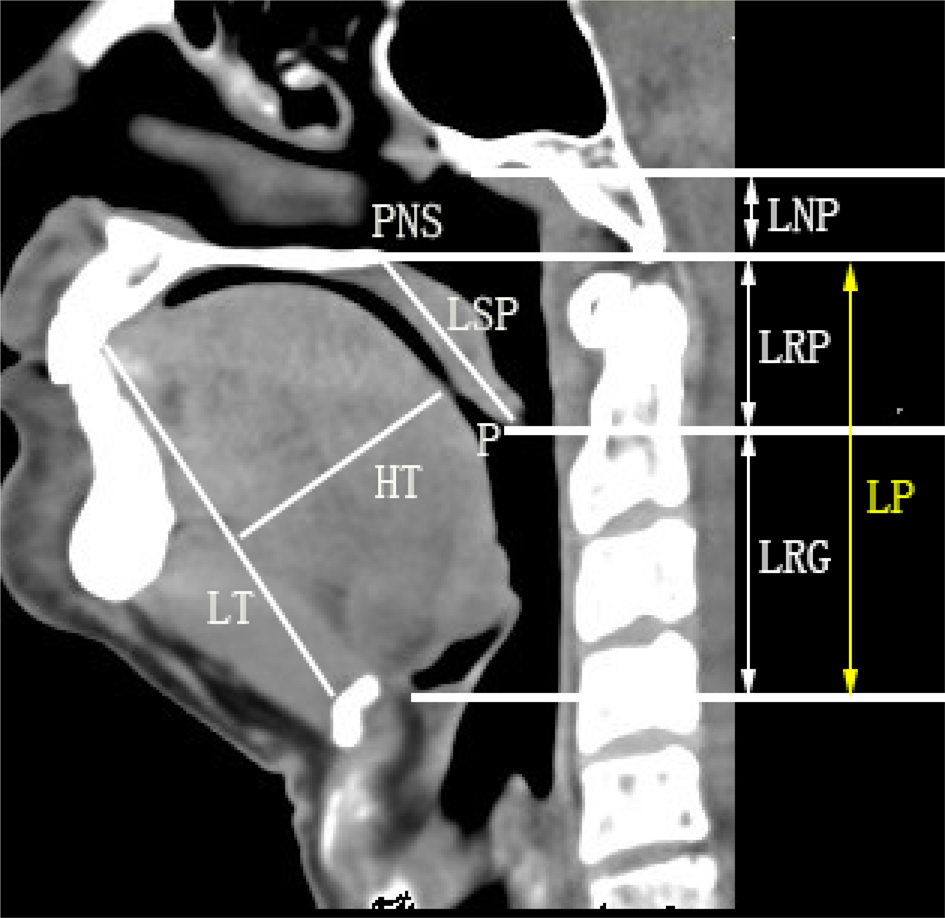
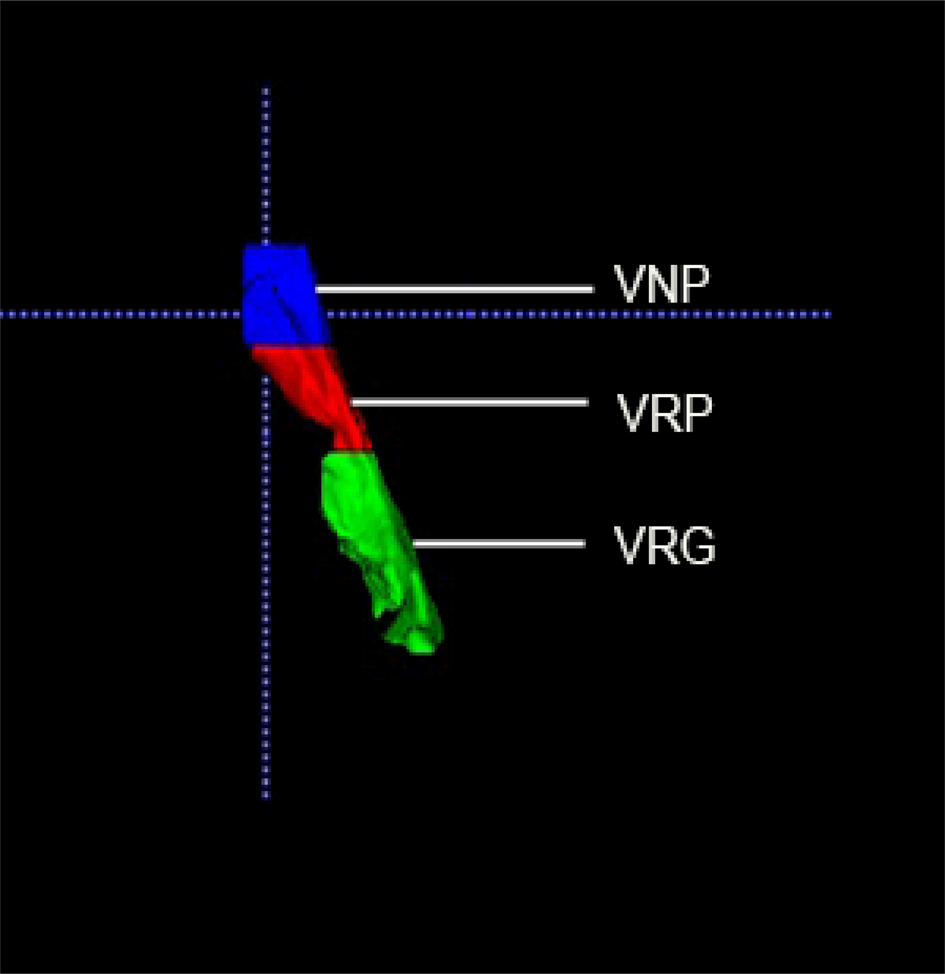
Mimics image processing software version 19.0 (Materialise, Leuven, Belgium) and ITK-SNAP Medical Image Segmentation Tool version 3.6 (Cognitica, Philadelphia, Pennsylvania, USA) were used to measure CT parameters, including the linear dimensions, minimum cross-sectional area in the retropalatal and retroglossal regions, and the minimum anteroposterior width and minimum lateral airway width in the retropalatal and retroglossal regions (Figures 1 and 2). The upper airway shape of retropalatal and retroglossal regions was described by the anteroposterior dimension divided by the lateral dimension respectively. The volumes of the nasopharyngeal, retropalatal and retroglossal regions were measured using a regional growing method (Figure 3). Pharyngeal airway length, which can be divided into the length of the retropalatal region and length of the retroglossal region, was defined by measuring the distance of horizontal lines passing at the level of the hard palate and the epiglottal base (Figure 4).
Axial computed tomography scan of the upper airway showing the minimum cross-sectional area of the retropalatal area. A = anterior

Axial computed tomography scan of the upper airway showing the minimum anteroposterior dimension and lateral dimension at the level of the minimum cross-sectional area of the retropalatal area. A = anterior

Three-dimension reconstruction of the volumes of the nasopharyngeal region (VNP), the retropalatal region (VRP) and the retroglossal region (VRG).
Mid-sagittal computed tomography scan denoting: length of nasopharyngeal region (LNP); length of retropalatal region (LRP); length of retroglossal region (LRG); length of pharyngeal airway (LP), which can be divided to retropalatal length and retroglossal length; length of soft palate (LSP); tip of soft palate (P); posterior nasal spine (PNS); length of tongue (LT); and height of tongue (HT).

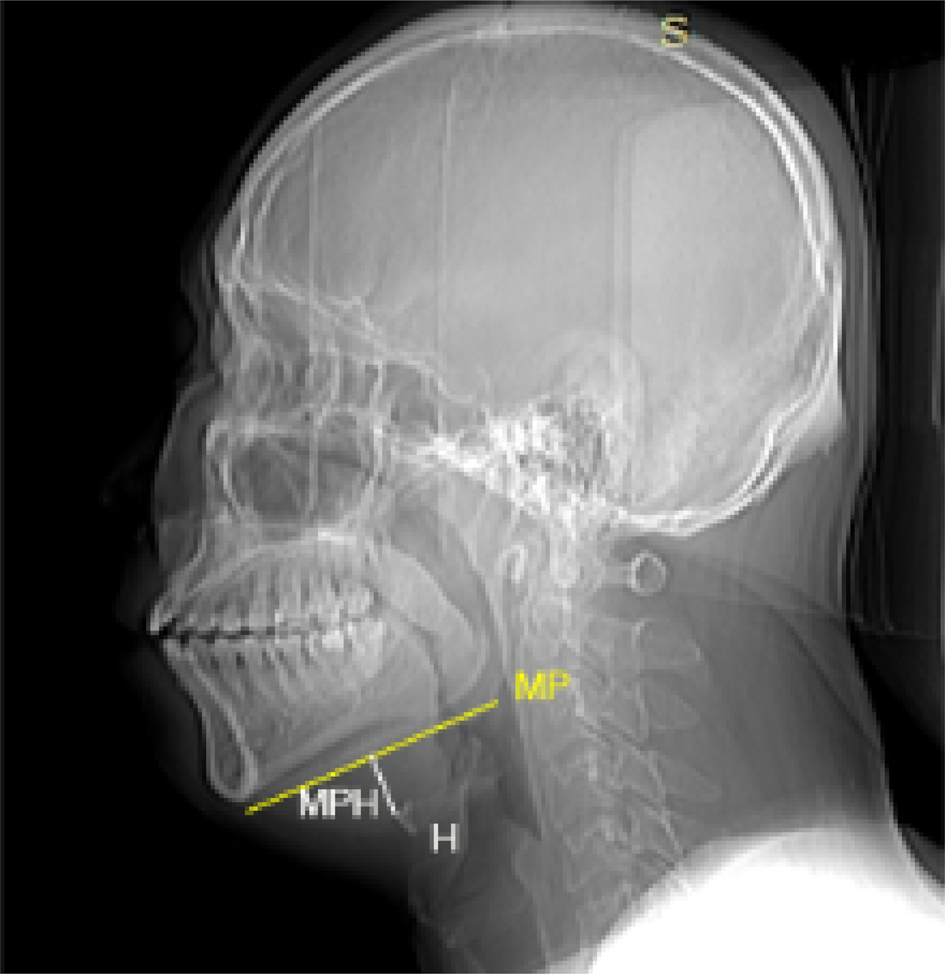
In addition, we calculated the average cross-sectional area of the nasopharyngeal, retropalatal and retroglossal regions by dividing the volume by the length of each region. Soft palate length was defined as the distance from the posterior nasal spine to the soft palate tip. The vertical hyoid position was measured as the perpendicular distance from the hyoid bone to the mandibular plane (Figure 5). Tongue length was the distance between the incisors and the hyoid. Tongue height was the maximum tongue height perpendicular to tongue length. We also measured the volume of the parapharyngeal fat pad, and the cross-sectional area of the parapharyngeal fat pad at the minimum cross-sectional area of retropalatal and retroglossal regions.
Sagittal computed tomography scan showing: hyoid (H); mandibular plane (MP, yellow line); and perpendicular distance from the hyoid bone to the mandibular plane (MPH).

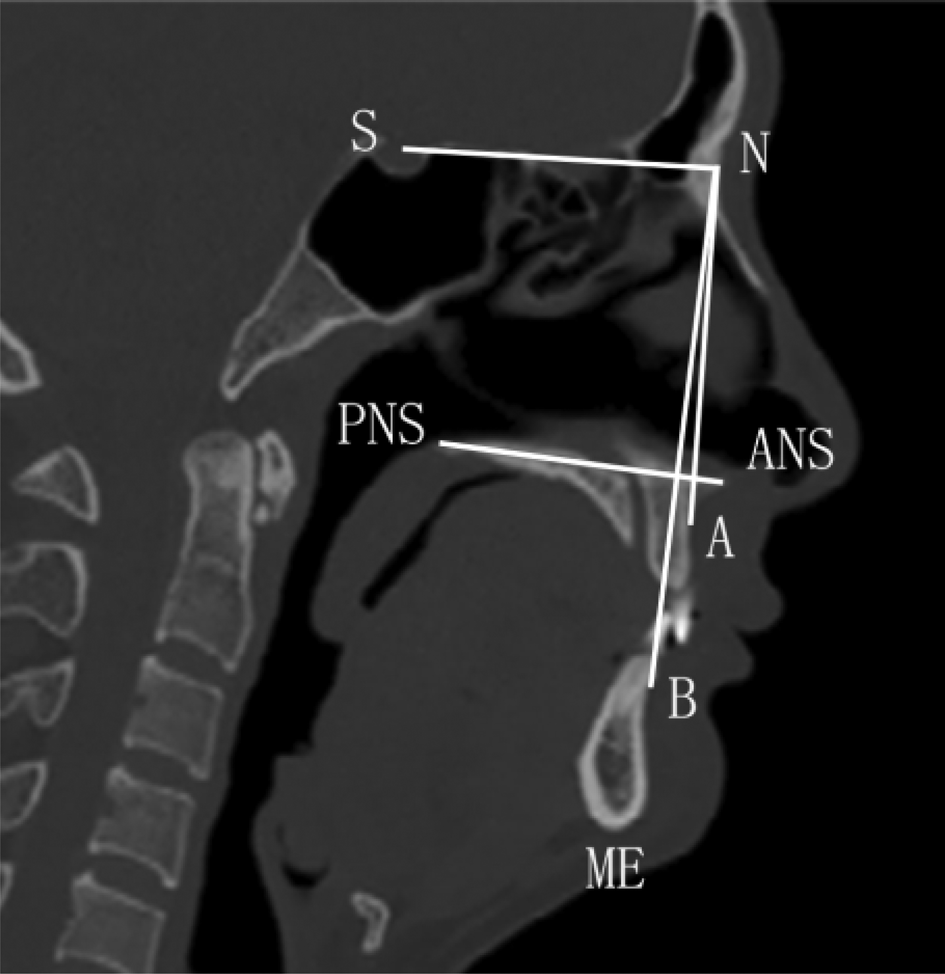
Except for the soft tissue, some of the bony structures were studied through the CT mid-sagittal plane and axial plane. These landmarks and reference lines are shown in Figure 6. The bony box was measured using methods adapted from those of Sutherland et al.Reference Sutherland, Phillips, Yee, Grunstein and Cistulli10
Sagittal computed tomography scan showing a graphical representation of landmarks, reference lines and angle parameters. Landmarks include: subspinale (A); supramentale (B); sella (S), at the centre of the pituitary fossa; nasion (N); anterior nasal spine (ANS); posterior nasal spine (PNS); and menton (ME). Reference line: ‘ANS-PNS’, reflecting the sagittal dimension of the maxilla. Angle parameters include: anteroposterior position of the maxilla relative to the anterior cranial base (S–N–A); anteroposterior position of the mandible relative to the anterior cranial base (S–N–B); and anteroposterior relation of the maxilla and the mandible (A–N–B).

Statistical analysis
After formally testing the data for normality with the Kolmogorov–Smirnov test, Spearman and Pearson methods were adopted in the correlation analysis. Correlation analysis and one-way analysis of variance (ANOVA), was used for data processing if the homogeneity of variance assumptions were satisfied; otherwise, Kruskal–Wallis analysis was employed. Statistical significance was determined using a threshold p-value of 0.05. Analysis was performed using SPSS statistical software (IBM Statistics 24; Armonk, New York, USA).
Results
In all the patients, the soft palate length (r = 0.231, p < 0.05), minimum cross-sectional area in the retropalatal (r = 0.2, p < 0.05) and retroglossal regions (r = 0.277, p < 0.05), lateral dimensions at the levels of the retropalatal region (r = 0.244, p < 0.05) and retroglossal region (r = 0.477, p < 0.05), volume (r = 0.194, p < 0.05) and average cross-sectional area of the nasopharyngeal region (r = 0.192, p < 0.05) were found to significantly increase with ageing, while the upper airway shape got flatter (retropalatal region r = −0.241, p < 0.05; retroglossal region r = −0.305, p < 0.05) with ageing.
We did not find any correlations between ageing and the pharyngeal airway length (r = 0.023, p > 0.05) or the perpendicular distance from the hyoid bone to the mandibular plane (r = 0.053, p > 0.05).
In order to take account of individual differences, patients were further classified according to their BMI and apnoea/hypopnoea index.
Age-related changes according to weight
This section focuses on the upper airway morphology changes associated with ageing in non-obese, overweight and obese patients. Among the patients with a BMI of less than 24 kg/m2 (n = 22), the minimum cross-sectional area in the retropalatal (r = 0.543, p < 0.01) and retroglossal regions (r = 0.584, p < 0.01), the lateral dimensions in the retropalatal region (r = 0.487, p < 0.05) and retroglossal region (r = 0.71, p < 0.01), the anteroposterior dimension in the minimum cross-sectional area in the retroglossal region (r = −0.44, p < 0.05) and the volume of the retropalatal region (r = 0.47, p < 0.05) increased significantly with ageing, but the shape of the retroglossal region (r = −0.789, p < 0.01) became flatter with ageing.
For those patients with a BMI between 24 kg/m2 and 28 kg/m2 (n = 56), the lateral dimension in the minimum cross-sectional area in the retroglossal region (r = 0.263, p < 0.05), the volume (r = 0.356, p < 0.01) and average cross-sectional area of the nasopharyngeal region (r = 0.304, p < 0.05) increased significantly with ageing.
In patients with a BMI greater than 28 kg/m2 (n = 46), the soft palate length (r = 0.432, p < 0.01) and minimum cross-sectional area in the retroglossal region (r = 0.427, p < 0.01) increased significantly with ageing, and the shape of the retroglossal region (r = −0.4, p < 0.01) became flatter with ageing.
Age-related changes according to apnoea severity
This section focuses on the upper airway morphology changes associated with ageing in patients with severe or mild-to-moderate OSA. Among mild-to-moderate OSA patients (n = 26), no significant correlation was found between upper airway morphology and ageing.
Among severe OSA patients (n = 98), the volume of the parapharyngeal fat pad (r = 0.302, p < 0.01) and nasopharyngeal region (r = 0.222, p < 0.05), the soft palate length (r = 0.283, p < 0.01), the minimum cross-sectional area of the retroglossal region (r = 0.409, p < 0.01) and the lateral dimension in the same plane (r = 0.449, p < 0.01), and the lateral dimension in the minimum cross-sectional area of the retropalatal region (r = 0.298, p < 0.01) increased statistically significantly with ageing, whereas upper airway shape became flatter with ageing (retropalatal region r = −0.263, p < 0.05; retroglossal region r = −0.381, p < 0.01).
Upper airway morphology changes by age group
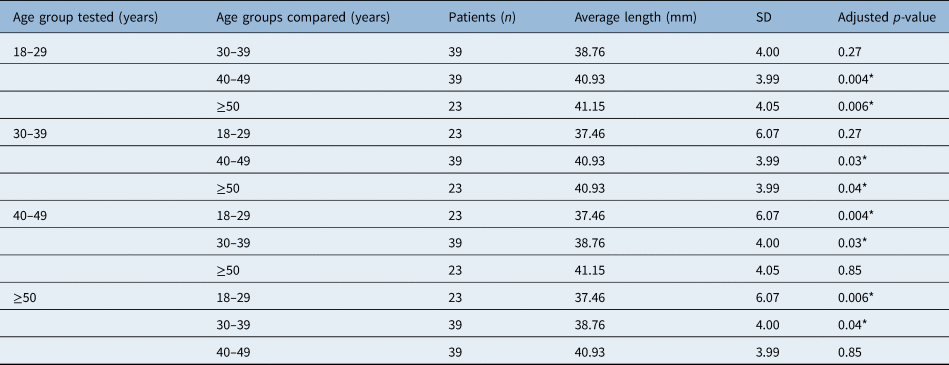
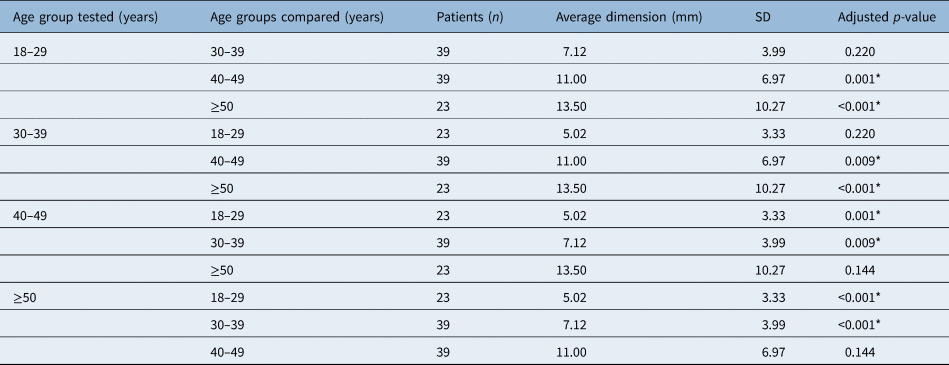
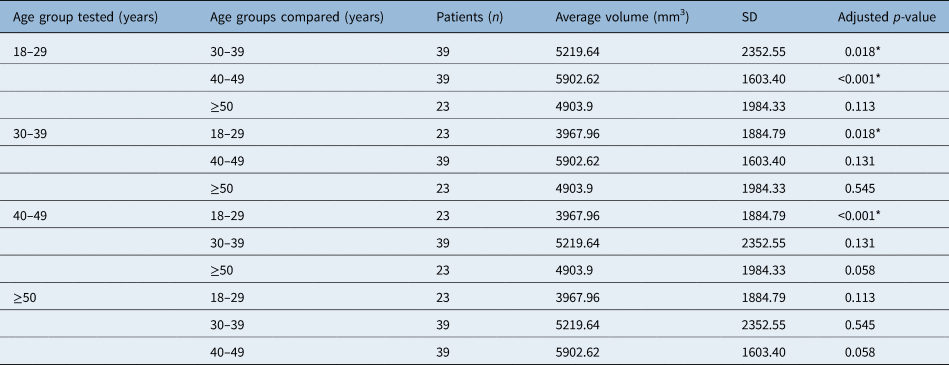
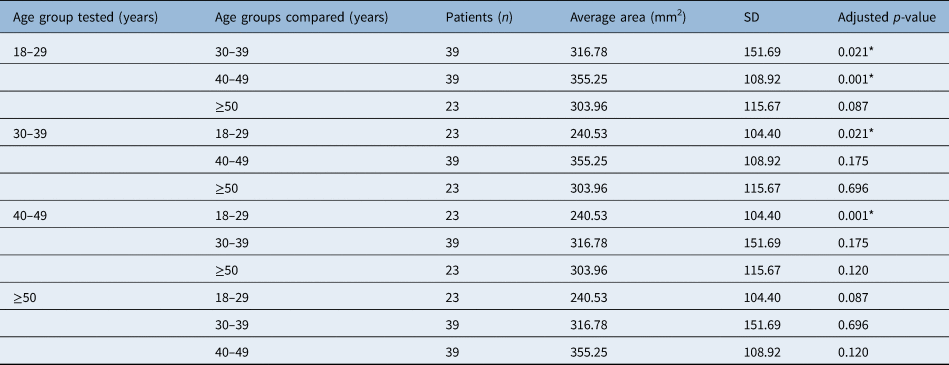
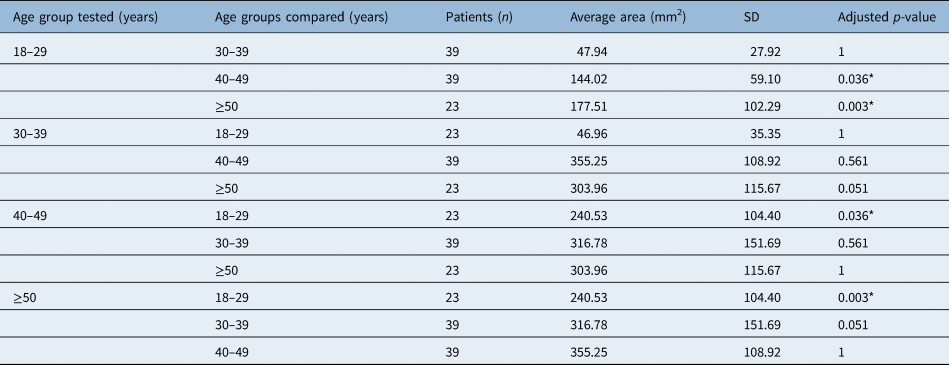
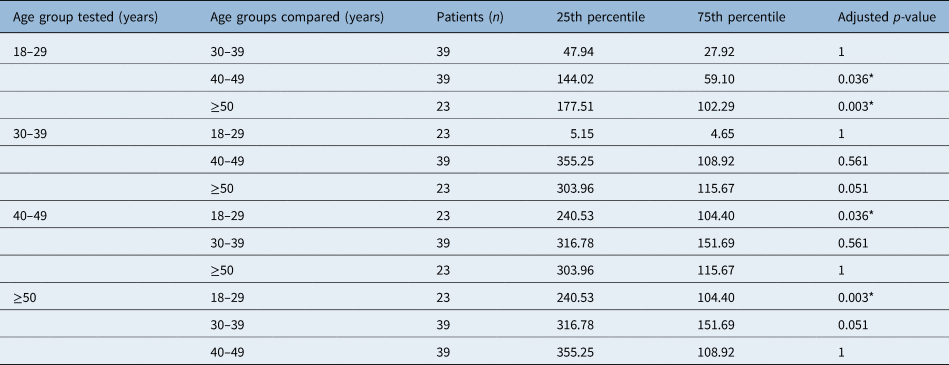
One-way ANOVA and the Kruskal–Wallis test were used to further compare the differences among different age groups. The soft palate length, the minimum cross-sectional area of the retroglossal region and lateral dimension in the same plane, the volume and average cross-sectional area of the nasopharyngeal region, and the shape of the retroglossal region, were found to be significantly different among the age groups (Tables 1–6). However, bony structures such as the maxillomandibular volume, the anteroposterior position of the maxilla relative to the anterior cranial base, the anteroposterior position of the mandible relative to the anterior cranial base, and the anteroposterior relation of the maxilla and the mandible did not significantly differ among age groups.
Comparison of soft palate length between age groups

*Indicates statistical significance (p < 0.05). SD = standard deviation
Comparison of lateral dimension of minimum cross-sectional area in retroglossal region between age groups

*Indicates statistical significance (p < 0.05). SD = standard deviation
Comparison of volume of nasopharyngeal region between age groups

*Indicates statistical significance (p < 0.05). SD = standard deviation
Comparison of average cross-sectional area of nasopharyngeal region between age groups

*Indicates statistical significance (p < 0.05). SD = standard deviation
Comparison of minimum cross-sectional area in retroglossal region between age groups

*Indicates statistical significance (p < 0.05). SD = standard deviation
Comparison of shape of retroglossal region between age groups

*Indicates statistical significance (p < 0.05).
Discussion
The main findings of our study were that, among OSA patients, the lateral dimension of the minimum cross-sectional area in the retropalatal and retroglossal regions, the minimum cross-sectional area in the retroglossal region, and the volume of the nasopharyngeal region increased with age, while the shape of the retroglossal region got flatter with ageing, independently of BMI and apnoea/hypopnoea index. However, in a more detailed analysis, when the effect of ageing on the volume of the parapharyngeal fat pad and the soft palate length was evaluated in terms of OSA severity categories (mild, moderate and severe), ageing was found to have a significant positive correlation with both indicators among severe OSA patients. Furthermore, the volume of the retropalatal region increased with ageing among non-obese patients (BMI of less than 24 kg/m2), the volume and average cross-sectional area of the nasopharyngeal region increased with ageing among patients with a BMI between 24 kg/m2 and 28 kg/m2, and the soft palate length increased with ageing among patients with a BMI of more than 28 kg/m2. Our long-term goals are to assess the upper airway anatomical features of OSA patients of different ages combined with their non-anatomical features, for precise treatment and intervention.
There have been many studies on the age-related changes in the upper airway morphology in healthy people,Reference Burger, Stanson, Sheedy, Daniels and Shepard11–Reference Malhotra, Huang, Fogel, Lazic, Pillar and Jakab17 but the results of studies were short of unanimous. Furthermore, few studies had concentrated on the upper airway morphology in adult OSA patients. To our knowledge, this is the first study to focus on the ageing effect in Chinese OSA patients.
In our whole sample of patients, soft palate length increased with ageing, which confirms previous results.Reference Malhotra, Huang, Fogel, Lazic, Pillar and Jakab17–Reference Lim, Lee, Han and Kwon19 The average (± SD) soft palate length was 39.65 ± 4.63 mm, which is similar to previously reported values,Reference Julia-Serda, Perez-Penate, Saavedra-Santana, Ponce-Gonzalez, Valencia-Gallardo and Rodriguez-Delgado20–Reference George, Chung, Nielsen, Goldberg, Miller and Kezirian22 thereby demonstrating the reliability of our research. In the upper airway, the retropalatal region is the most collapsible area, independently of disease severity.Reference Trudo, Gefter, Welch, Gupta, Maislin and Schwab23 We hypothesise that, except for the ageing effect that reduces the soft palate muscle tone, long-term vibration and intermittent hypoxia may aggravate the procedure, which increases the collapsibility of the upper airway.
In our study, the volume of the retropalatal region was found to increase with ageing among non-obese patients (BMI less than 24 kg/m2), and the volume of the nasopharyngeal region increased with ageing among patients with a BMI between 24 kg/m2 and 28 kg/m2. To the best of our knowledge, there have been no similar previous reports. Increased soft palate length and shrinkage of the tonsils with ageing may be the factors that influence the volume of the retropalatal region. Increased volume of the nasopharyngeal region with ageing has been reported in healthy Chinese participants,Reference Li, Gao and Zeng24 which is consistent with our findings. More research is needed to confirm whether this increase is a consequence of OSA or of the natural ageing process.
In the retropalatal and retroglossal regions, the minimum cross-sectional area and lateral dimensions increased with ageing, which was inconsistent with our hypothesis. In healthy participants, the relationship between the upper airway calibre and age is controversial. The possible explanation is that some of the studies made the diagnosis based on snoring history instead of on polysomnography findings, which may have resulted in some undiagnosed patients being included in these investigations.Reference Burger, Stanson, Sheedy, Daniels and Shepard11–Reference Malhotra, Huang, Fogel, Lazic, Pillar and Jakab17
• The natural course of upper airway morphology is different in patients with obstructive sleep apnoea (OSA)
• The minimum cross-sectional area in retropalatal and retroglossal regions increased with ageing in our cohort
• The upper airway of patients with OSA has a tendency to become tabular
• Soft palate length increased with ageing, and the correlation was enhanced with increasing body mass index
• Parapharyngeal fat pad volume increased with ageing among severe OSA patients (apnoea/hypopnoea index ≥30 events per hour)
• Non-anatomical factors may play a more important role in the pathogenesis of aged OSA patients
The reasons for the age-related increases in minimum cross-sectional area and lateral dimensions in our research may be as follows. First, the tonsils continue to shrink with ageing and the pharyngeal calibre increases. Second, long-term vibration and intermittent hypoxia may lead to changes in soft palate morphology, and therefore the minimum cross-sectional area of the retropalatal region increases. Third, compensation of the upper airway dilator muscle while awakening, as well as decreased elasticity of tissue with ageing, result in an increase in diameter. In addition, the shapes of the retropalatal and retroglossal regions were found to become flatter, as was reported in healthy participants,Reference Ciscar, Juan, Martinez, Ramon, Lloret and Minguez25 which may be a compensatory state while awake. Furthermore, the volume of the parapharyngeal fat pad increased significantly with ageing among severe OSA patients, and the correlation increased with rising BMI. It has been hypothesised that the parapharyngeal fat pad, which may compress the upper airway, plays an important part in the pathogenesis of sleep apnoea.Reference Welch, Foster, Ritter, Wadden, Arens and Maislin26 However, our mean cross-sectional area did not decrease with ageing, which was inconsistent with prior research.Reference Martin, Mathur, Marshall and Douglas16 We suspect that increased activity of the upper airway dilator during wakefulness and different lung volumes played a major role.
We found no relationship between ageing and the pharyngeal length or the perpendicular distance from the hyoid bone to the mandibular plane. In a previous studyReference Martin, Mathur, Marshall and Douglas16 that focused mainly on the age-related effects on pharyngeal morphology, ageing was found to be positively correlated with increased soft palate length and pharyngeal airway length in females rather than males. On the other hand, in healthy persons,Reference Carlisle, Carthy, Glasser, Drivas, McMillan and Cowie27 pharyngeal airway length, especially the length of the retropalatal region, was found to be positively correlated with ageing, but the perpendicular distance from the hyoid bone to the mandibular plane was not correlated with ageing. This is probably because the differences between patients while awake were too small to obtain positive results. Moreover, OSA is a multifactorial disease, and anatomical factors only account for part of it. Finally, a previous studyReference Genta, Schorr, Eckert, Gebrim, Kayamori and Moriya28 showed that the size of the tongue may affect the hyoid location, which further influences the pharyngeal airway length. In our cohort, there was no difference in the tongue length, the tongue height or the cross-sectional area of the tongue in the mid-sagittal plane between different age groups, which may explain why the perpendicular distance from the hyoid bone to the mandibular plane did not correlate with ageing.
There were no correlations between bony structure and ageing, and no significant differences among different age groups. In a prior study, OSA patients were believed to have retroposed mandibles, and retroposition of the maxilla compared to normal subjects which is more commonly reported in non-obese patients. In our cohort, all participants were OSA patients, and most of our patients were overweight, which may have affected the results.Reference Miles, Vig, Weyant, Forrest and Rockette29,Reference Nelson and Hans30
The present study has several limitations. First, the sample size was small and we did not have a control group for further comparison. As this research was retrospective, we were not able to give the healthy controls a CT scan; moreover, it would not be ethical for healthy persons without symptoms to undergo a CT scan. As the radiation dose of consecutive CT scans would have serious underlying consequences for the thyroid, magnetic resonance imaging (MRI) will be considered for our future research.
Second, there may have been selection bias because of individual differences in our patients; however, we matched the patients based on BMI and apnoea/hypopnoea index to minimise this. Beyond that, in order to avoid differences between sexes, female patients with OSA were not included in our research because some of the upper airway structures, such as the upper airway length, the size of the soft palate and the tongue have been reported to be smaller in female patients with OSA.Reference Thurnheer, Wraith and Douglas31,Reference Lin, Davidson and Ancoli-Israel32 In addition, the prevalence of female patients with OSA increases after menopause, which is different from male patients with OSA.Reference Young, Finn, Austin and Peterson33,Reference Bixler, Vgontzas, Lin, Ten Have, Rein and Vela-Bueno34
Third, the patients were studied during wakefulness instead of during sleep, which is another limitation of our retrospective study. It is possible that upper airway morphology may be different during sleep from that described in the present study; however, we captured the static upper airway morphology at the end of expiration, which has good predictive ability for OSA severity according to prior studies.Reference Chousangsuntorn, Bhongmakapat, Apirakkittikul, Sungkarat, Supakul and Laothamatas35,Reference Chen, Lin, Chuang, Cistulli, Hsieh and Kao36 Furthermore, we tried to simulate the natural ageing process of upper airway morphology instead of locating the obstructive sites during sleep. Finally, we cannot definitively conclude that the pharyngeal calibre enlarges with ageing in OSA patients because of our cross-sectional design.
The present study provides an insight into anatomical changes in the upper airway of OSA patients associated with ageing. It provides a new perspective for further research, including longitudinal studies to examine natural changes occurring in the upper airway anatomy. Advanced non-invasive methods, such as MRI, should be considered to assess the metabolic state in the pharyngeal musculature.
In conclusion, with the progression of OSA and ageing, the morphology of the soft tissue of the upper airway changes, resulting in a longer soft palate, a flatter upper airway, a larger minimum airway cross-sectional area and greater lateral dimensions of the upper airway. We speculate that as the morphology of aged patients’ upper airway changes, non-anatomical factors may become more responsible for the pathogenesis of the disease. Future studies should focus on comparing the differences between carefully matched OSA patients and healthy participants regarding the ageing effect on upper airway structure, aiming to identify the morphological changes caused by the disease instead of by ageing.
Acknowledgements
This research was supported by the National Natural Science Foundation of China (grant number: 81970866), the Beijing Municipal Administration of Hospitals’ Mission Plan (grant number: SML20150201) and the Beijing Municipal Administration of Hospitals’ Youth Programme (grant number: QMS20190202).
Competing interests
None declared