Implications
Post-calving health problems are associated with decreased milk yield, reduced reproduction and increased culling rate. It is therefore important to find sick cows in the herd. Based on differences in behaviour and performance variables measured by existing commercial sensors, a model to detect post-calving health problems was developed and validated on a commercial dairy farm. On large farms, where the farmer has only limited time to bring individual animals to the veterinarian, the model presented in this paper can serve as a practical tool to give the farmer information about the cows’ health status that can minimize the numbers of cows to fetch for veterinary inspection only to those that have a high likelihood of being sick.
Introduction
Early lactation is a sensitive period in the life cycle of dairy cows, during which most health problems occur (Ingvartsen, Reference Jacobs and Siegford2006). After calving, cows experience a negative energy balance due to metabolic and hormonal changes, along with rapidly increasing milk production, increasing nutrient demand (Ingvartsen, Reference Jacobs and Siegford2006) and social stressors – that is, hierarchical disturbances of socially inferior and/or superior cows – due to transfer from the dry to the lactating group (Mulligan and Doherty, 2008).
These changes and stressors, in addition to the calving event itself, provide fertile grounds for post-calving health problems. Ketosis and metritis are common in dairy cows in early lactation (Bar and Ezra, Reference Bar and Ezra2005), and are associated with decreased milk yield (Fourichon et al., Reference Fourichon, Seegers, Bareille and Beaudeau1999; Edwards and Tozer, Reference Edwards and Tozer2004; Huzzey et al., Reference Ingvartsen2007), decreased reproductive performance (Opsomer et al., Reference Rajala-Schultz, Grohn and McCulloch2000; Walsh et al., Reference Winter and Hillerton2007) and increased culling rate (Dubuc et al., Reference Dubuc, Duffield, Leslie, Walton and LeBlanc2011).
In contrast to conventional milking parlours, a milking robot allows the cows more freedom to control their daily activities and rhythms (Halachmi et al., Reference Halachmi, Edan, Moallem and Maltz2000a and Reference Halachmi, Metz, Maltz, Dijkhuizen and Speelman2000b; Halachmi, Reference Halachmi2004; Jacobs and Siegford, Reference Ketelaar de Lauwere, Devir and Metz2012). The cows on a farm with milking robots are typically calmer and more ‘independent’ – that is, herd synchronization with respect to lying, feeding and milking is reduced (Winter and Hillerton, Reference Witten and Frank1995; Ketelaar de Lauwere et al., Reference Kolbach, Kerrisk, Garcia and Dhand1996). Therefore, compared with a conventional milking parlour, separation of a single sick cow from the herd under milking-robot conditions is more complex, because searching for a sick cow and walking it through the cowshed is time-consuming and disturbs the other cows’ routine (Halachmi, Reference Halachmi, Adan, van der Wal, Hesterbeek and van Beek2009).
Awareness of post-calving diseases in Israel has led to a national routine in which all cows are presented to the veterinarian after calving to be inspected for post-calving health problems. The suspected cows are treated and presented for a second inspection the following week. On the one hand, this routine ensures that all post-calving cows with health problems are treated within a period of not longer than 10 to 11 days after calving; on the other, healthy cows are also examined by the veterinarian. This routine results in additional work for both the farmer and the veterinarian, and disturbance to the healthy cows. The proposed model may be beneficial to search to only fetch cows suspected of having health problems in order to keep the workload of fetching and the associated disturbances to a minimum.
Obviously, with a milking robot, after-milking separation gates do not provide a timely solution as in a conventional dairy. Therefore, in dairies with milking robots, detection of post-calving health problems is important because (1) it minimizes the number of cows that are fetched and presented to the veterinarian (i.e. to only the sick cows), and (2) early detection of reduced health leads to timely intervention and ultimately healthier cows.
Today, on farms with robotic milking, a variety of sensors provide frequent and detailed information on performance and behaviour of each individual cow (Halachmi, Reference Halachmi2004 and Reference Halachmi, Adan, van der Wal, Hesterbeek and van Beek2009; Halachmi et al., Reference Halachmi, Maltz, Livshin, Antler, Ben-Ghedalia and Miron2011; Jacobs and Siegford, Reference Ketelaar de Lauwere, Devir and Metz2012; Kolbach et al., Reference Maltz2012; Clark et al., Reference Clark, Farina, Garcia, Islam, Kerrisk and Fulkerson2016). Before the introduction of these sensors, this information could not be obtained with the older management and milking systems (Spahr and Maltz, Reference Steensels, Bahr, Berckmans, Halachmi, Antler and Maltz1997).
Health problems are associated with reductions in activity (Edwards and Tozer, Reference Edwards and Tozer2004; Walker et al., Reference Walsh, Walton, Kelton, LeBlanc, Leslie and Duffield2008; Chapinal et al., Reference Chapinal, de Passille and Rushen2010), rumination (Hansen et al., Reference Huzzey, Veira, Weary and von Keyserlingk2003; DeVries et al., Reference DeVries, Beauchemin, Dohme and Schwartzkopf-Genswein2009), milk yield (Fourichon et al., Reference Fourichon, Seegers, Bareille and Beaudeau1999; Rajala-Schultz et al., 1999) and BW (Maltz, Reference Miron, Yosef, Nikbachat, Zenou, Maltz, Halachmi and Ben-Ghedalia1997). Therefore, incorporating these available sensors to detect the activity reduction that is indicative of disease is advised.
The objectives of this study were to develop and apply a mathematical model to detect post-calving health problems in robotically milked dairy cows based on the sensors available in robotic-milking farms measuring individual cows’ rumination times, activity, milk yield, BW and visits to the milking robot.
Material and methods
This study was built on a comparison of the veterinarian’s diagnosis with the prediction of a new model. This study was performed in three phases: (a) development of the tree-based decision-making model, (b) model validation – confusion matrix and receiving operating characteristic (ROC) curves, (c) model implementation on a dairy farm – half of the cows were treated based on the model (‘model-based decision’ (MBD)) and the other half followed the normal farm routine (veterinarian decision (VD)).
Animals and facility
The trial was conducted on a commercial Israeli farm in Kibbutz Yesodot with a herd of 250 Israeli-Holstein dairy cows. All cows were fed the same total mixed ratio (TMR) according to recommendations (NRC, Reference Opsomer, Grohn, Hertl, Coryn, Deluyker and de Kruif2001). The feed was distributed twice daily. The average annual milk production was 11 500 kg/cow. The cows were milked in one of five milking robots (Astronaut 3, Lely NV, Maassluis, The Netherlands), a single robot per group. One group consisted of primiparous cows, and the other four groups were of multiparous cows that were assigned after calving to milking groups with the milking robot on the side of the barn where they had been dried off. The cows were housed year-round in fully roofed, open cowsheds with dried manure (compost) bedding, which is the common dairy housing in Israel. The stocking density was about 20 m2/ cow. Cows could move freely in the cowshed (free cow traffic, see Halachmi, Reference Halachmi2004).
The farm veterinarian, from the main cattle veterinary organization in Israel Hachaklait Veterinary Services Ltd (http://www.hachaklait.org.il/en/), performed a routine weekly investigation (on Sundays) of all cows between 5 and 12 days after calving for ketosis and metritis. For ketosis detection, all cows were checked with a Ketostix strip (Bayer Corporation, Leverkusen, Germany), which detects acetoacetate (AcAc) in urine samples. A cow was considered ketotic when the Ketostix test result was higher than 1 470 μmol AcAc/l or 15 mg AcAc/dl. Metritis was checked by rectal examination of the uterus. Criteria were size and tonus of the uterus and discharge appearance. A smelly watery discharge with a dark colour was indicative of medium metritis, and severe metritis was diagnosed when the cow also had a fever. Light metritis was defined as an unusual discharge with enlarged uterus. All sick cows were treated after diagnosis.
Database building, sensors and software
The calibration data set was collected over 10 months from June 2012 to March 2013. In the implementation phase, multiparous cows were monitored between April 2013 and November 2014, 88 VD cows and 68 MBD cows, for a total of 156 cows.
All cows were equipped with a neck collar with an SCR HR monitoring system (SCR Ltd, Netanya, Israel). The SCR tag had three functions: (1) cow identification; (2) animal-activity monitoring and (3) rumination-time monitoring.
Activity measurement was based on signal analysis of the neck movements, and was expressed by a filtered activity index ranging from 0 to 255 units per 2 h. Rumination time was based on analysis of the distinctive sounds of rumination recorded by a microphone (Schirmann et al., Reference Spahr and Maltz2009). Rumination time was expressed as min/24 h, and could also be presented for 2-h intervals.
Milk yield, milking duration, concentrate feed intake, visits to the milking robot and BW were recorded with the milking-robot management software (T4C, Lely NV). Data analysis (such as slopes of lactation curves) was performed using dedicated MatLab software (Coleman et al., Reference Coleman, Branch and Grace1999; Anonymous, 2001 and 2008).
Disease incidence, reproductive and culling information were recorded using a dairy herd management program (NOA, ICBA, Caesarea, Israel). Diagnosis, treatment and dosage were recorded for each disease onset.
Model development
A decision-tree model was developed based on 10 months of historical data (June 2012 to March 2013). This time period was therefore used as the calibration data set with 35 sick (ketosis and/or metritis) and 76 healthy cows, each of which was analysed for the first 21 days in milking (DIM) after calving. A decision tree consists of nodes at which a variable is tested (Witten and Frank, Reference Halachmi2005). A variable can be a nominal or numerical value and in the latter case, the test usually determines whether the variable’s value is greater or less than a predetermined constant, resulting in a two-way split. A variable is selected to split the data set at the first node (root node). For each possible test outcome at the node, a branch is made ending in a daughter node. The process can be repeated recursively for each branch, using only those records that actually reach the branch. If-at any time-all records at a node have the same classification, that part of the tree stops developing (Witten and Frank, Reference Halachmi2005).
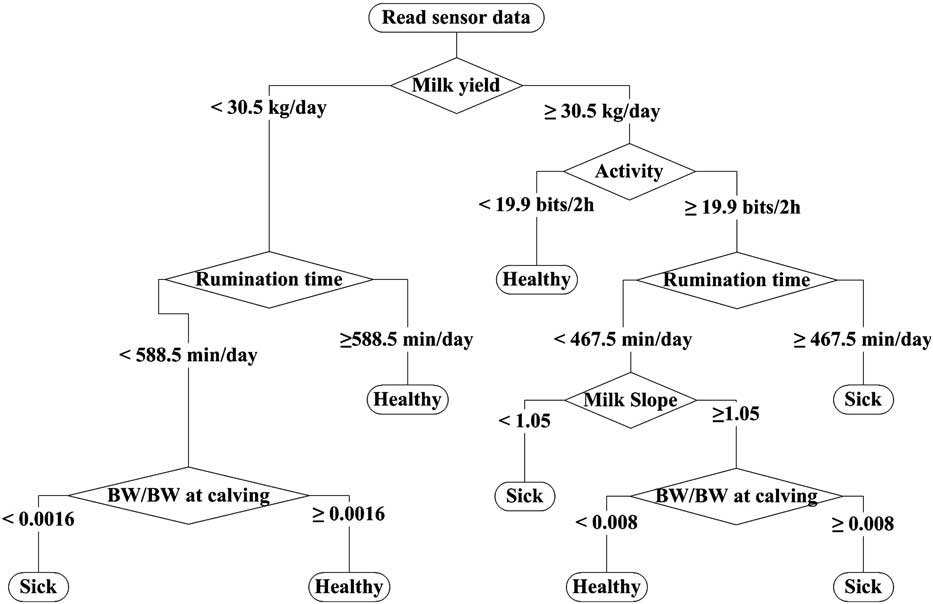
Our regression tree was based on the input variables such as (1) milk yield, (2) milk slope, (3) activity, (4) rumination, (5) visits to the milking robot, (6) BW relative to BW at calving. The tree computed the probability of each cow being healthy or sick. The probability was translated to a binary outcome: sick–healthy. The binary outcome was compared with the veterinarian’s diagnosis. The tree was implemented by applying the ‘tree function’ in MatLab software (Anonymous, 2008).
The threshold used by the decision tree to classify a cow as sick was, by default, 50% probability of being sick. Figure 1 shows the construction of the decision-tree model.
Decision-tree model development. The model input variables were milk yield, cow activity, rumination time, number of visits to the milking robot and BW relative to BW at calving. During the calibration process, the reference was the veterinarian’s diagnosis, translated to a binary outcome: sick–healthy. The decision tree classified each cow in a category – sick or healthy.

Model validation
For model validation, the VD cows were analysed by the model despite the fact that they were all presented to the veterinarian. In other words, the model validity was checked from two independent viewpoints: (1) by presenting only those cows that the model classified as sick to the veterinarian, and evaluating the results of this strategy in terms of health and performance throughout the lactation, and (2) by comparing the veterinarian’s decisions to the model evaluation.
Confusion matrices
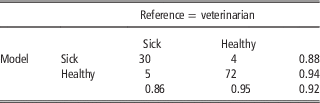
Confusion matrices were used to evaluate the classification model output against the reference output (Fielding and Bell, Reference Fielding and Bell1997). In the confusion matrices, five classification measures were presented in the bottom row (sensitivity and specificity; left to right) and the last column (positive predictive power, negative predictive power and accuracy or correct classification rate; top to bottom). All five classification measures were based on the number of true positives, true negatives, false positives and false negatives.
The accuracy of the decision-tree model was 92%, the sensitivity was 86% and the specificity was 95% (Table 1).
Confusion matrix of decision-tree model with 76 healthy and 35 sick cows based on the calibration data setFootnote 1

1 The calibration data set was collected over 10 months from June 2012 to March 2013.
Receiving operating characteristic curves
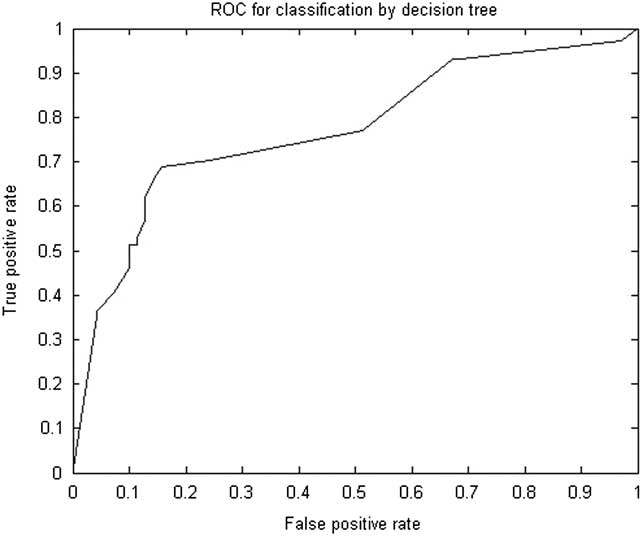
ROC curves were constructed to visualize the performance of the developed decision-tree models (Detilleux et al., Reference Detilleux, Arendt, Lomba and Leroy1999; Witten and Frank, Reference Halachmi2005). Data used to create the ROC curves were based on the probability of a cow being sick compared with the veterinarian’s diagnosis.
With the ROC curve, the true positive rate (sensitivity) is plotted as a function of the false positive rate (1-specificity) over the whole range of possible threshold values (Detilleux et al., Reference Detilleux, Arendt, Lomba and Leroy1999). In this study, the discrimination threshold was based on group-level comparisons of individuals. A common method to compare classifiers is to calculate the area under the ROC curve (AUC). A diagnostic test is usually classified as excellent (AUC=0.9 to 1), good (AUC=0.8 to 0.9), fair (AUC=0.7 to 0.8), poor (AUC=0.6 to 7) or fail (AUC=0.5 to 0.6).
Model implementation in the dairy farm
In the model-implementation phase, the cows were randomly assigned according to calving dates to one of the validation protocols: (1) VD and (2) MBD. VD is the common practice in Israel and it was therefore used as the control data set. The VD was compared with the MBD by means of the ROC curve and confusion matrix. The distribution of lactation numbers between the two groups was similar and ranged from parity 2 to 6. The MBD and VD were applied on data from cows between 5 and 12 days after calving. In the MBD, the model was actively used. When the model indicated that a cow had a high (>0.5) probability of being sick, the cow was brought to the veterinarian; a cow with a low (<0.5) model-indicated probability of being sick was not brought to the veterinarian.
On this farm, the farmer’s decision-making frequency is once per week, right before the veterinarian’s weekly visit. Every Sunday, data were extracted from the farm computer and the model was applied on the new data. For the MBD group only, a list of cows that were up to 21 days after calving with their respective probability of being sick was sent to the veterinarian. This was done a few hours before the veterinarian arrived to give the farmer time to bring the cows that need a check-up to the treatment pen.
Statistical analysis
All data editing and analyses were performed using SAS version 9.3 (SAS Institute, Reference Schirmann, von Keyserlingk, Weary, Veira and Heuwieser2006). Results were considered to be of statistical significance if the relevant P-value was ⩽0.05.
A three-stage approach to statistical analysis of the data was implemented. First, descriptive statistics were used to describe measures of location and variability of variables included in the study by means of frequency tables and histograms. Hereafter, univariable analysis was performed in order to identify associations between the different outcomes of interest and the treatment groups. For this purpose, χ 2 tests were used for categorical outcomes and the Student’s t test was used for continuous variables. Finally, outcomes that were found to be associated with treatment group at a significance of P<0.15 in the univariable analysis were used in a multivariable analysis. For the latter, a logistic regression model was used for dichotomous outcomes and a linear regression model with a marginal effect was used for continuous outcomes (i.e. milk production). Particularly, the following model was used:
 $$\eqalignno{ Y\,{\rm {\equals}}\,\,& {\rm parity \,\,group}\,\left( {{\rm 2}\,{\rm index}\,{\rm variables}} \right)\,\cr{\rm {\plus}}\,{\rm month}\,{\rm in}\,{\rm milk}\,\left( {{\rm 3}\,{\rm index}\,{\rm variables}} \right)\,{\rm {\plus}}\,{\rm treatment} \cr {\rm group}\,\left( {{\rm 2}\,{\rm index}\,{\rm variables}} \right)\,{\rm {\plus}}\,{\rm month}\,{\rm in}\,{\rm milk}\,\cr{\times}\,{\rm treatment}\,{\rm group}\,{\rm {\plus}}\,e $$
where Y is the mean milk production (kg) for a particular day in the first 3 months of lactation, month in milk, treatment group and the interaction between the two latter are dependent variables and e a complex error term representing the within-cow correlation of test-day milk measurements and the residual error. The covariance structure chosen for the
R
(error) matrix was autoregressive, that is
 $$\left( {\sigma ^{2} \rho ^{{\left| {i{\minus}j} \right|}} } \right)$$
.
Multivariable analysis using a linear regression model was then performed. Treatment group and parity group were forced into the model, whereas other known confounders were considered and manually entered into the model, but remained only if P<0.1. Milk production curves for the first 3 months in milk were then constructed by plotting the estimated least squares means of the effect. Significance of the effects was determined using the F test PROC MIXED function (SAS Institute, Reference Schirmann, von Keyserlingk, Weary, Veira and Heuwieser2006).
Results
Model validation
Receiving operating characteristic curve
The model’s ability to serve as a disease classifier was tested by ROC-curve analysis (Figure 2). The AUC was 0.78. The discriminating threshold for best model performance was found to be 60% probability of being sick. As there were no cows with a probability of being sick between 50% and 60%, setting the threshold at the default of 0.5 showed the same classification results in the confusion matrices.
Receiving operating characteristic (ROC) curve for classification by decision tree. The true positive rate (sensitivity) is plotted as a function of the false positive rate (1-specificity) over the whole range of possible threshold values.

Model implementation on the farm
The number of cows in the VD and MBD groups was 88 and 68, respectively. Parity number was comparable between the two groups (P Fisher’s exact test=0.71): the MBD group had 38% parity two cows and the VD had 30% parity two cows.
Confusion matrices
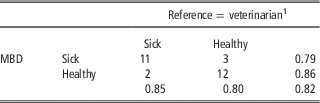
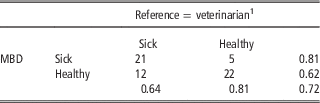
Tables 2 and 3 show the confusion matrices for the two parity groups of VD cows. Table 2 suggests a model accuracy of 82%, a specificity of 80% and a sensitivity of 85% compared with the veterinarian’s diagnosis for parity two cows. For cows of parity three or more (Table 3), the accuracy was 72%, specificity was 81% and sensitivity was 64% (Table 3). The results were better for parity two cows than for cows of parity three or more.
Parity two cows decision-tree model validation with 15 healthy and 13 sick run on veterinarian decision (VD)Footnote 1 cows

Data collected during the farm implementation period – April 2013 to November 2014.
1 VD group (v. model-based decision (MBD) group).
Parity three or more cows decision-tree model validation with 27 healthy and 33 sick run on veterinarian decision (VD)Footnote 1 cows

Data collected during the farm implementation period – April 2013 to November 2014.
1 VD group (v. model-based decision (MBD) group).
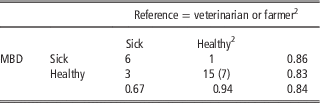
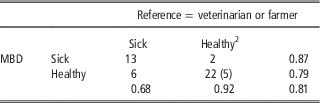
Tables 4 and 5 show the confusion matrices for the two parity groups of MBD cows. The model had an accuracy of 84%, a specificity of 93% and a sensitivity of 76% compared with the reference, which in this case was the veterinarian or the farmer. For parity two cows, the accuracy was 84%, specificity was 94% and sensitivity was 67% (Table 4). For cows of parity three or more, accuracy was 81%, specificity was 92% and sensitivity was 68% (Table 5).
Parity two cows decision-tree model validation with 18 healthy and seven sick run on model-based decision (MBD)Footnote 1 cows

1 MBD group (v. veterinarian decision group). Data collected during the farm implementation period – April 2013 to November 2014.
2 Number in brackets indicates number of cows out of healthy cows that were decided to be healthy by the farmer and not presented to the veterinarian.
Parity three or more cows decision-tree model validation with 24 healthy and 15 sick run on model-based decision (MBD)Footnote 1 cows

1 MBD group (v. veterinarian decision group). Data collected during the farm implementation period – April 2013 to November 2014.
2 Number in brackets indicates number of cows out of healthy cows that were decided to be healthy by the farmer and not presented to the veterinarian.
Post-calving health problems
Incidences of metritis and ketosis are reported in Table 6. The difference in metritis incidence between the VD group (51 cows) and MBD group was not statistically significant, nor was the incidence of ketosis between the two groups. The incidence of cows culled at ⩽60 DIM (Table 6) was also not significantly different between groups.
Model implementation on the farm over measures of performance; a comparison between model and veterinarian decisions (VD)

1 Ns is not statistically significant at P=0.05.
2 The odds of conceiving in group MBD were 2.1 times greater than in group VD; this association was statistically significant at P=0.05.
Cow performance
Milk production
Cumulative 60-day milk production between the two treatment groups was compared and the difference was not statistically significant by univariable analysis (Student’s t test; Table 6). Cumulative 60-day milk production was significantly associated with metritis (P<0.001), tended towards a significant association with ketosis (P=0.060), but was not significantly associated with treatment group (P=0.566).
Conception at first insemination (Table 6)
The difference in conception rate at first insemination between VD and MBD groups was close to statistically significant. Following the univariable analysis, the data were analysed by multivariable logistic regression model. The dependent variable was conception at first insemination and considered independent variables were parity group, treatment group, metritis and other calving diseases, insemination in the summer months, and days to first insemination. Parity group was forced in the model and the other independent variables stayed in the model only if their effect was significant at P<0.15. The odds of conceiving in group MBD were 2.1 times greater than in group VD; this association was statistically significant at P=0.05, after controlling for the effects of parity group and metritis.
Discussion
Indicating research gap
The results of this study suggest that an accurate model for detecting post-calving health can be built using sensors that are already available on robotic-milking farms. Other sensors (that detect lying (Steensels et al., Reference Walker, Smith, Routly, Jones, Morris and Dobson2012), BW changes (Maltz, Reference Miron, Yosef, Nikbachat, Zenou, Maltz, Halachmi and Ben-Ghedalia1997) or feeding behaviour (Halachmi et al., Reference Halachmi, Ben Meir, Miron and Maltz2004a and Reference Halachmi, Schlageter Tello, Peña Fernández, van Hertem, Sibony, Weyl-Feinstein, Verbrugge, Bonneau and Neilson2004b; Miron et al., Reference Mulligan and Doherty2004; Halachmi et al., Reference Halachmi, Børsting, Maltz, Edan and Weisbjerg2015a and Reference Hansen, Norgaard, Pedersen, Jorgensen, Mellau and Enemark2015b) could potentially create an even more accurate model.
A previous study (Steensels et al., 2012) indicated that a model will perform better when it is calibrated on the same farm where it is applied, because between-farm differences in, for example, management routines and housing facilities are excluded. The data used here for model development (June 2012 to March 2013) were not used for model validation (April 2013 to November 2014) but originated in one single farm. In future research, other validation systems, such as different farms, might be applied. Moreover, a procedure for local calibration is recommended based on the local veterinarian’s and farmer’s attitudes. Every farm could potentially need set its own threshold (Steensels et al., 2012). In addition, effects on reproduction, culling rate and milk yield should be locally considered.
Sensitivity and specificity always represent a trade-off. The selection of a threshold value (0.5 for this model) influences model sensitivity and specificity. In further research, by optimizing the threshold value, model accuracy could be improved.
Limitations of the study
Although we knew the exact time of disease detection (by the veterinarian), the exact timing of the disease’s onset in the animal was not known – it might have developed earlier or it might have been detected at a subclinical level, hence animal behaviour would not be considerably changed. In an ideal world, the cows should be checked for ketosis and metritis every day after calving. The model was run only on Sundays – the day of the veterinarian’s visit. Sick cows that were not detected by the model on Sundays would most likely be detected by the model 1 or 2 days later and treated then. Although such a delay is undesirable, the model still provides a warning in good time without the presence of the veterinarian.
Practical application
In this study, the farmer was the key person, who knows the cows best. The farmer could overrule the model’s decision for suspected cows due to a difficult calving or based on ‘gut feeling’. In general, this farmer followed the cows closely every day, by monitoring their data on the computer and by looking at the animals in the barn. A farmer with more cows might make more frequent use of the model. Nevertheless, the farmer was surprised to find that the model followed his own perception quite well. Discussions with the farmer and veterinarian revealed that the model could have added value on farms that do not apply any routine post-calving health protocol, and on large farms where the farmer has less time to spend on each individual animal.
The routine procedure for Israeli dairies recorded in the herd book is to send all cows after calving to the veterinarian for a check-up. On the studied farm, this was included in the annual insurance: the farmer did not have to pay for it. It was therefore not surprising that he sent most of the cows to the veterinarian regardless of the model’s output. However, on farms where the farmer has to pay for each cow that is brought to the veterinarian, the model is more likely to be closely followed, with the aim of presenting less cows.
Negotiating the strength of claims
Following the experiment design, not all cows in the MBD validation were brought to the veterinarian. These cows were considered to be healthy: analysis of milk yield, conception at first insemination and culling rate revealed that there was no difference between these cows and the cows that were diagnosed as healthy by the veterinarian.
The MBD cows performed better than the VD ones with respect to conception rate at first insemination. This suggests that some VD cows that were treated despite the model’s output responded negatively later on in terms of reproduction performance. However, this assumption has yet to be carefully analysed in further research.
It should be stressed that a conception rate of 56% at first insemination in >1 parity dairy cows in Israel is extremely high; in 2014, the median value in herds participating in the ‘Hachaklait’ Herd Health Program was 28% and the upper quartile value was 32.7%.
Table 6 suggests that the MBD concept did not perform more poorly than the current common practices (VD concept). The benefits of the MBD are not apparent from Tables 1 to 6, but consist of saving the farmer’s time (fetching cows that do not necessarily need to be fetched takes about 1.5 h/day on this farm) and causing less disturbance to the other cows while searching for and walking a particular cow.
Conclusions
The results suggest that an accurate post-calving health-detection model can be created using available sensors in a robotic-milking dairy farm. The available sensors’ data were milking data, rumination time, cow activity, milk yield, BW compared with BW at calving and number of visits to the milking robot. These were used to develop and validate a decision-tree model for detecting post-calving diseases.
The overall accuracy of the model was up to 92% (sensitivity was 86% and the specificity was 95% running on the calibration database) down to 84% and 93% on two party groups, and for cows of parity three or more, the accuracy was 72%. However, use of additional sensors might improve the model, and this warrants further study.
On farms where the veterinarian is paid per presented cow and/or on large farms where the farmer has limited time to bring individual animals to the veterinarian, and/or a farmer seeks to minimize disturbances to the cows’ routine, the model presented in this paper can serve as a practical tool to give information to the farmer about the potential health-risk status of a cow, that is, which cows should be fetched and which cows should be left undisturbed.
Acknowledgements
The authors would like to thank Elazar, the other farm personnel and the farm veterinarian from Kibbutz Yesodot for their cooperation in the project and the technicians from Lely NV for their technical help. The research was funded by the Israeli Agricultural Ministry Chief Scientist Fund, project no. 459-4426-10 and 459-4369-10.