

Introduction
In today’s rapidly evolving technological environment, building geographically dispersed innovation networks has become a vital strategy for firms seeking to access diverse and localized knowledge pools, even within national borders (Boh, Ren, Kiesler, & Bussjaeger, Reference Boh, Ren, Kiesler and Bussjaeger2007; Chakrabarti & Mitchell, Reference Chakrabarti and Mitchell2016; Erkelens, Van den Hooff, Huysman, & Vlaar, Reference Erkelens, Van den Hooff, Huysman and Vlaar2015; Lahiri, Reference Lahiri2010). By establishing a presence across multiple regions, firms can tap into unique technological and market resources, thereby enhancing their innovation potential (Meyer, Li, & Schotter, Reference Meyer, Li and Schotter2020; Singh, Reference Singh2008). To achieve this, domestic technological acquisitions have emerged as a preferred approach for established firms. Such acquisitions allow firms to rapidly integrate new geographic nodes into their innovation networks, acquire specialized expertise, strengthen technological capabilities, and accelerate innovation (Ardito, Natalicchio, Petruzzelli, & Garavelli, Reference Ardito, Natalicchio, Petruzzelli and Garavelli2017; Dezi, Battisti, Ferraris, & Papa, Reference Dezi, Battisti, Ferraris and Papa2018). This strategy is especially relevant in China, a country with vast geographic breadth and significant regional heterogeneity in economic development, industrial specialization, and innovation resources (Crescenzi & Rodríguez-Pose, Reference Crescenzi and Rodríguez-Pose2017; Tian, Kou, & Zhang, Reference Tian, Kou and Zhang2020; Wu & Wei, Reference Wu and Wei2013).
While technological acquisitions, particularly those involving geographically distant targets, offer access to diverse and novel knowledge that can potentially fuel innovation, they often fall short of expectations in practice (King, Dalton, Daily, & Covin, Reference King, Dalton, Daily and Covin2004; Rosenkopf & Nerkar, Reference Rosenkopf and Nerkar2001). Acquirers pursuing such distant firms aim to tap into non-redundant knowledge pools (Rosenkopf & Almeida, Reference Rosenkopf and Almeida2003; Zaheer & Hernandez, Reference Zaheer and Hernandez2011). Yet the very geographic distance that promises innovation also presents significant challenges, such as inaccurate due diligence, strategic misalignment, and impeded information flows, which hinder effective integration (Chakrabarti & Mitchell, Reference Chakrabarti and Mitchell2016; McCarthy & Aalbers, Reference McCarthy and Aalbers2016). As the case of China illustrates, domestic technological acquisitions often encounter these major obstacles, given the pronounced variations across locations (Zhu & Zhu, Reference Zhu and Zhu2016). Accordingly, acquirers face a ‘geographic distance dilemma’, where the potential benefits of distant knowledge are undermined by the practical difficulties of realizing them (Graebner, Eisenhardt, & Roundy, Reference Graebner, Eisenhardt and Roundy2010).
However, much of the existing research on this dilemma rests on a critical assumption: that the acquiring firm is a geographically centralized and unitary actor, typically represented by its headquarters. Under this assumption, geographic distance is commonly measured as the distance between the acquirer’s headquarters and the target firm. This perspective, while analytically convenient, neglects an important organizational reality – many technological acquisitions are undertaken by corporate groups, which are inherently structured as geographically embedded networks composed of central headquarters and multiple dispersed subsidiaries (Wang, Wei, & Zhao, Reference Wang, Wei and Zhao2022; Yiu, Lu, Bruton, & Hoskisson, Reference Yiu, Lu, Bruton and Hoskisson2007). As such, focusing solely on the headquarters-target distance offers an incomplete view of how the geographic configuration of the entire group – particularly both the locations of headquarters and subsidiaries – shapes post-acquisition innovation outcomes.
Importantly, as corporate groups evolve, the division of roles between headquarters and subsidiaries becomes more distinct (Hewett, Roth & Roth, Reference Hewett, Roth and Roth2003). Headquarters increasingly assumes strategic roles such as decision-making, governance, and resource allocation (Björkman, Barner-Rasmussen, & Li, Reference Björkman, Barner-Rasmussen and Li2004; Bushman, Chen, Engel, & Smith, Reference Bushman, Chen, Engel and Smith2004; Collis, Young, & Goold, Reference Collis, Young and Goold2007), while operational roles, especially in R&D, are often delegated to R&D subsidiaries that are located closer to relevant technology ecosystems and clusters (Kafouros, Wang, Mavroudi, Hong, & Katsikeas, Reference Kafouros, Wang, Mavroudi, Hong and Katsikeas2018; Phene & Almeida, Reference Phene and Almeida2008). These R&D subsidiaries thus serve as localized knowledge conduits, absorbing external information on technology, markets, and management, and recombining them to support innovation.
In the context of technological acquisitions, the different roles played by headquarters and R&D subsidiaries lead to distinct relationships with the target. The headquarters typically engages directly with the target through strategic tasks, such as due diligence, governance integration, and the alignment of long-term goals (Meyer et al., Reference Meyer, Li and Schotter2020). In contrast, while R&D subsidiaries may not be directly involved in the acquisition process from a transactional perspective, they, together with the target firm, play a role in the corporate group’s broader local search efforts, which allows the group to access and integrate heterogeneous knowledge from multiple technology clusters (Kafouros et al., Reference Kafouros, Wang, Mavroudi, Hong and Katsikeas2018). As a result, the geographic distance between the target and these respective actors, i.e., headquarters and R&D subsidiaries, may have differential impacts on post-acquisition innovation performance. Yet, existing research has not provided a clear answer to this issue.
To investigate this issue, this study builds on economic geography and network theory to examine how the geographic distance from the target to both the headquarters and R&D subsidiaries influences technological acquisition outcomes within a single-country context. Specifically, based on an empirical study of 346 domestic technological acquisitions initiated by corporate groups in China, we find that post-acquisition innovation performance suffers when the headquarters is distant from the targets, while it improves when the R&D subsidiaries are located far from the targets. The former reflects the headquarters’ strategic role in due diligence and governance integration (Björkman, Barner-Rasmussen, & Li, Reference Björkman, Barner-Rasmussen and Li2004; Hewett, Roth, & Roth, Reference Hewett, Roth and Roth2003), while the latter highlights subsidiaries’ operational role in accessing and leveraging diverse, non-redundant knowledge (Gao, Ng, & Wang, Reference Gao, Ng and Wang2008; Lahiri, Reference Lahiri2010). Moreover, we find that headquarters-target proximity strengthens the positive effect of subsidiary-target distance, underscoring the central role of the headquarters as a hub in the corporate group’s geographic knowledge network (Lind & Kang, Reference Lind and Kang2017; Miao, Zeng, & Lee, Reference Miao, Zeng and Lee2016).
In addition, we investigate how the geographic dispersion of the corporate group moderates these effects. Our findings suggest that when a corporate group is more geographically dispersed, the coordination burden on the headquarters increases, thereby amplifying the negative effect of headquarters-target distance (Bushman, Chen, Engel, & Smith, Reference Bushman, Chen, Engel and Smith2004; Kafouros et al., Reference Kafouros, Wang, Mavroudi, Hong and Katsikeas2018). Simultaneously, the marginal benefits of knowledge heterogeneity from distant targets diminish, weakening the positive impact of subsidiary-target distance on post-acquisition innovation (Vassolo, Anand, & Folta, Reference Vassolo, Anand and Folta2004). These results suggest that the effect of distance in acquisitions depends not only on the distance itself, but also on the geographic dispersion of the corporate group, highlighting that distance is embedded within – and contingent upon – the overall configuration of the firm’s broader geographic network.
This study attempts to make three key contributions. First, we extend M&A research by moving beyond the traditional acquirer-target dyad and conceptualizing the acquirer as a geographically distributed corporate group. By adopting a network perspective, we show that headquarters and R&D subsidiaries occupy distinct structural roles (Meyer et al., Reference Meyer, Li and Schotter2020; Yiu et al., Reference Yiu, Lu, Bruton and Hoskisson2007), and their respective distances to the target have divergent effects on post-acquisition innovation. This approach reveals how intra-organizational spatial structure shapes innovation outcomes in technological acquisitions. Second, we address the geographic distance dilemma in the innovation and economic geography literature. Prior research treats distance as either a barrier to integration or a source of knowledge diversity (McCarthy & Aalbers, Reference McCarthy and Aalbers2016; Ozer & Zhang, Reference Ozer and Zhang2015; Su & Moaniba, Reference Su and Moaniba2020); we reconcile these views by showing that the effect of distance depends on the roles of the internal actors of the acquirer. Distance from headquarters impedes innovation by hindering coordination, while distance from R&D subsidiaries tends to enhance innovation by serving as an indicator of exposure to non-redundant knowledge. This role-contingent perspective clarifies when and how geographic distance supports or undermines innovation in the context of acquisition. Third, we contribute to research on network dynamics by theorizing technological acquisitions as a strategy for reconfiguring the geographic structure of a firm’s R&D network (Hernandez & Menon, Reference Hernandez and Menon2018; Öberg, Henneberg, & Mouzas, Reference Öberg, Henneberg and Mouzas2007). We find that the innovation benefits of geographic expansion hinge on the pre-existing structure of the acquirer’s network (Parmigiani & Rivera-Santos, Reference Parmigiani and Rivera-Santos2011; Soda, Usai, & Zaheer, Reference Soda, Usai and Zaheer2004). Greater geographic dispersion increases coordination burdens and reduces the marginal value of distant knowledge. These findings offer a dynamic view of how firms can reshape their innovation systems through acquisition-driven network evolution.
Theoretical Background and Hypotheses Development
The Corporate Group as a Geographic Network
To enhance innovation capacity and maintain competitive advantage, many firms have established R&D subsidiaries across multiple geographic locations (Lahiri, Reference Lahiri2010; Wang & Zhao, Reference Wang and Zhao2018). This spatial expansion reflects the understanding that knowledge flows are often constrained by geographic proximity (Reuer & Lahiri, Reference Reuer and Lahiri2014; Rosenkopf & Almeida, Reference Rosenkopf and Almeida2003; Zaheer & Hernandez, Reference Zaheer and Hernandez2011), and that innovation depends on recombining heterogeneous knowledge (Fleming, Reference Fleming2001). Geographic boundaries can thus restrict access to diverse knowledge, limiting innovation potential. To mitigate these limitations, firms often establish R&D subsidiaries near major markets or leading technology clusters (Boh et al., Reference Boh, Ren, Kiesler and Bussjaeger2007; Wang & Zhao, Reference Wang and Zhao2018). These subsidiaries act as local knowledge nodes, absorbing regional insights that would otherwise be difficult to access. As a result, corporate groups increasingly operate as a geographically dispersed R&D network, composed of geographically distributed R&D subsidiaries and central headquarters (Meyer et al., Reference Meyer, Li and Schotter2020).
This configuration is especially prevalent in China. Due to its vast geographic scope and pronounced regional heterogeneity in industrial structure, innovation capacity, and policy environment (Crescenzi & Rodríguez-Pose, Reference Crescenzi and Rodríguez-Pose2017; Tian et al., Reference Tian, Kou and Zhang2020; Wu & Wei, Reference Wu and Wei2013), Chinese corporate groups often establish R&D subsidiaries in multiple cities and provinces beyond their home base. For instance, Xiaomi, a prominent Chinese technology firm headquartered in Beijing, also operates R&D centers in Shanghai, Shenzhen, Nanjing, Wuhan, Chengdu, and so on, leveraging each region’s strengths in electronics, AI, and emerging tech clusters to enhance its innovation capacity. This functional and spatial division reflects not only strategic considerations to access diverse technological resources, but also adaptations to regional differences in factor endowments, government incentives, and cluster specialization (Carney, Shapiro, & Tang, Reference Carney, Shapiro and Tang2009). As a result, geographically dispersed corporate groups have become a common organizational form among Chinese firms. These contextual features make China specifically relevant and theoretically meaningful setting for examining how intra-group geographic configurations influence innovation outcomes.
To understand this phenomenon, scholars have integrated insights from economic geography and network theory, conceptualizing the corporate group as a geographically dispersed R&D network (Glückler, Reference Glückler2007; Glückler & Doreian, Reference Glückler and Doreian2016). Within this network, subsidiaries and headquarters assume distinct yet complementary roles in managing knowledge diversity and coordination. Specifically, R&D subsidiaries are typically located in heterogeneous technological and market environments, serving as local knowledge nodes that explore and acquire region-specific insights (Kostova, Marano, & Tallman, Reference Kostova, Marano and Tallman2016; Lind & Kang, Reference Lind and Kang2017). The geographic dispersion of subsidiaries thus reflects the strategic effort to access diverse external knowledge sources and enhance the innovation potential of corporate groups (Wang & Zhao, Reference Wang and Zhao2018). Accordingly, when examining how knowledge diversity contributes to corporate innovation, existing research often focuses on the dispersion of subsidiaries (Cantwell & Mudambi, Reference Cantwell and Mudambi2005).
At the same time, the innovation performance of a corporate group hinges not only on local knowledge exploration, but also on the integration of dispersed knowledge – a function typically attributed to the headquarters (Singh, Reference Singh2008; Zeschky, Daiber, Widenmayer, & Gassmann, Reference Zeschky, Daiber, Widenmayer and Gassmann2014). In a geographically distributed R&D network, subsidiaries are often structurally positioned at the periphery of the network, with limited connections to one another (Björkman et al., Reference Björkman, Barner-Rasmussen and Li2004; Menz, Kunisch, & Collis, Reference Menz, Kunisch and Collis2015). In contrast, the headquarters typically maintains connections with all subsidiaries, which structurally embeds it at the core of the network and enables it to function as a central hub through which knowledge flows are channeled and coordinated (Vahlne, Schweizer, & Johanson, Reference Vahlne, Schweizer and Johanson2012). This central position grants the headquarters unique advantages in strategic alignment, resource orchestration, and knowledge integration across distant and diverse organizational units (Collis, Young, & Goold, Reference Collis, Young and Goold2007; Lee, Reference Lee2022; Lind & Kang, Reference Lind and Kang2017; Schilling & Fang, Reference Schilling and Fang2014). Meanwhile, the periphery subsidiaries primarily engage in local knowledge exploration and are responsible for feeding external insights upward to the headquarters, which then integrates and redistributes these inputs within the broader network. Prior studies have confirmed that knowledge recombination in such networks is primarily facilitated through headquarters–subsidiary relationships, rather than lateral subsidiary–subsidiary ties (Faems, Bos, Noseleit, & Leten, Reference Faems, Bos, Noseleit and Leten2020; Zhang, Jiang, & Cantwell, Reference Zhang, Jiang and Cantwell2019). Even when peer subsidiaries collaborate, such efforts typically rely on strategic coordination from the headquarters to ensure alignment and avoid duplication (Dellestrand & Kappen, Reference Dellestrand and Kappen2011; Williams & Nones, Reference Williams and Nones2009). Overall, such dual structure implies a division of innovation labor: while subsidiaries contribute to knowledge variety through local exploration, the headquarters creates value by coordinating the diverse inputs into cohesive innovation outcomes (Meyer et al., Reference Meyer, Li and Schotter2020).
The Paradox of Geographic Distance in Technological Acquisition
Technological acquisitions – defined as the purchase of firms possessing specialized expertise and valuable technological knowledge – have become a primary strategy for innovation among leading firms operating in fast-evolving technological landscapes, regardless of national borders (Ahuja & Katila, Reference Ahuja and Katila2001; Ardito et al., Reference Ardito, Natalicchio, Petruzzelli and Garavelli2017; Chakrabarti & Mitchell, Reference Chakrabarti and Mitchell2016; Grimpe & Hussinger, Reference Grimpe and Hussinger2014). By acquiring such targets, firms can rapidly access advanced capabilities, including complex tacit knowledge and intellectual property, thereby bypassing the lengthy and uncertain process of internal R&D (Puranam, Singh, & Zollo, Reference Puranam, Singh and Zollo2006; Sun, Wang, & Zhao, Reference Sun, Wang and Zhao2025). As a result, technological acquisitions have gained prominence as a key means for firms to sustain their innovation advantage (Rios, Reference Rios2021). However, despite their potential, technological acquisitions often fail to deliver the expected innovation outcomes. Compared to other types of acquisitions, they face more complex challenges in technology integration and greater uncertainty regarding the value and applicability of the acquired technology (Chaudhuri & Tabrizi, Reference Chaudhuri and Tabrizi1999). Thus, technological acquisitions often underperform in terms of innovation output (Desyllas & Hughes, Reference Desyllas and Hughes2010; Graebner et al., Reference Graebner, Eisenhardt and Roundy2010; Hagedoorn & Duysters, Reference Hagedoorn and Duysters2002; McCarthy & Aalbers, Reference McCarthy and Aalbers2016).
To explain these disappointing outcomes, some scholars have turned to the role of geographic distance between acquirers and targets (Santamaría, Nieto, & Rodríguez, Reference Santamaría, Nieto and Rodríguez2021). Importantly, recent research increasingly recognizes that geographic distance remains an important strategic consideration in large, spatially heterogeneous individual countries (Chakrabarti & Mitchell, Reference Chakrabarti and Mitchell2016; Guo, Jiang, Xu, & Yang, Reference Guo, Jiang, Xu and Yang2020; Zeng, Wu, Liu, Huang, Zhao, & Liu, Reference Zeng, Wu, Liu, Huang, Zhao and Liu2019). This growing body of work highlights that intra-national variation in regional institutions, market conditions, and innovation ecosystems can shape the costs and benefits associated with technological acquisitions.They argue that distance can hinder post-acquisition innovation due to limited information flow, higher transaction and monitoring costs, and increased difficulties in aligning strategic objectives and organizational routines (Chakrabarti & Mitchell, Reference Chakrabarti and Mitchell2016; McCarthy & Aalbers, Reference McCarthy and Aalbers2016). From this perspective, acquirers must carefully assess the compatibility between the target’s innovation capabilities and their own technological trajectory prior to the deal (Puranam & Srikanth, Reference Puranam and Srikanth2007), and undertake deliberate integration efforts after the deal to ensure alignment (Capron, Dussauge, & Mitchell, Reference Capron, Dussauge and Mitchell1998). Otherwise, geographic distance may result in strategic misalignment, technological incompatibilities, and ultimately, performance setbacks. Hence, acquisitions of geographically proximate targets are often considered more likely to succeed, as proximity facilitates effective due diligence, smooth coordination, and strong alignment of strategic objectives.
In contrast, other scholars emphasize the innovation-enhancing potential of acquiring geographically distant firms. They argue that the purpose of technological acquisitions is precisely to access heterogeneous and novel knowledge that is difficult to find through local search (Ozer & Zhang, Reference Ozer and Zhang2015). From this perspective, geographic distance serves as a proxy for the underlying socioeconomic, institutional, and technological heterogeneity across locations (Reuer & Lahiri, Reference Reuer and Lahiri2014; Rosenkopf & Almeida, Reference Rosenkopf and Almeida2003; Zaheer & Hernandez, Reference Zaheer and Hernandez2011). Greater distance increases the likelihood that the acquired firm operates in a distinct knowledge environment, thereby providing access to non-redundant and diverse knowledge resources. In this sense, geographic distance reflects the opportunity to tap into varied knowledge bases embedded in different technological or market contexts (Rosenkopf & Almeida, Reference Rosenkopf and Almeida2003; Rosenkopf & Nerkar, Reference Rosenkopf and Nerkar2001; Zaheer & Hernandez, Reference Zaheer and Hernandez2011). Such access to heterogeneous inputs significantly enhances the potential for creative recombination, thereby fostering innovation.
These contrasting views reflect the geographic distance dilemma – that geographic distance offers both advantages and disadvantages for innovation in acquisitions: while proximity facilitates knowledge integration and coordination, the heterogeneity that distance proxies increases the likelihood of accessing diverse and non-redundant knowledge essential for innovation. Therefore, navigating this dilemma is essential for realizing the intended innovation outcomes of technological acquisitions.
Rethinking the Acquirer: From Isolated Entity to Corporate Group
Existing research on geographic distance in technological acquisitions often rests on the implicit assumption that the acquiring firm is a single, isolated entity (Chakrabarti & Mitchell, Reference Chakrabarti and Mitchell2016; McCarthy & Aalbers, Reference McCarthy and Aalbers2016). Yet, many acquirers are in fact corporate groups that control multiple geographically dispersed subsidiaries through ownership ties and internal governance mechanisms (Yiu et al., Reference Yiu, Lu, Bruton and Hoskisson2007). As such, examining geographic distance through a single dyadic lens – typically, the distance between the headquarters and the target – presents an incomplete picture. This approach overlooks the potential roles played by other geographically distributed actors within the corporate group and fails to account for how the internal structure shapes the effects of geographic distance on post-acquisition outcomes. To address this limitation, we shift our perspective on the acquirer: rather than viewing the acquirer as a monolithic entity, we conceptualize it as a geographically distributed R&D network.
Drawing on a network lens, technological acquisition is essentially a strategy to reconfigure a corporate group’s existing R&D network (Hernandez & Menon, Reference Hernandez and Menon2018; Öberg et al., Reference Öberg, Henneberg and Mouzas2007). When a target firm is acquired, it is not merely a merger between two nodes but rather an additional node incorporated into the acquiring group’s internal knowledge network. As such, all nodes in the existing network – including both the headquarters and the subsidiaries – should be considered, as they occupy distinct positions in the network and each contributes differently to the innovation outcomes. Specifically, the headquarters primarily focuses on high-level strategic tasks, such as aligning the acquisition with the group’s long-term R&D agenda, overseeing the integration process, and orchestrating resource deployment, to ensure the acquired technology complements the group’s innovation trajectory (Kim & Mauborgne, Reference Kim and Mauborgne1993; Meyer et al., Reference Meyer, Li and Schotter2020). In contrast, while R&D subsidiaries may not participate in the acquisition process directly, they play a critical role – alongside the target firm – in advancing the corporate group’s broader local search efforts (Ardito et al., Reference Ardito, Natalicchio, Petruzzelli and Garavelli2017; Feinberg & Gupta, Reference Feinberg and Gupta2004). By leveraging their embeddedness in distinct regions, these subsidiaries facilitate access to diverse and complementary knowledge bases, enabling the corporate group to absorb and recombine externally sourced knowledge from both existing and newly acquired clusters (Ciabuschi, Holm, & Martín, Reference Ciabuschi, Holm and Martín2014).
Critically, these efforts must be coordinated in the dispersed R&D network: the headquarters assumes a central role in managing the interactions among subsidiaries and the target firm, integrating their diverse contributions while maintaining coherence with the corporate group’s strategic vision (Friesl & Siberzahn, Reference Friesl and Siberzahn2017). This structural and functional differentiation between headquarters and subsidiaries is inherently spatial in nature: headquarters operate as central integrators across distance, whereas subsidiaries act as geographically anchored knowledge conduits. Accordingly, the geographic distance between the target and each actor (headquarters vs. subsidiaries) is likely to have differentiated implications for post-acquisition innovation. However, prior research has not fully addressed how these geographic relationships influence acquisition outcomes both individually and collectively.
The Geographic Distance Between the Headquarters and the Target
In a corporate group, the headquarters plays a central role in overall management and strategic decision-making. It is responsible for shaping the group’s development strategy, managing operations, and ensuring the effective allocation and utilization of resources (An, Wang, & Zhao, Reference An, Wang and Zhao2025; Björkman et al., Reference Björkman, Barner-Rasmussen and Li2004; Dellestrand & Kappen, Reference Dellestrand and Kappen2011; Ferlie & Pettigrew, Reference Ferlie and Pettigrew1996). In the context of technological acquisitions, the headquarters identifies suitable acquisition targets, conducts due diligence, and negotiates deal terms, overseeing the entire process (Benito, Lunnan, & Tomassen, Reference Benito, Lunnan and Tomassen2011). Beyond these responsibilities, the headquarters also functions as a coordination hub that bridges various departments and subsidiaries (Dellestrand & Kappen, Reference Dellestrand and Kappen2011), playing a critical role in governance integration with the target through the alignment of the boards, top management teams, and decision-making processes.
These strategic and integrative roles of the headquarters lay the foundation for analyzing how geographic distance from the target firm influences post-acquisition innovation. First, in technological acquisitions, where uncertainty regarding the technology’s potential is often high, accurately evaluating the target company’s technological capabilities and ensuring compatibility with one’s own existing operations is crucial for success (Chakrabarti & Mitchell, Reference Chakrabarti and Mitchell2013). This responsibility rests heavily on headquarters. However, greater geographic distance causes communication delays and creates barriers to accessing timely and critical information (McCarthy & Aalbers, Reference McCarthy and Aalbers2016; Ragozzino & Reuer, Reference Ragozzino and Reuer2011; Reuer & Lahiri, Reference Reuer and Lahiri2014). As a result, obtaining accurate and up-to-date information about the target’s technologies, processes, and intellectual assets becomes more difficult, potentially leading to incomplete or incorrect assessments, and ultimately undermining the headquarters’ ability to make well-informed decisions (Chakrabarti & Mitchell, Reference Chakrabarti and Mitchell2016). Consequently, these challenges diminish the potential for innovation following an acquisition.
Second, greater geographic distance between the headquarters and the target is often associated with higher costs of governance integration (Malhotra & Gaur, Reference Malhotra and Gaur2014). The decision-making process from afar necessitates frequent travel and face-to-face meetings, leading to additional expenditures and placing greater demands on extensive coordination efforts (McCarthy & Aalbers, Reference McCarthy and Aalbers2016). Moreover, in large and spatially heterogeneous countries like China, geographic distance often coincides with substantial differences in industrial composition, technological specialization, and market demand (Guo et al., Reference Guo, Jiang, Xu and Yang2020; Zeng et al., Reference Zeng, Wu, Liu, Huang, Zhao and Liu2019; Zhang, Zhu, & Lyu, Reference Zhang, Zhu and Lyu2022). Such differences can influence acquisition strategies and post-acquisition integration outcomes (Reuer & Lahiri, Reference Reuer and Lahiri2014). Successfully integrating these diverse market and technology bases requires both time and resources, potentially inflating integration costs (Chakrabarti & Mitchell, Reference Chakrabarti and Mitchell2016). Furthermore, geographic distance may contribute to managerial dissatisfaction or instability. Senior executives may be required to relocate, undertake frequent travel, or adapt to unfamiliar organizational routines – all of which may increase the likelihood of turnover or the loss of key personnel (McCarthy & Aalbers, Reference McCarthy and Aalbers2016). Such disruptions undermine the continuity of knowledge and expertise, thereby compounding the overall integration costs.
In sum, the costs of information and governance integration induced by greater geographic distance between the headquarters and the target can cumulatively hinder the efficient development of acquired technologies and the post-acquisition innovation. Therefore, we propose:
Hypothesis 1 (H1): The greater the geographic distance between the headquarters and the target in a technological acquisition, the lower the post-acquisition innovation.
The Geographic Distance Between R&D Subsidiaries and the Target
In the innovation network of corporate groups, substantive R&D activities are typically carried out by R&D subsidiaries (Feinberg & Gupta, Reference Feinberg and Gupta2004). These subsidiaries not only serve as implementers, translating strategic objectives into tangible innovations such as new products, solutions, or services, but also acquire locally specific and often tacit knowledge through deep embeddedness in regional markets and technological environments. This localized knowledge is subsequently disseminated across the broader corporate network, enhancing the organization’s overall innovation capacity (Ciabuschi et al., Reference Ciabuschi, Holm and Martín2014; Tsai, Reference Tsai2001).
When a corporate group undertakes a technological acquisition, the newly acquired target becomes an additional R&D subsidiary. Such an acquisition not only constitutes a structural adjustment by introducing a new node into the firm’s R&D network, but also prompts a strategic reconfiguration of its knowledge architecture (Ardito, Natalicchio, Petruzzelli & Garavelli, Reference Ardito, Natalicchio, Petruzzelli and Garavelli2017). We suggest that greater geographic distance between the target and the R&D subsidiaries introduces non-redundant knowledge and resources from different regions into the R&D network (Kafouros, Wang, Mavroudi, Hong & Katsikeas, Reference Kafouros, Wang, Mavroudi, Hong and Katsikeas2018; Su & Moaniba, Reference Su and Moaniba2020).
According to network theory, a sparser network structure that is marked by greater distances among nodes tends to preserve knowledge heterogeneity and reduce redundancy (Funk, Reference Funk2014). In this sense, the acquired firm distant from the existing R&D subsidiaries can introduce greater diversity into the corporate innovation network. Such diversity, in turn, enhances the potential for novel combinations of knowledge and innovations following the acquisition. R&D subsidiaries embedded in distinct regional ecosystems are well positioned to access external innovation opportunities, form local partnerships, and engage in open innovation networks (Boh et al., Reference Boh, Ren, Kiesler and Bussjaeger2007; Erkelens et al., Reference Erkelens, Van den Hooff, Huysman and Vlaar2015). Thus, a geographically distant target contributes unique perspectives, experiences, and technological insights, potentially triggering a productive reconfiguration of the acquirer’s innovation system.
While a geographically distant target may enrich the corporate group with non-redundant knowledge, successful post-acquisition collaboration hinges on the ability to share and integrate such knowledge, which is an ability that may be constrained by the very same distance (Friesl & Siberzahn, Reference Friesl and Siberzahn2017). However, we contend that the benefits of proximity for knowledge sharing and integration between the target and the R&D subsidiaries may be limited or even counterproductive in this scenario. First, subsidiaries are not only collaborators but also potential competitors within the internal network (Liu, Jiao, & Xia, Reference Liu, Jiao and Xia2019). When the acquired firm is located close to existing R&D subsidiaries, geographic proximity may imply overlapping markets or technological domains, which can intensify competition – not only in external markets but also internally for corporate attention and resources (Letaifa & Rabeau, Reference Letaifa and Rabeau2013; Li, Yang, Ma, & Chen, Reference Li, Yang, Ma and Chen2022). Particularly when the newly acquired unit is perceived as a threat to the status or strategic position of existing subsidiaries, proximity may trigger exclusionary behaviors such as marginalization or resistance (Tippmann, Scott, Reilly, & O’Brien, Reference Tippmann, Scott, Reilly and O’Brien2018). These internal tensions can erode the willingness to share knowledge and cooperate, ultimately undermining integration efforts (Zhang et al., Reference Zhang, Jiang and Cantwell2019). Second, geographic proximity may increase the likelihood of knowledge overlap and cognitive similarity (Berry, Reference Berry2023; Ganesan, Malter, & Rindfleisch, Reference Ganesan, Malter and Rindfleisch2005). When units operate in similar and overlapping environments, they tend to share common language, routines, evaluation standards, and mental models. Although such similarities may facilitate some forms of coordination, it can also constrain organizational learning and limit the diversity of perspectives essential for innovation.
Taken together, although geographic proximity between the target and the R&D subsidiaries may appear to ease knowledge integration on the surface, it can also introduce hidden risks such as internal rivalry, knowledge redundancy, and cognitive lock-in. These considerations suggest that the advantages of close spatial ties should not be overestimated, and that geographic distance, not only facilitating access to diverse knowledge domains but also reducing rivalry and cognitive lock-in, may in fact offer richer innovation potential. Thus, we propose:
Hypothesis 2 (H2): The greater the geographic distance between the R&D subsidiaries and the target in a technological acquisition, the higher the post-acquisition innovation.
Although the geographic distance between the acquired firm and existing subsidiaries may hinder direct knowledge integration and potentially constrain innovation, this perspective overlooks a critical actor within the R&D network – the headquarters. In fact, existing research suggests that knowledge exchange between subsidiaries is often limited, whereas the flow of information between subsidiaries and the headquarters plays a more pivotal role in leveraging subsidiary knowledge for innovation (Faems et al., Reference Faems, Bos, Noseleit and Leten2020; Miao et al., Reference Miao, Zeng and Lee2016; Zhang et al., Reference Zhang, Jiang and Cantwell2019). As the structural hub of the corporate R&D network, the headquarters possesses a unique positional advantage that enables it to bridge geographically separated and cognitively diverse nodes. This centrality allows it to mitigate the barriers of spatial separation by facilitating cross-unit knowledge flows and aligning innovation efforts across the network. Accordingly, we propose that when the headquarters is geographically closer to the target, it is better positioned to absorb knowledge from the acquired firm, which supports leveraging and integrating non-redundant knowledge from both the target and distant R&D subsidiaries. In doing so, headquarters–target proximity moderates the impact of subsidiary–target distance by mitigating integration challenges, enhancing inter-unit synergies, and ultimately fostering innovation.
Building on this logic, we offer a more detailed account of the moderating effect. First, when the headquarters is geographically proximate to the target, it can rapidly gain a comprehensive understanding of the target’s knowledge background (Chakrabarti & Mitchell, Reference Chakrabarti and Mitchell2013). Based on this understanding, the headquarters can delineate clear innovation trajectories, such as leveraging the target’s technologies to enhance current product development or expand into new markets, ensuring alignment with the firm’s long-term strategic vision (Friesl & Siberzahn, Reference Friesl and Siberzahn2017). Crucially, geographic proximity enhances the headquarters’ ability to integrate heterogeneous knowledge across organizational units. By centrally evaluating the strengths, weaknesses, and knowledge domains of both the target and its subsidiaries, the headquarters can make precise decisions regarding resource allocation, role assignment, and integration sequencing (Björkman et al., Reference Björkman, Barner-Rasmussen and Li2004; Dellestrand & Kappen, Reference Dellestrand and Kappen2011). It can assign complementary roles to each unit, ensure that core competencies are preserved, and actively recombine knowledge to unlock innovation synergies.
Importantly, the coordinating role of the headquarters becomes particularly valuable when the target is geographically distant from the firm’s existing R&D subsidiaries. Such spatial separation often reflects greater knowledge heterogeneity, which offers potential for novel recombination while posing greater integration challenges (Lahiri, Reference Lahiri2010). In these contexts, the headquarters that is close to the newly acquired target can function as an integrative nexus, effectively absorbing and synthesizing the diverse, non-overlapping knowledge bases of both the target and the subsidiaries (Baaij & Slangen, Reference Baaij and Slangen2013; Glaeser, Glaeser, & Labro, Reference Glaeser, Glaeser and Labro2023). By enabling the strategic recombination of cognitively distant yet complementary knowledge, headquarters-target proximity allows the firm to turn geographic separation between new and existing R&D subsidiaries into a source of innovative complementarity, thereby enhancing post-acquisition innovation.
Second, the headquarters is pivotal in facilitating communication and collaboration between the R&D subsidiaries and the target (Friesl & Siberzahn, Reference Friesl and Siberzahn2017). As a newcomer, a newly acquired company often remains isolated due to limited communication with other R&D subsidiaries (Monteiro, Arvidsson, & Birkinshaw, Reference Monteiro, Arvidsson and Birkinshaw2008; Williams & Nones, Reference Williams and Nones2009). Their unique, non-redundant knowledge can be difficult to translate or integrate into a more universal, organizational context (Hong & Nguyen, Reference Hong and Nguyen2009). Headquarters located in proximity to the target can help establish and structure knowledge transfer channels that connect the target and distant R&D subsidiaries (Holm, Johanson, & Thilenius, Reference Holm, Johanson and Thilenius1995; Zhang et al., Reference Zhang, Jiang and Cantwell2019). By doing so, the headquarters help to absorb the target’s tacit knowledge and complex technologies, strategically channeling them toward distant R&D subsidiaries. In doing so, the headquarters enhances the connectivity between spatially dispersed units and facilitates the recombination of non-overlapping knowledge, thereby amplifying the innovative potential following the acquisition (Najafi-Tavani, Giroud, & Andersson, Reference Najafi-Tavani, Giroud and Andersson2014).
In summary, headquarters in close proximity to the target can provide strategic direction, clarify roles and responsibilities, and establish effective communication channels for knowledge integration between the geographically distant target and existing R&D subsidiaries, ultimately enhancing innovation at the group level. This spatial configuration – close to headquarters and distant to R&D subsidiaries – balances knowledge nonredundancy and the integration capacity, thereby promoting post-acquisition innovation. Therefore, we propose the following hypothesis:
Hypothesis 3 (H3): The closer the headquarters is to the target, the stronger the positive effect of the geographic distance between the R&D subsidiaries and the target on innovation.
The Moderating Effect of Geographic Dispersion
The geographic dispersion of a corporate group refers to the extent to which its R&D subsidiaries are distributed across multiple geographic locations (Gao et al., Reference Gao, Ng and Wang2008). This geographical structural characteristic influences how knowledge is created, accessed, and integrated within the firm’s innovation network. Greater geographic dispersion implies higher spatial complexity, more diverse knowledge sources, and greater challenges in coordination and control (Erkelens et al., Reference Erkelens, Van den Hooff, Huysman and Vlaar2015; Gao et al., Reference Gao, Ng and Wang2008; Lahiri, Reference Lahiri2010).
We argue that geographic dispersion will moderate the effect of distance in technological acquisitions because it reflects the broader structural context in which the acquisition relationship is embedded. The acquisition of a new target does not occur in isolation within a corporate group; rather, it must be reconciled with the existing R&D network of the acquiring corporate group (Öberg et al., Reference Öberg, Henneberg and Mouzas2007). Network theory suggests that the overall structure of the network influences the behavior and outcomes of individual actors embedded within it (Iurkov & Benito, Reference Iurkov and Benito2018; Vasudeva, Zaheer, & Hernandez, Reference Vasudeva, Zaheer and Hernandez2013). The extent to which a corporate group can benefit from external knowledge ties depends largely on the configuration of its internal network structure (Grigoriou & Rothaermel, Reference Grigoriou and Rothaermel2017). Geographic dispersion, as a key structural characteristic, shapes how knowledge is generated, accessed, and recombined across spatially distributed units. As such, when a new acquisition is introduced into the network, the degree of geographic dispersion affects how the corporate group absorbs and integrates the acquired knowledge to stimulate innovation. Building on this premise, we further explore the moderating role of geographic dispersion.
First, we argue that geographic dispersion amplifies the negative effect of the headquarters-target distance. Greater geographic dispersion increases the coordination burden on the headquarters. In highly dispersed corporate groups, where subsidiaries operate in diverse technological and market environments with distinct priorities and knowledge systems, the headquarters must coordinate this complex network, greatly increasing managerial and strategic complexity (Kafouros et al. Reference Kafouros, Wang, Mavroudi, Hong and Katsikeas2018; Singh, Reference Singh2008). When the acquired target is also geographically distant, the challenge of integrating it into the broader network becomes even more difficult, as it adds another remote node that requires substantial coordination and alignment efforts. Geographic dispersion also dilutes the headquarters’ managerial attention, weakening its capacity to engage deeply with the distant target. As the headquarters juggles oversight across numerous geographically dispersed subsidiaries, its cognitive and relational resources are stretched thin (Ciabuschi, Dellestrand, & Holm, Reference Ciabuschi, Dellestrand and Holm2012). This dispersion makes it harder for the headquarters to closely monitor and support any single remote unit. Consequently, the negative effects associated with the distance between the headquarters and the acquired target – such as delayed post-acquisition integration, strategic ambiguity, and impeded knowledge transfer – are more likely to be amplified in highly dispersed corporate groups. Therefore, we propose the following hypothesis:
Hypothesis 4 (H4): When the geographic dispersion of the corporate group is higher, the negative effect of the geographic distance between the headquarters and the target on post-acquisition innovation will be stronger.
Meanwhile, we argue that geographic dispersion also weakens the positive effect of the geographic distance between R&D subsidiaries and the target. Geographic dispersion inherently brings about substantial knowledge heterogeneity across the corporate group, as subsidiaries operate under different regional contexts, serve varied markets, and specialize in distinct technological domains (Gao et al., Reference Gao, Ng and Wang2008; Lahiri, Reference Lahiri2010). This internal diversity may substitute for the novel and non-redundant knowledge that could otherwise be gained from a geographically distant target, thereby diminishing its benefits.
As Grigoriou and Rothaermel (Reference Grigoriou and Rothaermel2017: 398) note, ‘two activities interact as substitutes if the marginal benefit of each activity decreases in the presence of the other activity’. Specifically, they argue that external knowledge sourcing can substitute for internal knowledge sourcing. Ocasio’s (Reference Ocasio1997) attention-based view provides a cognitive mechanism explaining this substitution effect: simultaneously attending to both internal and external knowledge sources places significant demands on managers’ limited attentional capacity. In our context, the external novelty derived from a geographically distant target may substitute for the internal heterogeneity already generated by a dispersed R&D network. Put differently, geographic dispersion exposes firms to a wide range of perspectives, practices, and technologies, reducing the incremental value of additional heterogeneity from distant targets.
Specifically, when dispersion is high, managers must allocate attention across diverse subsidiaries, each embedded in distinct contexts. Due to constraints on managerial attention, they may pay insufficient attention to newly acquired external knowledge, further reducing the likelihood that distant target knowledge is effectively integrated and utilized. Consequently, the novelty offered by a geographically distant target is less distinctive and less likely to stimulate innovation, weakening the positive effect of geographic distance. By contrast, when geographic dispersion is low, subsidiaries operate in relatively homogeneous contexts. Managers can allocate attention more effectively to newly acquired knowledge, making the novelty from distant targets more valuable for stimulating innovation. Thus, the positive effect of geographic distance on post-acquisition innovation should be stronger under low dispersion. Therefore, we propose the following hypothesis:
Hypothesis 5 (H5): When the geographic dispersion of the corporate group is higher, the positive effect of the geographic distance between the R&D subsidiaries and the target on post-acquisition innovation will be weaker.
Methods
Setting and Sample
We focus on domestic technological acquisitions in China, a setting well-suited for studying the strategic implications of geographic distance within national borders (Zhang & Gu, Reference Zhang and Gu2021; Zhang et al., Reference Zhang, Zhu and Lyu2022). This single-country design minimizes institutional and regulatory confounds while leveraging substantial geographic distance. Prior research has shown that intra-national geographic distance can meaningfully affect acquisition decisions and innovation outcomes (Chakrabarti & Mitchell, Reference Chakrabarti and Mitchell2013, Reference Chakrabarti and Mitchell2016; Ragozzino & Reuer, Reference Ragozzino and Reuer2011; Reuer & Lahiri, Reference Reuer and Lahiri2014). In particular, China’s vast territory and regional variation has supported a growing body of research on domestic investment, acquisition strategy, and innovation (e.g., Huang, Qiu, Wu, & Yao, Reference Huang, Qiu, Wu and Yao2023; Jin, Yang, & Zhang, Reference Jin, Yang and Zhang2021; Tian, Kou, & Zhang, Reference Tian, Kou and Zhang2020; Zhang & Gu, Reference Zhang and Gu2021; Zhang et al., Reference Zhang, Zhu and Lyu2022), reinforcing the validity of using China as an appropriate empirical setting.
Our main sample is constructed from the WIND Financial DatabaseFootnote 1, a widely used source in M&A research that records all domestic acquisition events initiated by A-share listed firms in China. We focused on transactions announced between 2008 and 2018. From WIND, we obtained detailed deal-level information, including transaction status, share percentage acquired, and the full names of both the acquiring and target firms. Using the unique stock codes of the acquiring firms, we retrieved their subsidiary information and firm-level information from the China Stock Market and Accounting Research (CSMAR)Footnote 2 and Chinese Research Data Services Platform (CNRDS) database.Footnote 3 We then manually searched for patent application records in the IncoPat Patent DatabaseFootnote 4, using the full names of the acquiring firms and their subsidiaries. Subsidiaries that had filed patents within the 5 years prior to the acquisition were classified as R&D subsidiaries. Finally, we manually matched the full names of headquarters, R&D subsidiaries, and target firms to their respective geographic coordinates (latitude and longitude) using registration data from QichachaFootnote 5, a comprehensive enterprise information platform in China. These coordinates were used to calculate geographic distances.
Following prior studies, we define an acquisition as technological acquisition when the target has applied for at least one patent in the preceding 5 years before the announcement of the acquisition (Ahuja & Katila, Reference Ahuja and Katila2001; Song, Reference Song2007). We further confirm the technology-led purpose of these acquisitions by reading the media articles covering the event 3 months before and after the announcement date. To account for the distinct roles of headquarters and R&D subsidiaries, we restrict the sample to acquiring firms that have at least one R&D subsidiary – defined as a subsidiary that filed at least 1 patent in the 5 years preceding the acquisition (Awate, Larsen, & Mudambi, Reference Awate, Larsen and Mudambi2015). We also focus on deals with a sought equity stake of more than 50%, as such a level of ownership can enable the acquiring firm to fully integrate the target’s technological capabilities, intellectual property, and expertise into its own operations. We further focus on completed deals based on the status of each acquisition. The aforementioned steps yield a sample of 346 deals across 29 provinces in China initiated by 266 listed companies spanning 14 industries identified by the Industry Classification Codes of China.
Variables
Dependent variables
To test our hypotheses, we regress the post-acquisition innovation performance of the corporate group on the dual geographic distances and their interactions. Despite some limitations, patent-based measures are widely accepted as proxies of innovation performance, especially in the context of technological acquisition (Ahuja & Katila, Reference Ahuja and Katila2001; Grigoriou & Rothaermel, Reference Grigoriou and Rothaermel2017; Makri, Hitt, & Lane, Reference Makri, Hitt and Lane2010). To measure post-acquisition Innovation performance of the corporate group, we use the count of patents applied for by the acquiring party (including the headquarters and R&D subsidiaries, with the acquired target considered part of the subsidiary network after the acquisition) in the 3 years (1095 days) following the completion date of the acquisition, following prior studies that prefer patent applications over granted patents for their timelier reflection of technological activity (Jandhyala & Phene, Reference Jandhyala and Phene2015; McCarthy & Aalbers, Reference McCarthy and Aalbers2022; Valentini, Reference Valentini2012). As part of our robustness checks, we find consistent results when using a shorter observation window (e.g., Ahuja & Katila, Reference Ahuja and Katila2001) or when controlling for the acquirer’s pre-acquisition innovation performance (e.g., Makri et al., Reference Makri, Hitt and Lane2010).
Independent variables
The main independent variables are Distance HQ to target and Distance subs to target, which indicate the geographic distances from the target to the headquarters and to the R&D subsidiaries of the acquiring firm, respectively. We construct Distance HQ to target and Distance subs to target as follows. First, we use Python scripts together with an online mapping API to obtain the precise longitude and latitude of each headquarters, R&D subsidiary, and target firm. We then compute the great-circle (spherical) distance between every pair of locations using the Haversine (half-versine) formula (Zaheer & Hernandez, Reference Zaheer and Hernandez2011):
 \begin{equation}Geo{\text{ }}dist = 2arcsin\sqrt {si{n^2}\frac{{Lat1 - Lat2}}{2} + cosLat1 \times cosLat2 \times si{n^2}\frac{{Lng1 - Lng2}}{2}} \times 6378.13\end{equation}
where Lat1 and Lat2 denote the latitudes and Lng1 and Lng2 denote the longitudes of locations 1 and 2. Based on these pairwise distances, Distance HQ to target is defined as the geographic distance between the acquiring firm’s headquarters and the target, and Distance subs to target as the average geographic distance between all R&D subsidiaries of the acquirer and the target. To reduce skewness, we take the natural logarithm of both distance measures. In a robustness check, we have constructed a weighted measure of Distance subs to target to account for heterogeneity in innovation relevance across subsidiaries.
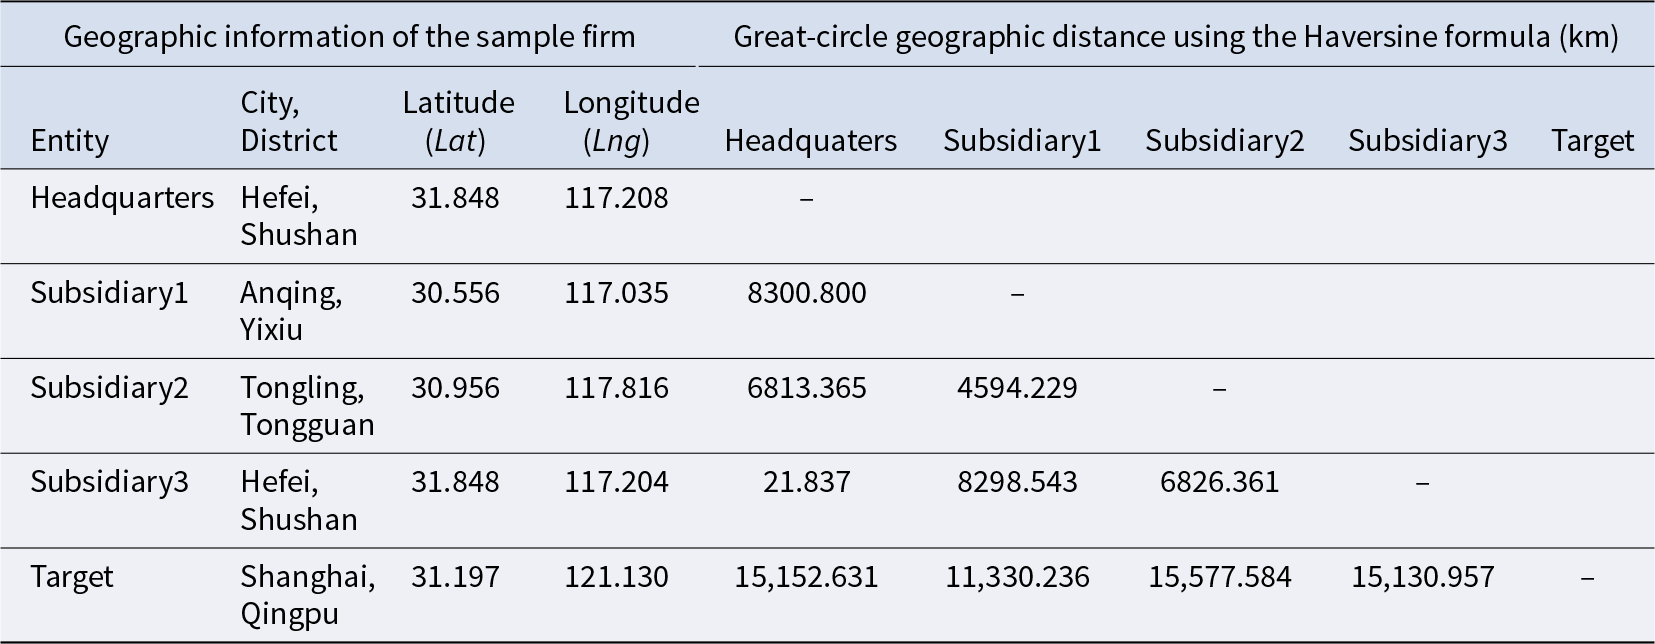
As an illustrative example, consider ANKE BIOTECHNOLOGY, whose headquarters is located in Shushan District, Hefei, and its acquisition target, Shanghai Suhao Yiming Pharmaceutical Co., Ltd., located in Qingpu District, Shanghai. ANKE BIOTECHNOLOGY has three R&D subsidiaries, each located in a different district. Following the procedure described above, we first obtain the latitude and longitude of the headquarters, the three subsidiaries, and the target, and then compute the great-circle distances using the Haversine formula (see Table 1). On this basis, we calculate that the natural logarithm of the distance from the headquarters to the target (Distance HQ to target) is 9.626, and the natural logarithm of the average distance from the three R&D subsidiaries to the target (Distance subs to target) is 9.548.
Calculating examples for geographic distance

Table 1 Long description
Geographic information is listed for five entities with city and district, latitude, and longitude, plus great circle geographic distance in kilometers between each pair. Headquarters is Hefei, Shushan at latitude 31.848 and longitude 117.208. Subsidiary1 is Anqing, Yixiu at 30.556 and 117.035, with distance to Headquarters 8300.800 km. Subsidiary2 is Tongling, Tongguan at 30.956 and 117.816, with distances to Headquarters 6813.365 km and to Subsidiary1 4594.229 km. Subsidiary3 is Hefei, Shushan at 31.848 and 117.204, with distances to Headquarters 21.837 km, to Subsidiary1 8298.543 km, and to Subsidiary2 6826.361 km. Target is Shanghai, Qingpu at 31.197 and 121.130, with distances to Headquarters 15,152.631 km, to Subsidiary1 11,330.236 km, to Subsidiary2 15,577.584 km, and to Subsidiary3 15,130.957 km.
Moderating variables
We construct a variable, Geographic dispersion, defined as the number of distinct cities in which the group’s R&D subsidiaries are located in the year prior to the acquisition, to capture the spatial distribution of its organizational footprint (Gao et al., Reference Gao, Ng and Wang2008). Location data are obtained from the CSMAR database. The results remain consistent when using the number of provinces covered by the subsidiaries as an alternative measure.
Control variables
We control for a series of variables in terms of the acquirer, the target, and the acquirer–target pair at both micro- and macro-levels. As for the acquirer, we first control for Acquirer R&D intensity, which is measured by the proportion of R&D expenditure to total assets. We also control for Distance HQ to subs, measured as the average geographic distance between the corporate headquarters and its R&D subsidiaries. The distance between each R&D subsidiary and the headquarters is calculated using Equation (1), consistent with the method used to construct the independent variables.This variable captures the extent of spatial separation within the corporate group, which may shape the diversity of information and resources accessible to R&D units and, in turn, influence innovation performance (Ambos & Schlegelmilch, Reference Ambos and Schlegelmilch2007; Baaij & Slangen, Reference Baaij and Slangen2013; Ciabuschi et al., Reference Ciabuschi, Dellestrand and Holm2012; Faems et al., Reference Faems, Bos, Noseleit and Leten2020). As the relative positioning of headquarters and subsidiaries is not the focus of our theory, we therefore treat Distance HQ to subs as a control variable to account for potential background organizational geography. Acquirer age refers to the number of years the firm has been in operation and the natural logarithm of it is taken, since the accumulated experience through long-term operation is beneficial for firms to tap external knowledge (Hite & Hesterly, Reference Hite and Hesterly2001). Additionally, we control for Acquirer profit using return on assets (ROA) and for Acquirer size using the natural logarithm of total employees. To account for acquisition intensity, we include the Acquirer acquisitions conducted by the firm in the focal year (Lee & Kim, Reference Lee and Kim2016; Prabhu, Chandy, & Ellis, Reference Prabhu, Chandy and Ellis2005). In terms of the target, Target acquisition share is calculated by the amount of shares that the acquirer sought in the target (Wang et al., Reference Wang, Wei and Zhao2022). The more shares acquired by the acquiring party, the greater its influence over the target company, which could potentially disrupt the target company’s existing innovation activities. Target tech-advancement is measured as the average of the advancement of all patents applied by the target in the prior 5 years. The advancement index of each patent, ranging from 0 to 10, is defined by Incopat database with a higher value indicating a more advanced technology. The advanced technologies acquired by the acquiring party are expected to further stimulate subsequent innovative outcomes. In the pair level, we also control for Advancement gap by calculating the absolute difference in technological advancement between the two parties. A substantial difference in technological advancement may impair the integration of innovation activities between the two. Finally, we also control for Domestic institutional difference, measured as the absolute difference in marketization index scores between the provinces of the acquirer and the target. This captures within-country institutional heterogeneity, which has been shown to influence integration complexity and acquisition outcomes in a single-country context (Chakrabarti & Mitchell, Reference Chakrabarti and Mitchell2016; Zhou, Gao, & Zhao, Reference Zhou, Gao and Zhao2017). The year and industry are included as dummies.
Estimation
Our objective is to examine the dual effects of geographic distance in acquisition on the acquirer’s innovation performance. Since the dependent variable Innovation performance is a non-negative counting variable, we can use the count models, such as Poisson and negative binomial regression models (Cameron & Trivedi, Reference Cameron and Trivedi2005). Given that the variance of the dependent variable is much larger than its mean (see Table 1), evidence for excessive dispersion, we apply the negative binomial models in the main analysis (Frome, Kutner, & Beauchamp, Reference Frome, Kutner and Beauchamp1973).
Results
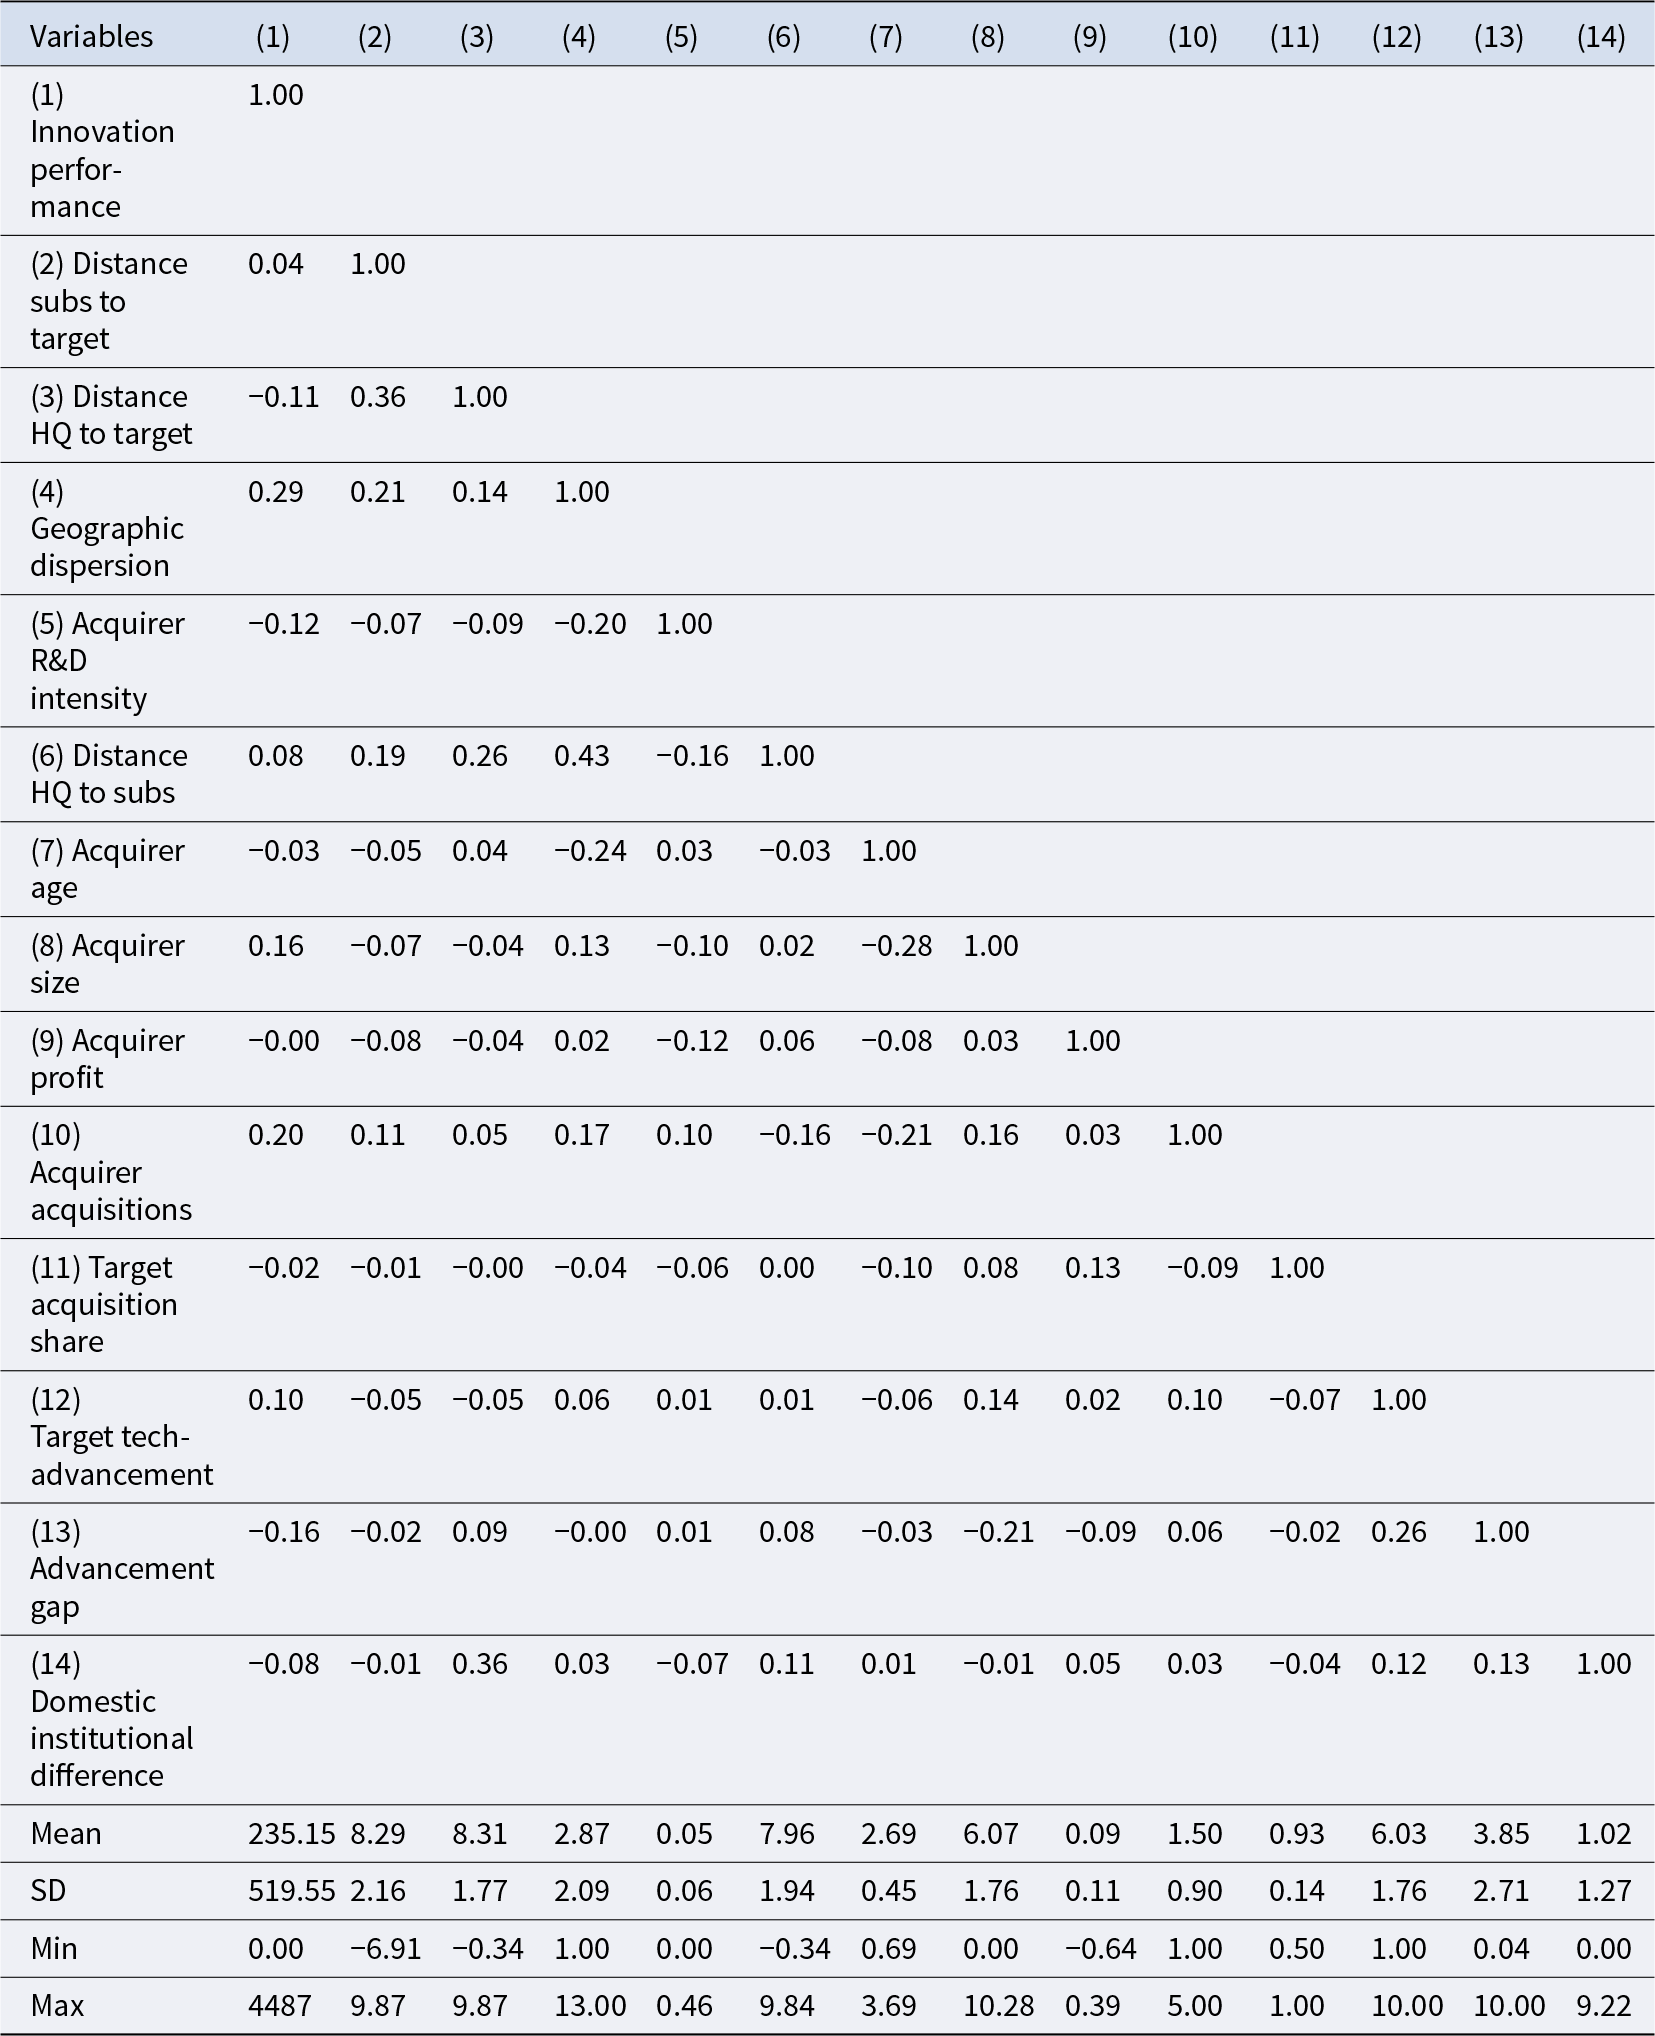
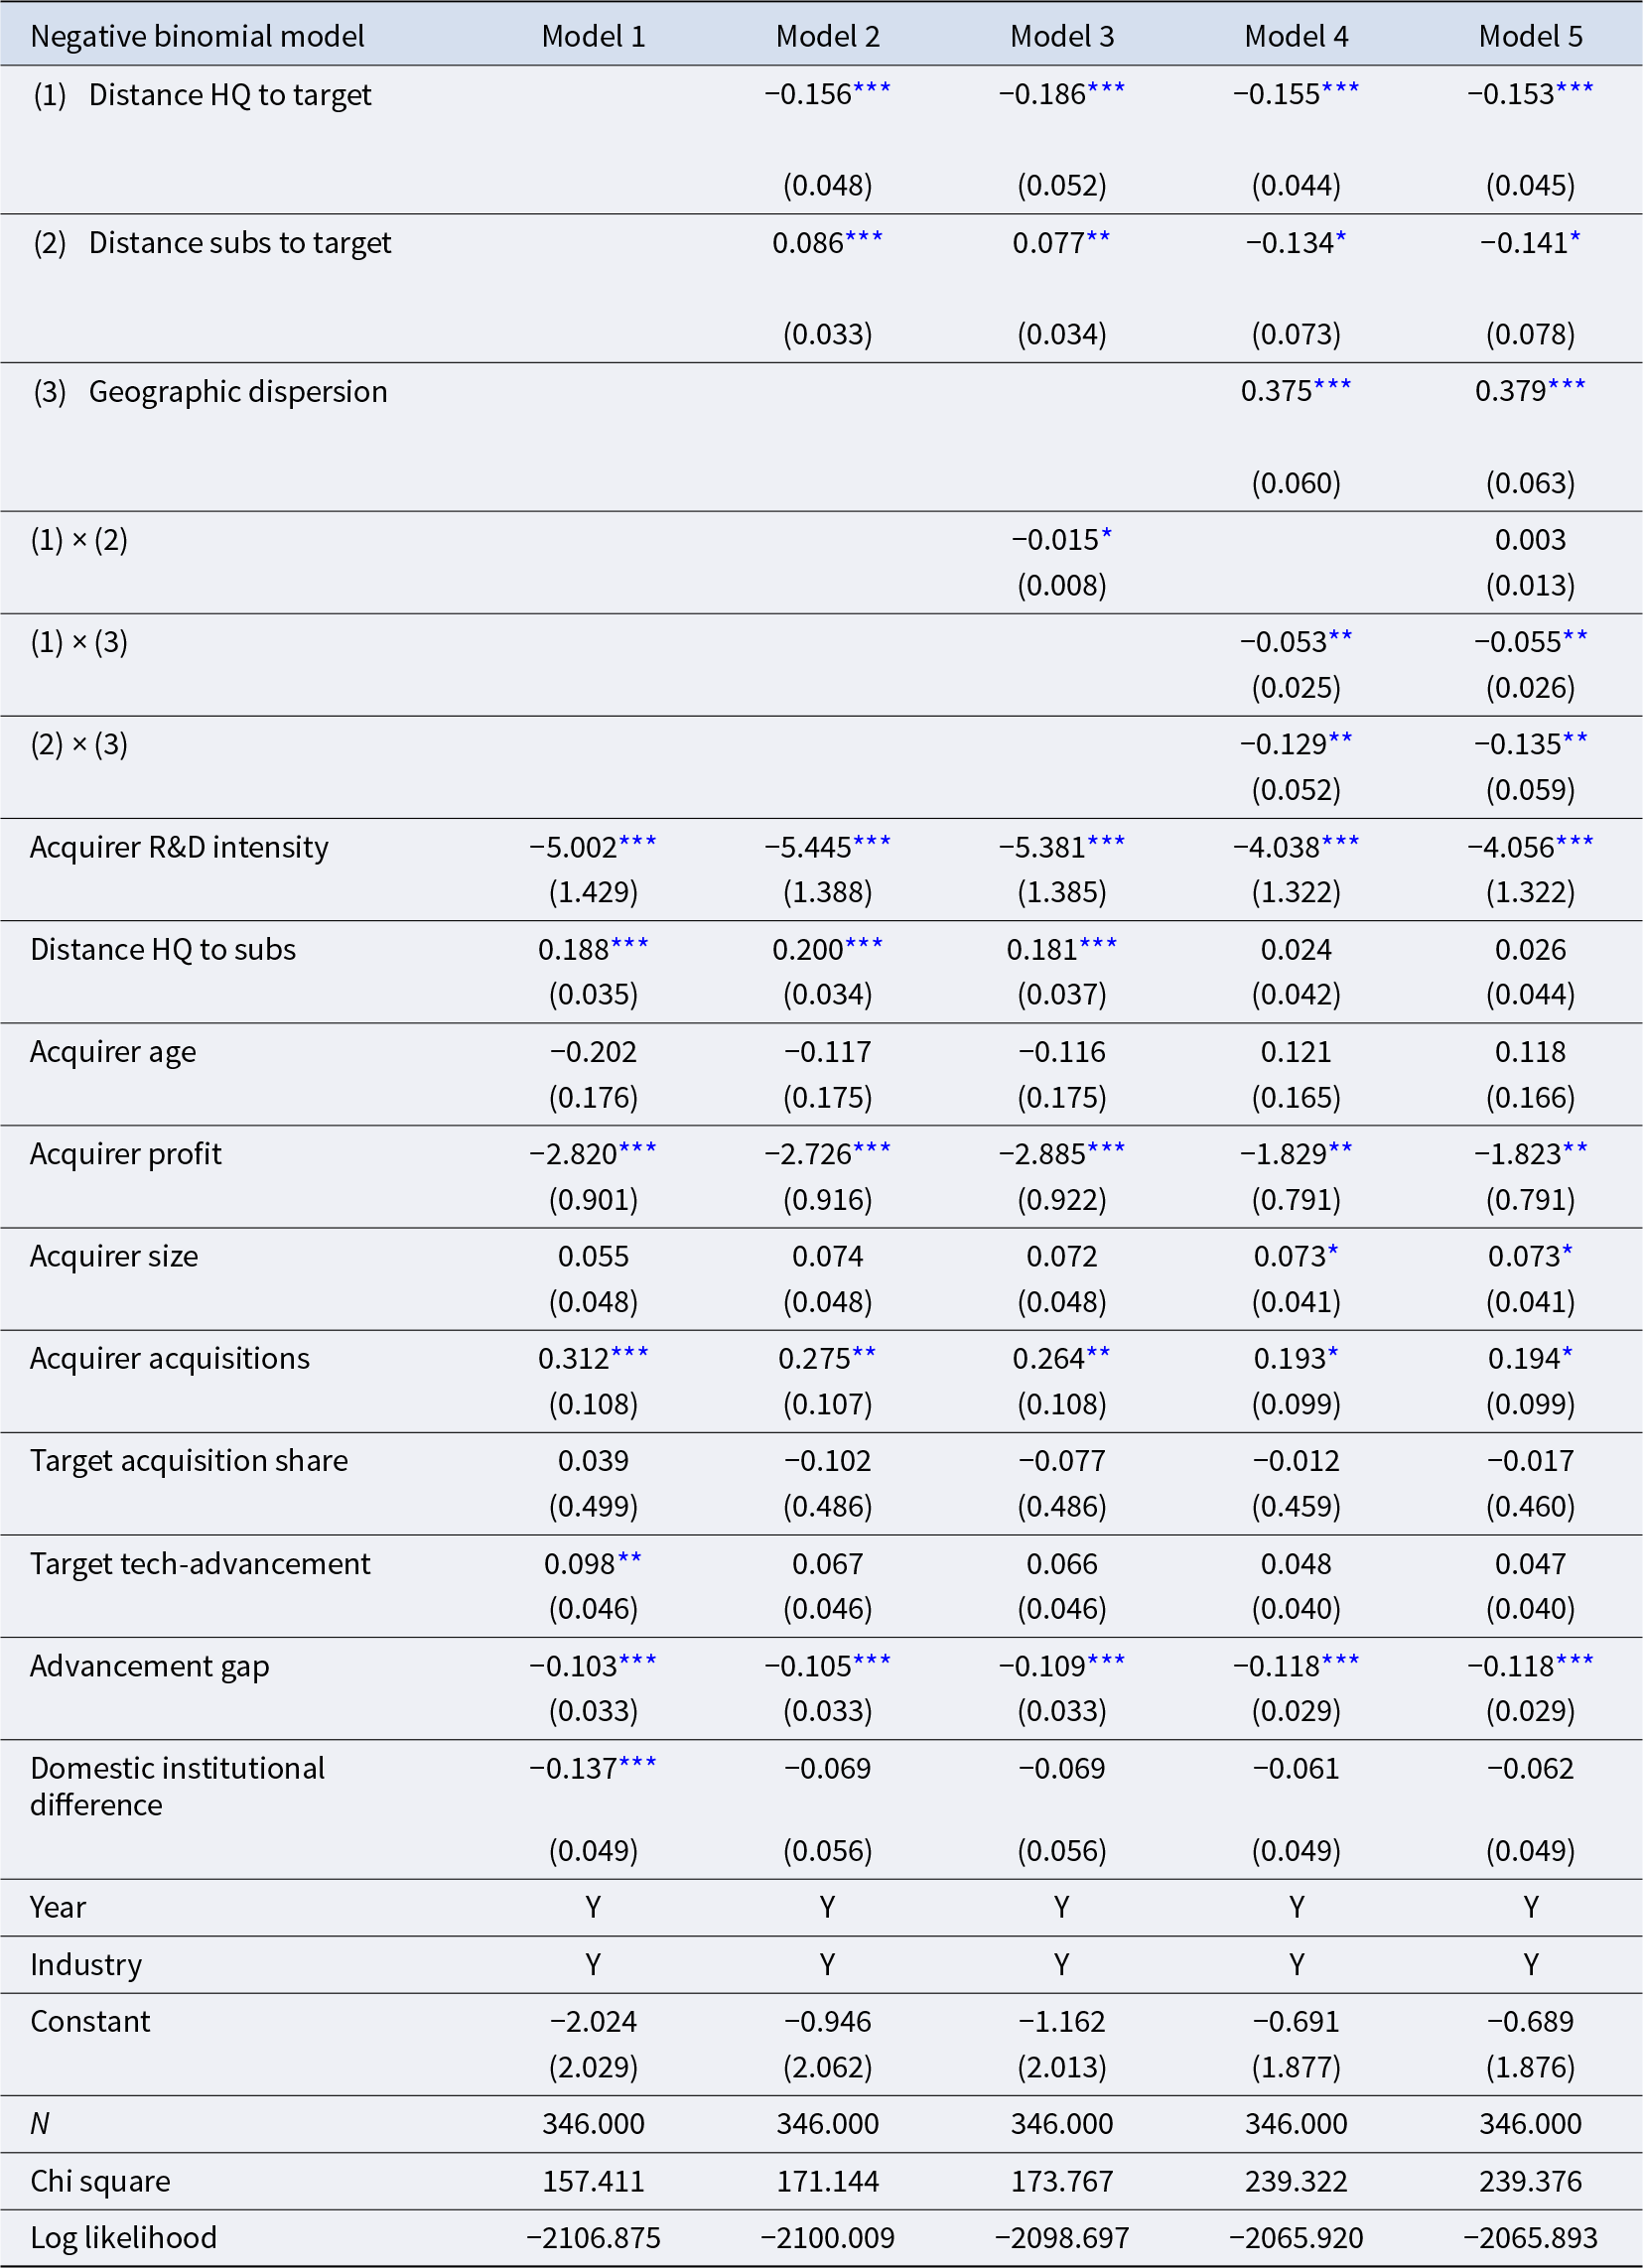
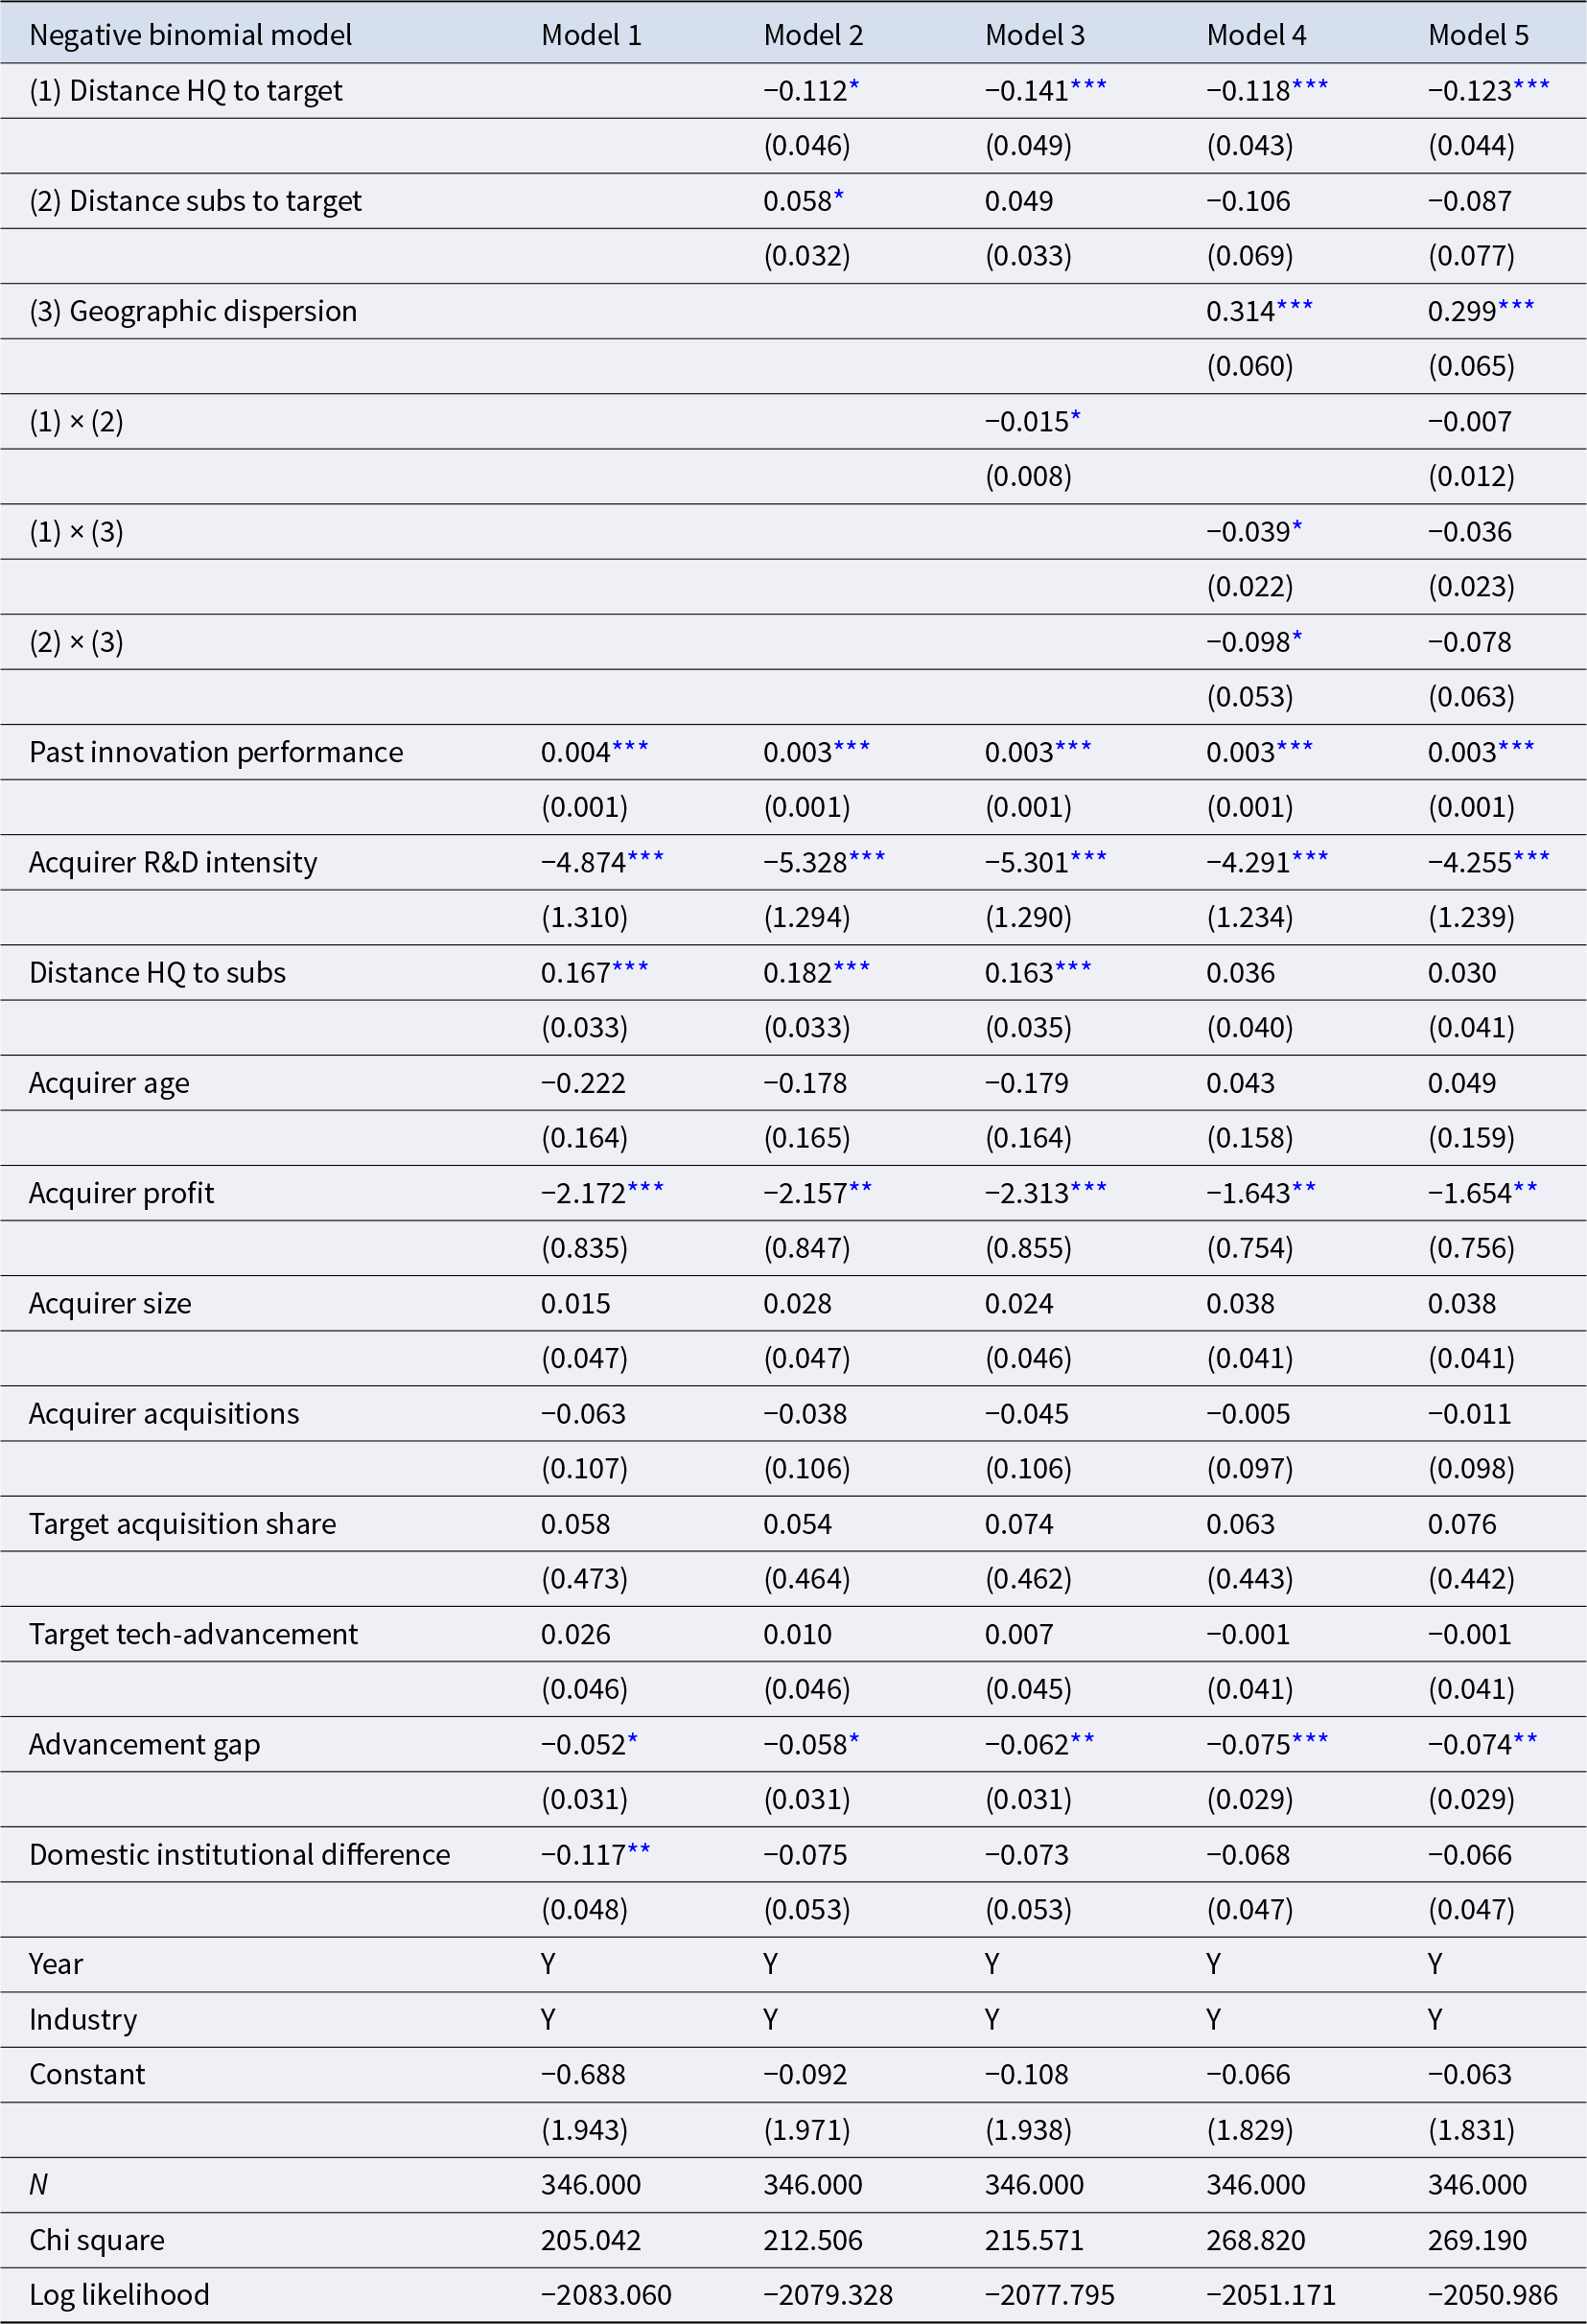
Table 2 presents the descriptive statistics and the correlations of the variables. Table 3 reports the main results, in which Model 1 only contains the control variables, and Models 2–5 examine the hypotheses, respectively.
Descriptive statistics and correlations

Note: N = 346.
Geographic distance and post-acquisition performance

Notes: Standard errors are reported in parentheses.
*** p < 0.01, ** p < 0.05, * p < 0.1.
Main Analysis
H1 predicts that the distance between the target and the headquarters is negatively associated with the post-acquisition innovation. The result in Model 2, where the coefficient of Distance HQ to target is negative and significant (β = −0.156; P-value = 0.001), is in line with H1. In terms of effect size, holding all other factors constant, the marginal effect of Distance HQ to target on Innovation performance is −36.53 (P-value = 0.003). Consistent with predictions about the geographic distance, post-acquisition innovation is better when the target is geographically closer to the headquarters.
H2 posits that the greater the geographic distance between the target and the R&D subsidiaries, the better the post-acquisition innovation performance of the acquiring party. In Model 2, the estimated coefficient of Distance subs to target is significantly positive (β = 0.086; P-value = 0.009), providing supportive evidence for H2. The marginal effect of Distance subs to target on Innovation Performance is 20.08 (P-value = 0.012) with all other factors at their means.
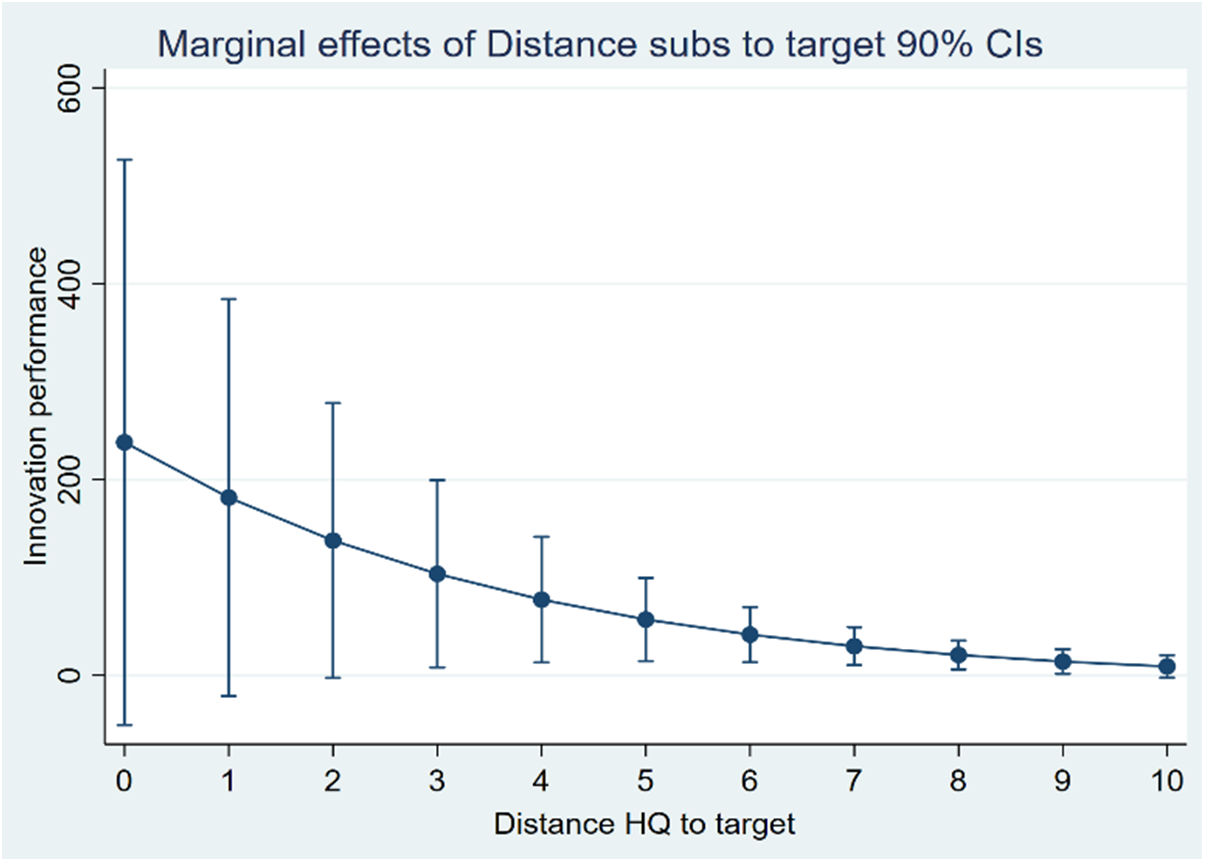
H3 predicts that when the target is farther from the headquarters, the positive association of the distance between the target and the R&D subsidiaries with innovation performance is weaker. Model 3 examines H3 by entering the interaction term between Distance HQ to target and Distance subs to target. The interaction term is significantly negative (β = −0.015; P-value = 0.080), indicating that Distance HQ to target negatively moderates the main effect of Distance subs to target. As the estimated results in nonlinear models may mislead the interpretation of the effect, we plot the marginal effects of Distance subs to target on Innovation performance across the range of Distance HQ to target in Figure 1. In terms of effect size, the marginal effect of Distance subs to target on Innovation performance is 14.02 (P-value = 0.065) when the Distance HQ to target is one standard deviation above its mean, otherwise 57 (P-value = 0.027) when the Distance HQ to target is one standard deviation below its mean. Thus, H3 is supported.
The interaction effect of Distance HQ to target and Distance subs to target

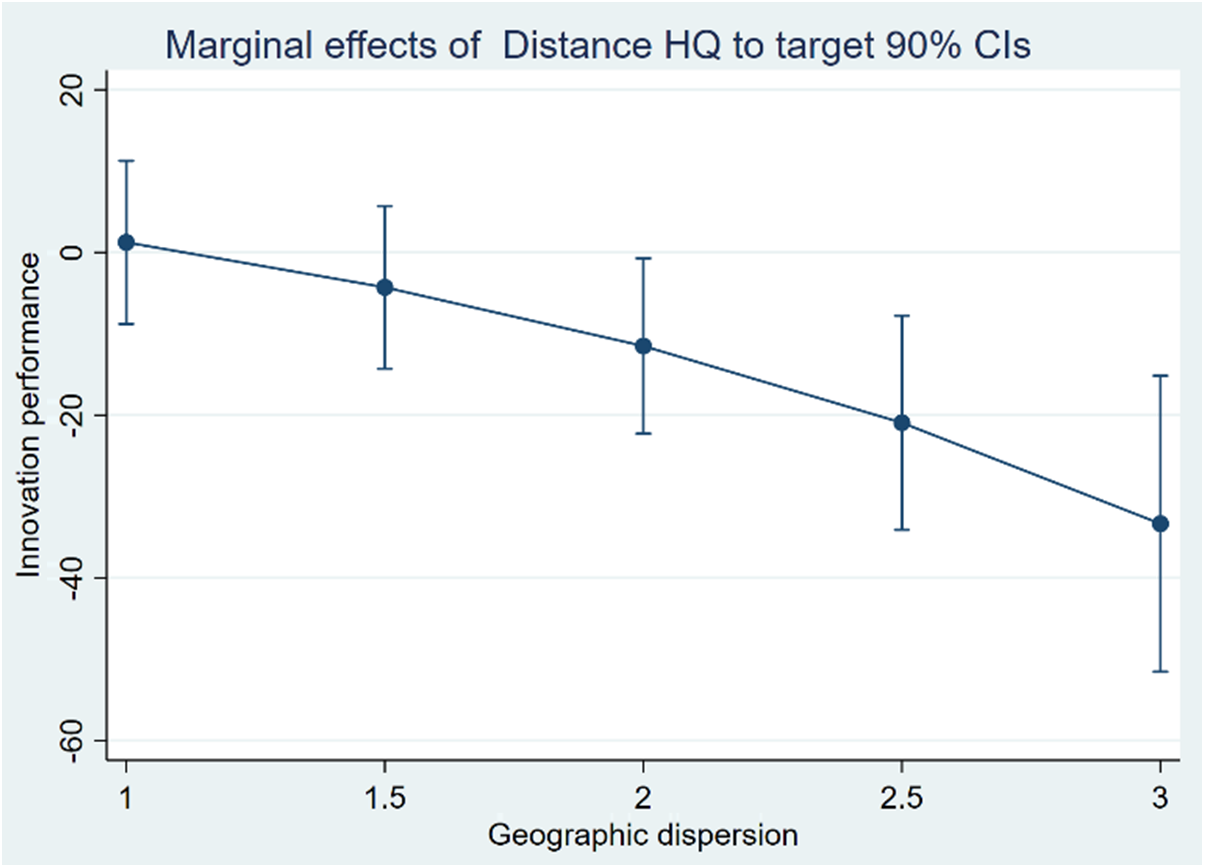
Turning to H4, which predicts that the geographic dispersion strengthens the negative effect of Distance HQ to target on Innovation performance, we include the interaction term between geographic dispersion and Distance HQ to target in Model 4 of Table 3. The model provides support for H4 with a significantly negative interaction term (β = −0.053; P-value = 0.033). Based on estimates from Model 4, Figure 2 presents the marginal effect of Distance HQ to target conditioning on the geographic dispersion of the acquirer. The marginal effects are significant using 90% confidence interval when the value of Distance HQ to target is above 2, i.e., 64% observations in our sample. The marginal effects plot provides support for H4: the marginal effect of Distance HQ to target is −29.69 (P-value = 0.003) at the mean level of acquirer geographic dispersion, and −133.94 (P-value = 0.027) at one standard deviation above the mean.
The contingent role of Geographic dispersion on the effect of Distance HQ to target

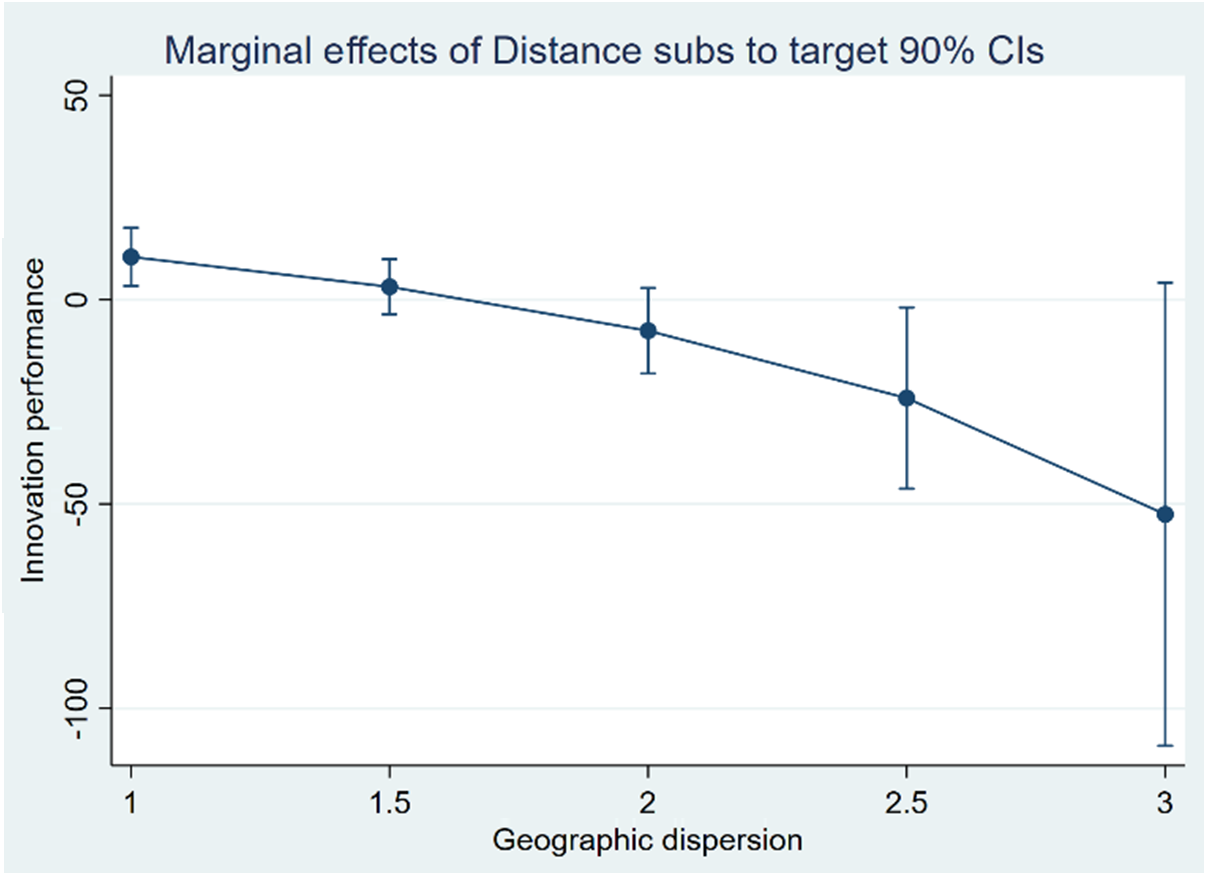
According to H5, the positive impact of geographic distance between the target and the R&D subsidiaries on innovation performance is weakened when geographic dispersion is higher. In Model 4 of Table 3, the interaction term of Geographic dispersion and Distance subs to target is significantly positive (β = −0.129; P-value = 0.014). Figure 3 plots that the marginal effects of Distance subs to target on the Innovation performance conditioning on the Geographic dispersion. As shown in the marginal effects plot, the effect of Distance subs to target is 12.68 (P-value = 0.007) at one standard deviation below the mean level of geographic dispersion, and is −38.95 (P-value = 0.091) when geographic dispersion is at its mean.
The contingent role of Geographic dispersion on the effect of Distance subs to target

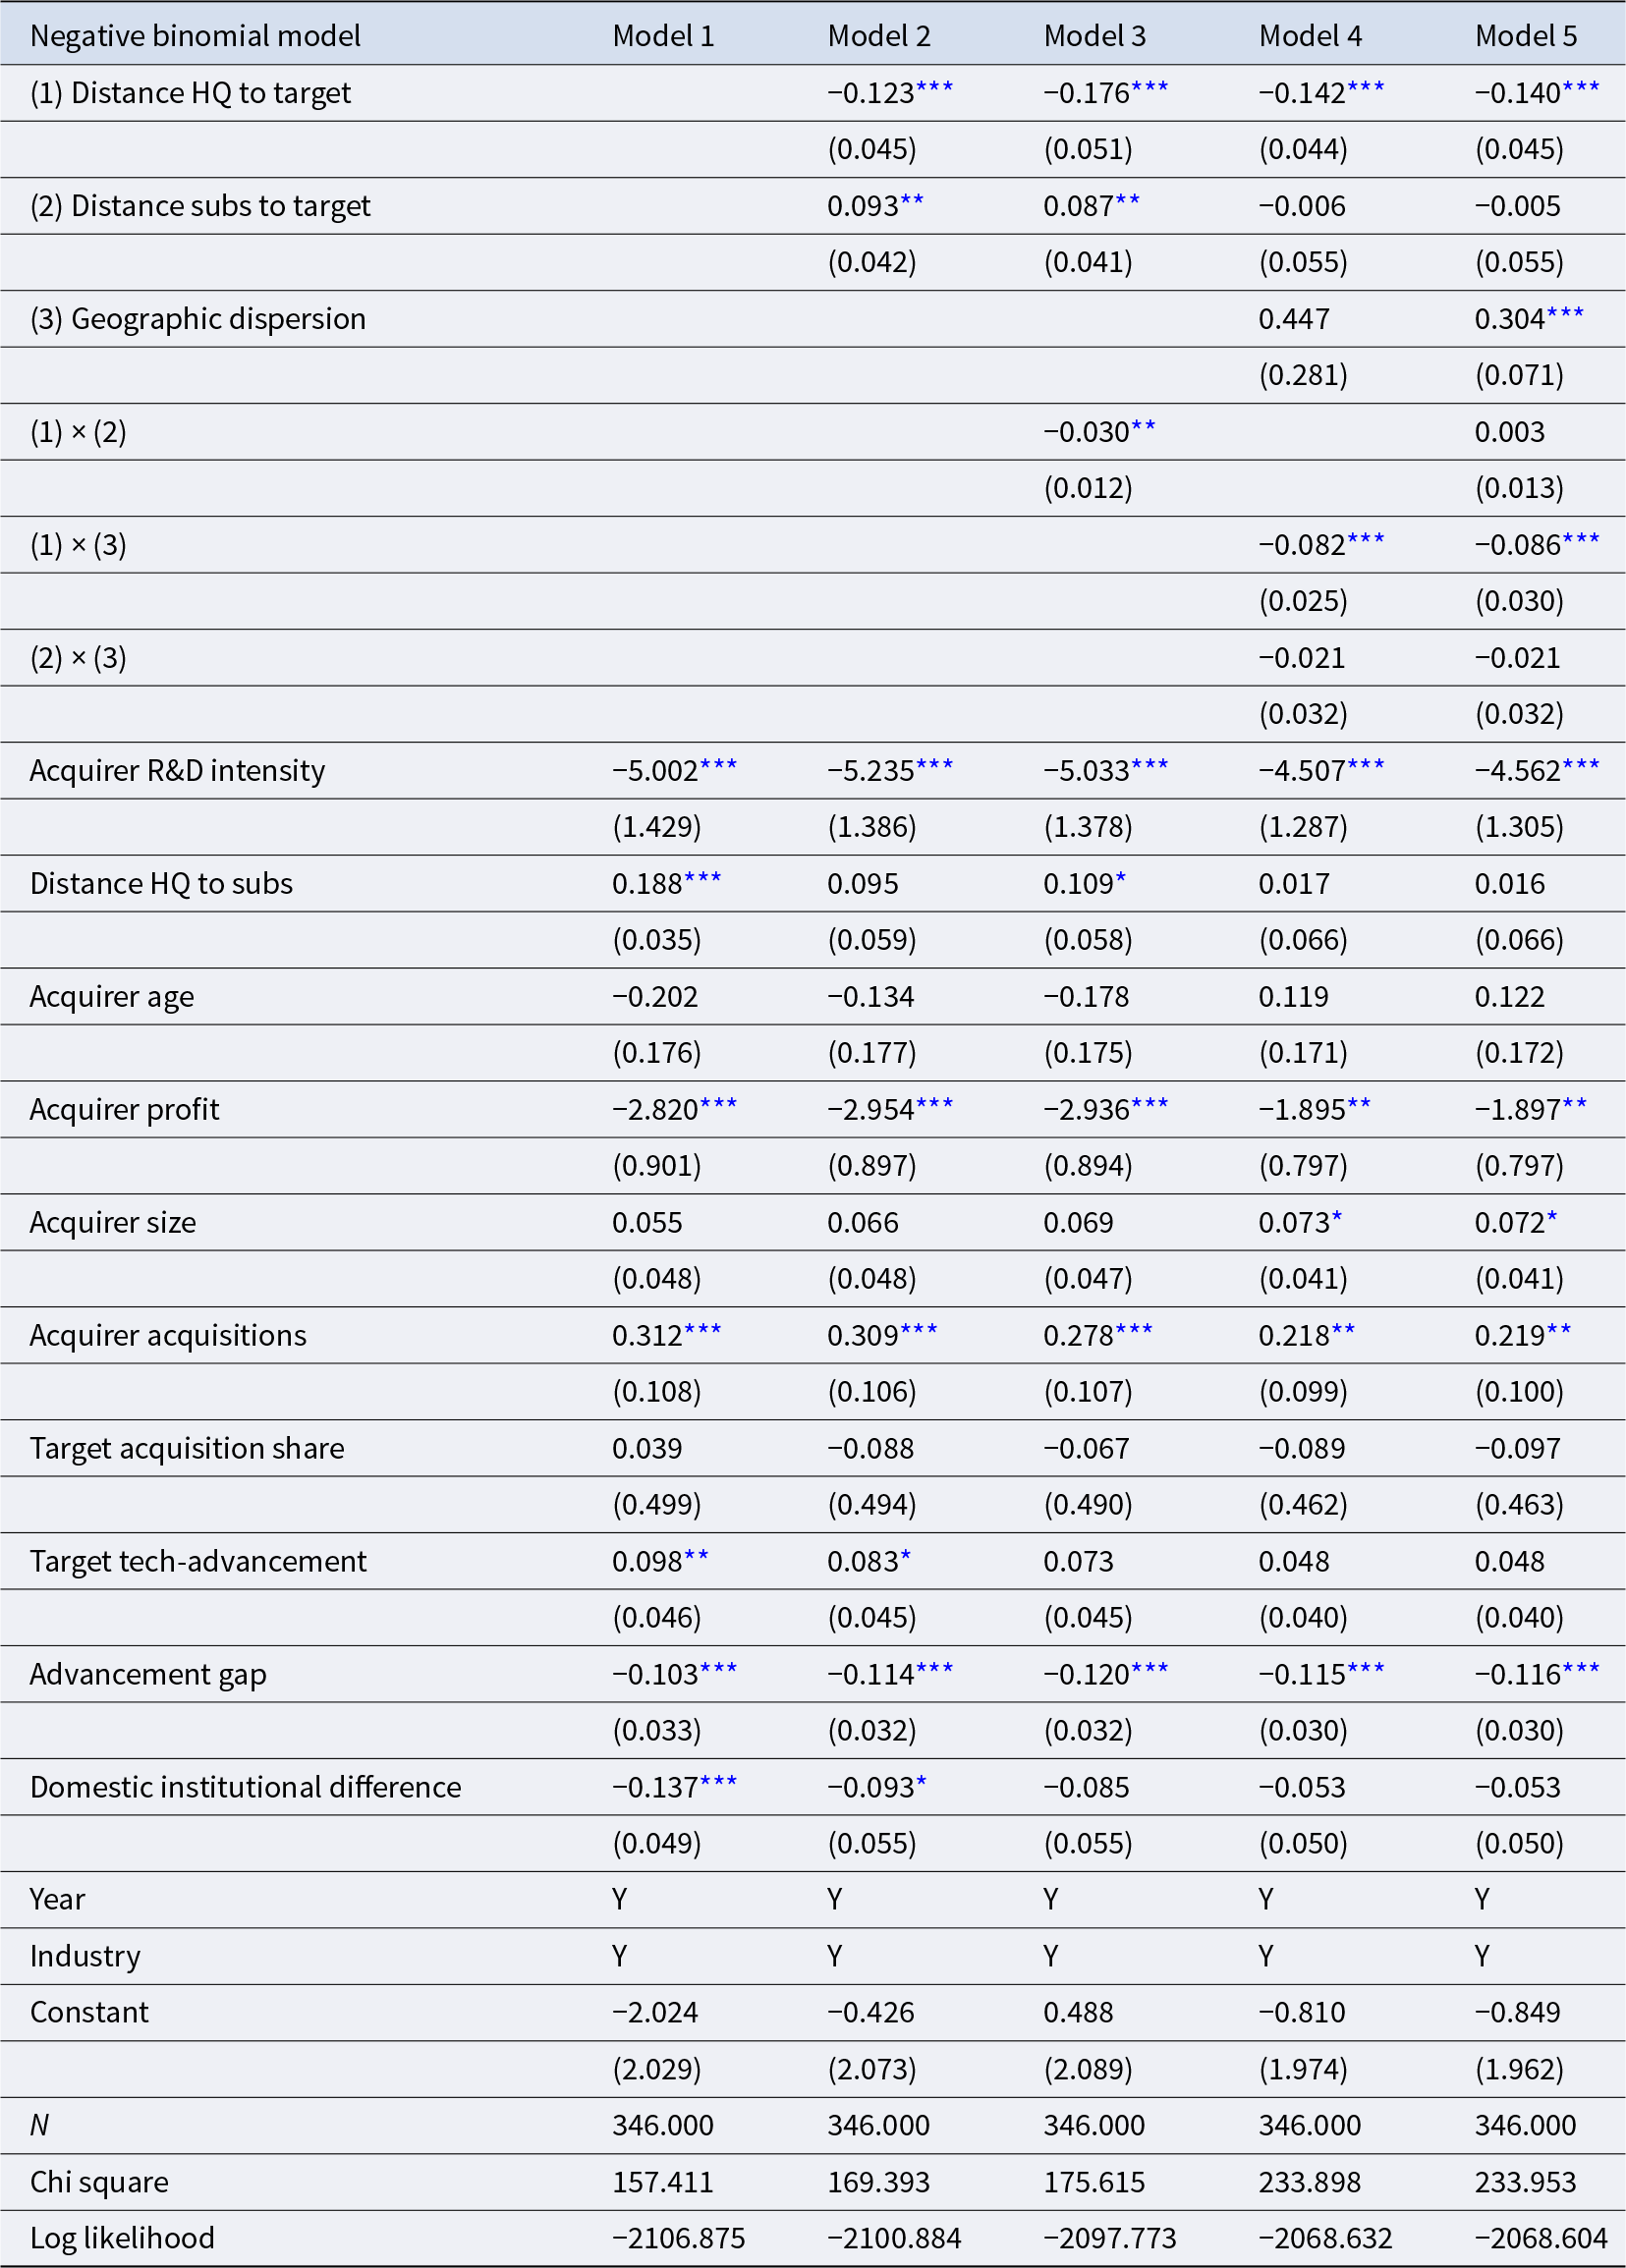
We assessed multicollinearity by computing VIFs for all regressors and interaction terms. In the baseline models, all main-effect variables have VIFs below 5, and the highest VIFs for the interaction between Distance subs to target and Geographic dispersion (8.20) and for Distance subs to target (6.78) remain below the conventional threshold of 10. As a robustness check, we re-estimated the models using residual-centered interaction terms (Lance, Reference Lance1988), which reduces all VIFs below 2.5 and yields substantively identical results, suggesting that our findings are not driven by multicollinearity.
Supplementary Analyses and Robustness Tests
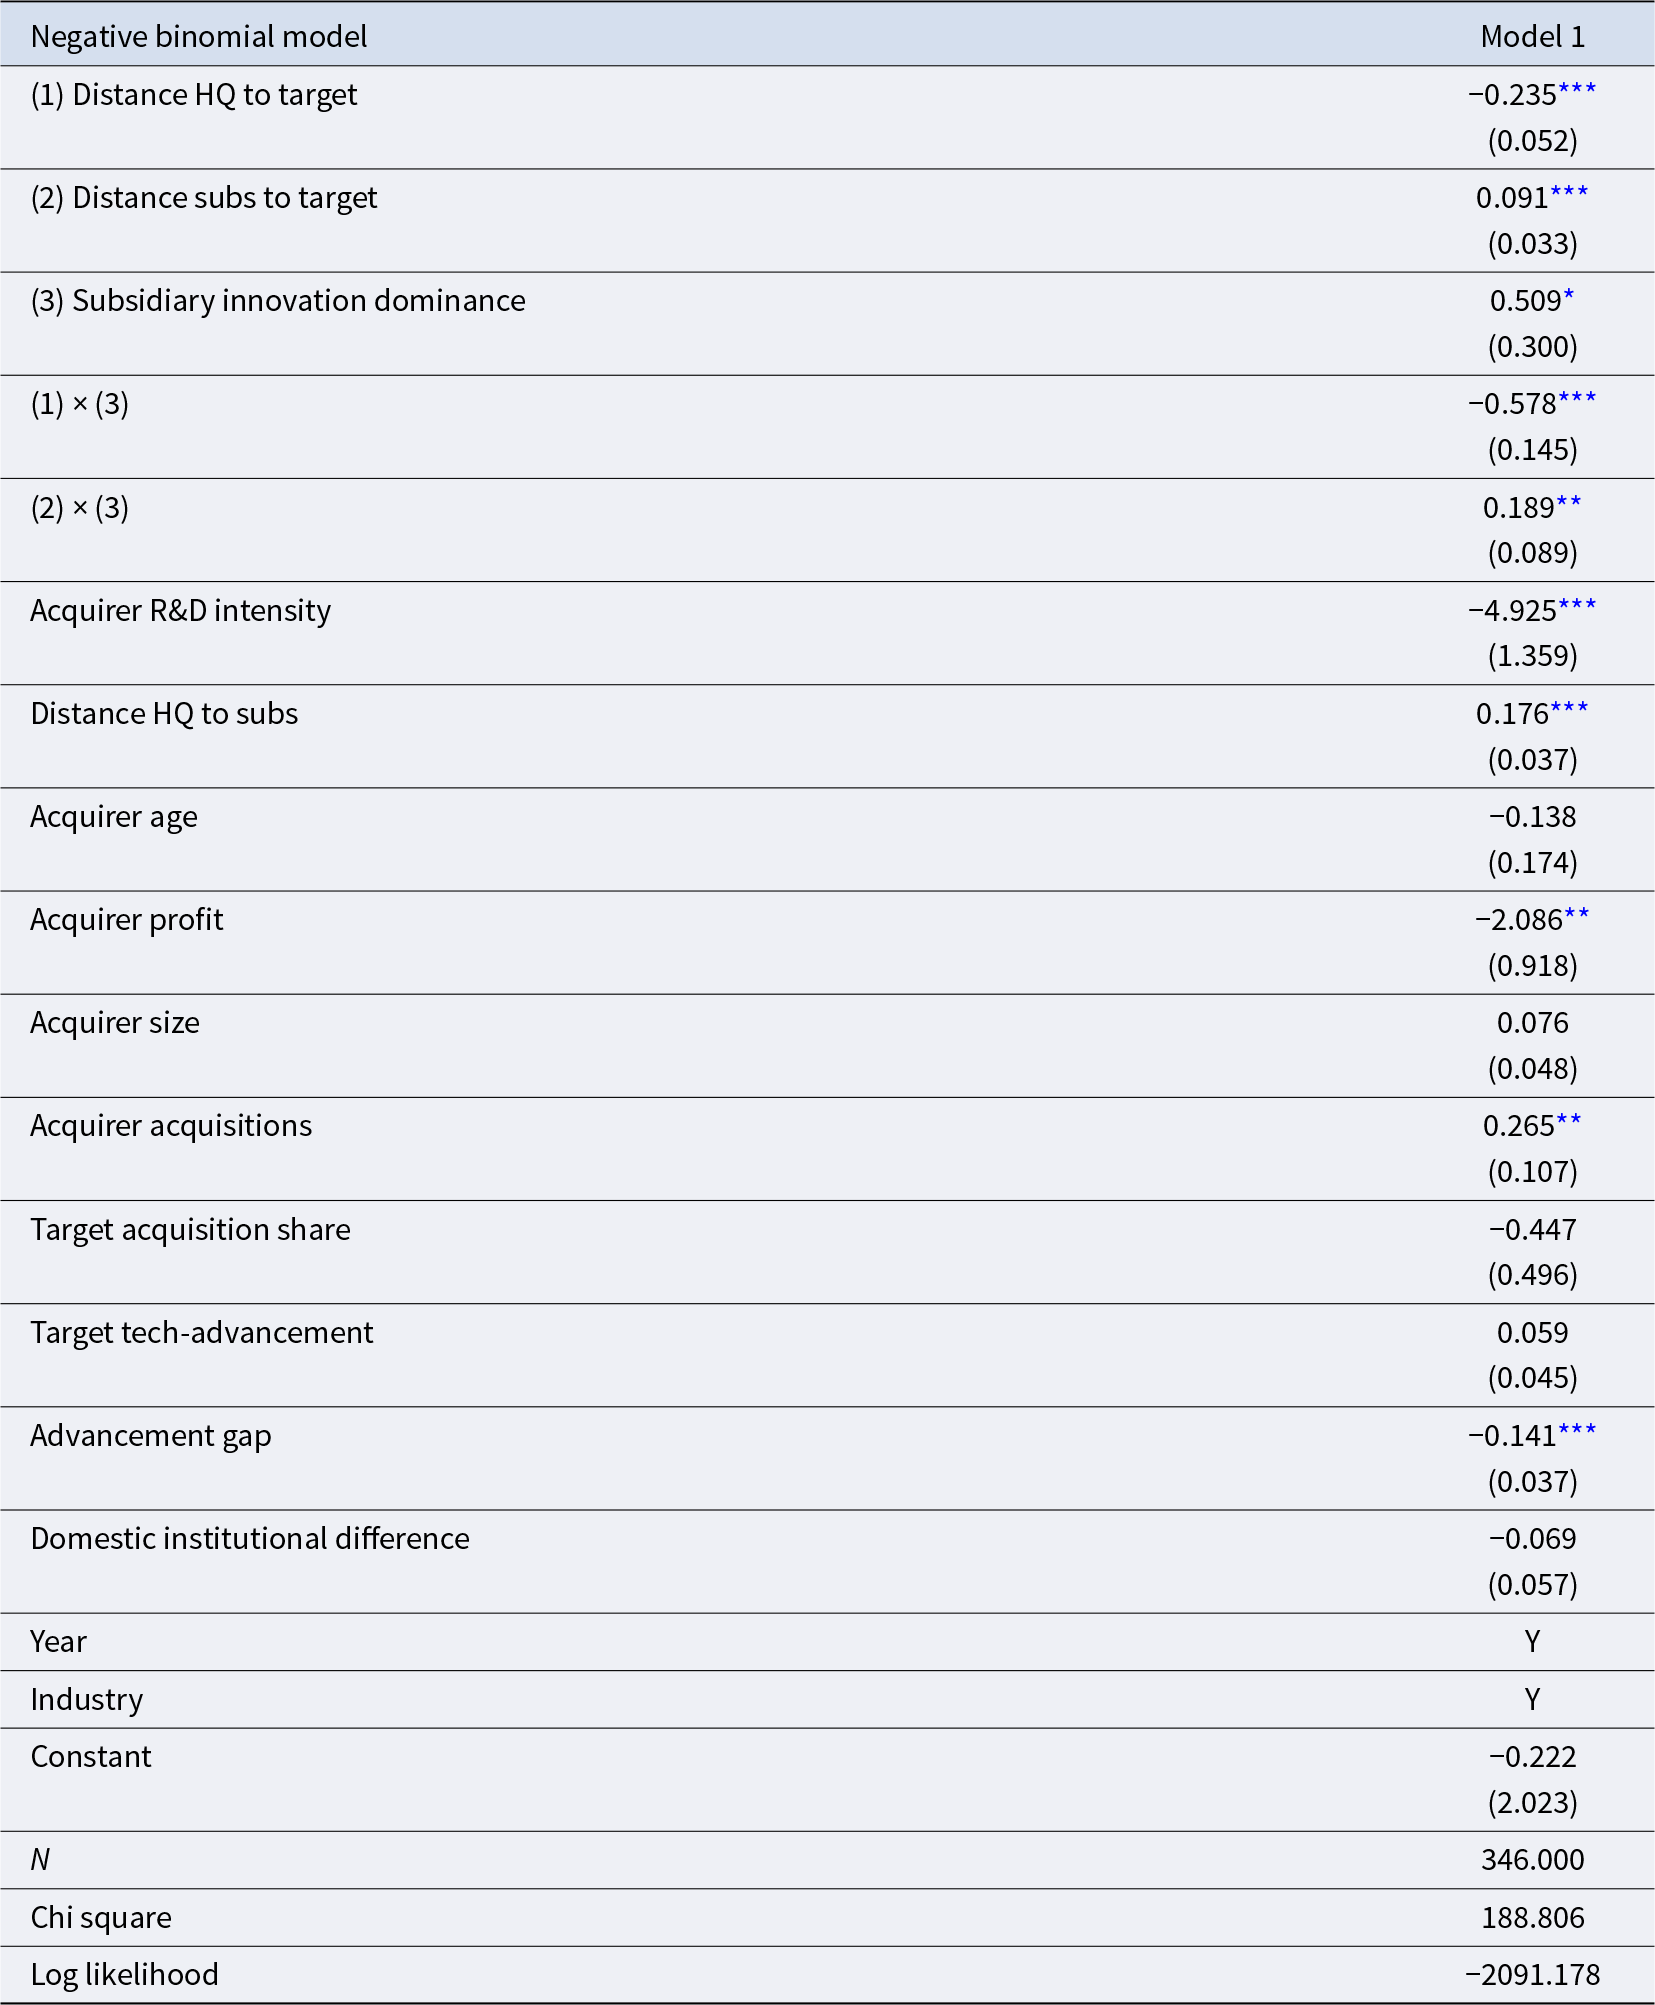
Our hypotheses analyze the impact of geographic distance on post-acquisition innovation performance, considering the distinct roles played by the headquarters and R&D subsidiaries in technological acquisitions. Although prior literature supports the distinct roles with subsidiaries primarily involved in knowledge creation and transfer (e.g., Zaheer & Hernandez, Reference Zaheer and Hernandez2011), there is still heterogeneity across corporations. Therefore, we characterize the division of roles between headquarters and subsidiaries using the proportion of R&D activities undertaken by subsidiaries within the entire corporation. If our theoretical logic holds, the contrasting effects of the two types of geographic distance should become more salient when subsidiaries assume greater responsibility for R&D activities and the headquarters adopts a more hands-off role. In other words, when the subsidiaries take on more R&D operations compared to headquarters, the negative/positive impact of distance between the target and headquarters/subsidiaries on innovation will be stronger. Specifically, we create a variable, Subsidiary innovation dominance, measured by the proportion of patents applied for by subsidiaries within a corporation in the 5 years preceding the acquisition. We test the moderating effects of this variable on the main effects and present the estimated results in Table 4. As anticipated, the results support our theoretical rationale.
The moderating effects of subsidiary innovation dominance

Table 4 Long description
Model 1 reports a negative binomial model with coefficients and standard errors in parentheses for distance measures, subsidiary innovation dominance, interaction terms, and control variables. Subsidiary innovation dominance is 0.509 with one star, with a standard error of 0.300. The interaction of distance from headquarters to target with subsidiary innovation dominance is minus 0.578 with three stars, standard error 0.145, and the interaction of distance from subsidiary to target with subsidiary innovation dominance is 0.189 with two stars, standard error 0.089. Acquirer R and D intensity is minus 4.925 with three stars, standard error 1.359, and distance from headquarters to subsidiary is 0.176 with three stars, standard error 0.037. Additional controls are acquirer age minus 0.138 with standard error 0.174, acquirer profit minus 2.086 with two stars and standard error 0.918, acquirer size 0.076 with standard error 0.048, and acquirer acquisitions 0.265 with two stars and standard error 0.107. Target acquisition share is minus 0.447 with standard error 0.496, target tech advancement is 0.059 with standard error 0.045, advancement gap is minus 0.141 with three stars and standard error 0.037, and domestic institutional difference is minus 0.069 with standard error 0.057. Year is marked Y and industry is marked Y, and the constant is minus 0.222 with standard error 2.023. Model statistics list N as 346.000, chi square as 188.806, and log likelihood as minus 2091.178.
Notes: Standard errors are reported in parentheses.
*** P < 0.01, ** P < 0.05, * P < 0.1.
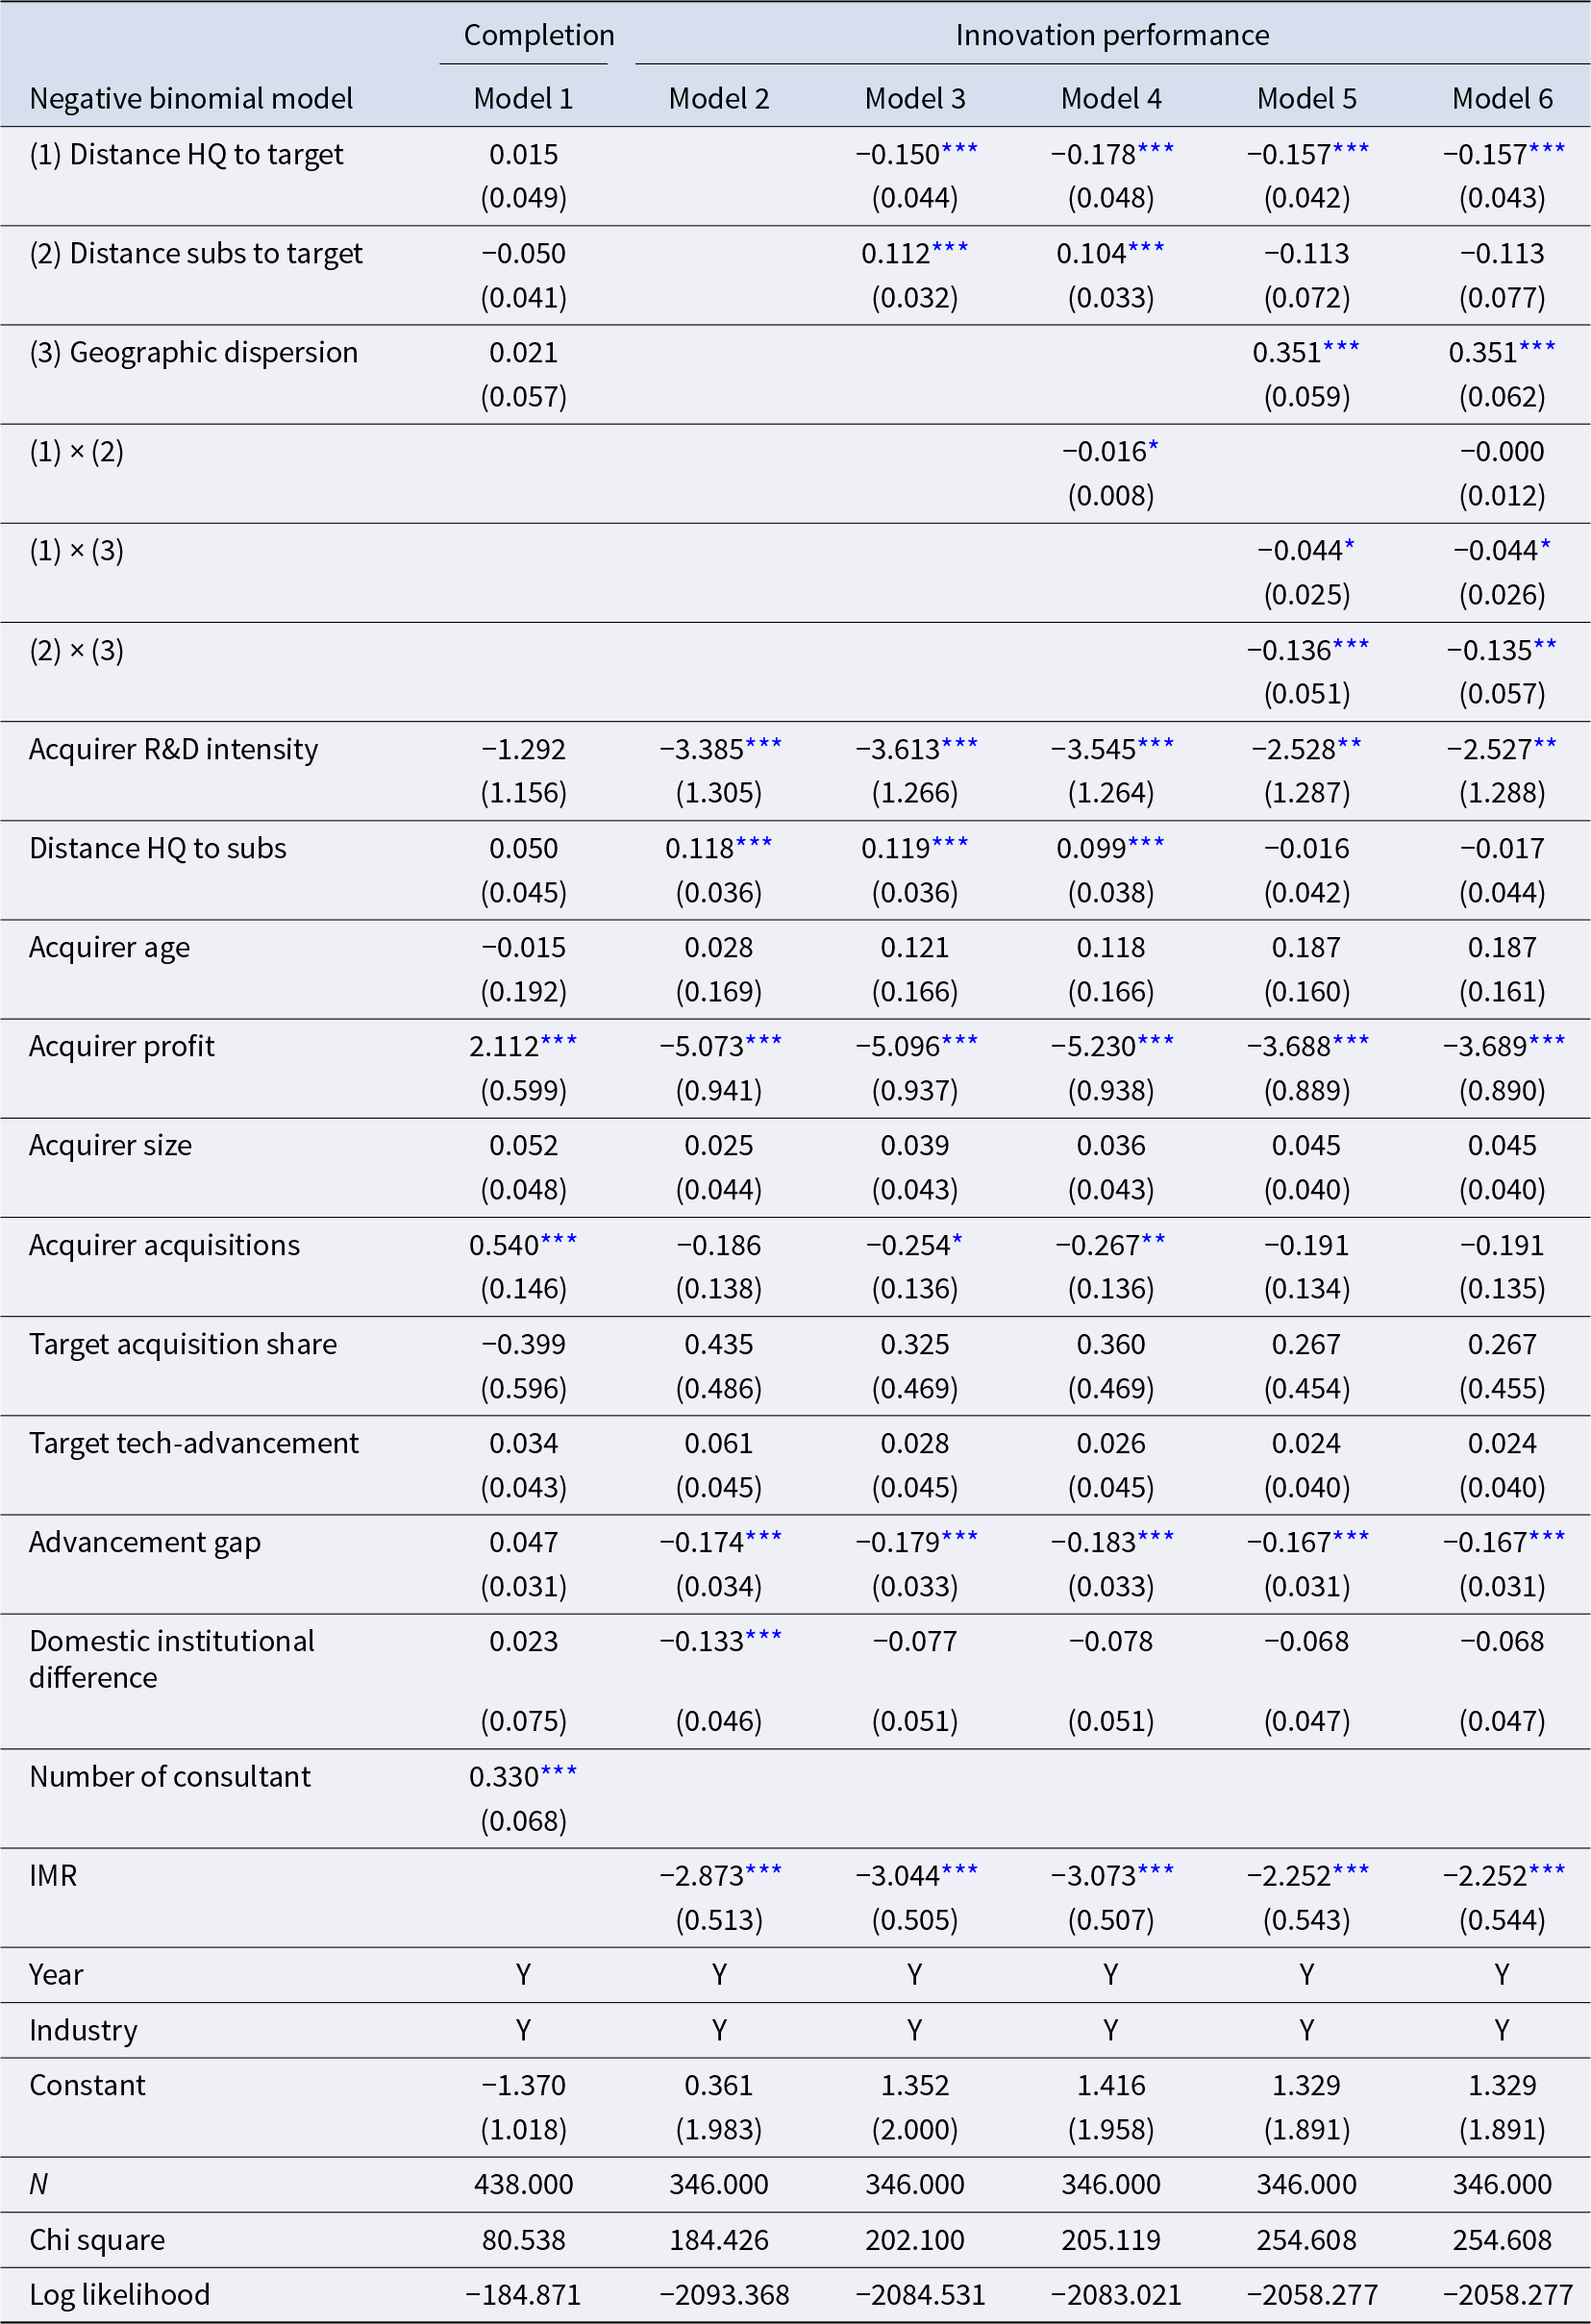
We also carry out a series of robustness checks to ensure that the results are not specific to the above empirical setup. First, to address concerns that firms completing acquisitions may differ systematically from those that do not, we implement a Heckman two-stage procedure (Heckman, Reference Heckman1976, Reference Heckman1979) to correct for potential sample selection bias. Such bias may arise if unobserved firm or deal characteristics jointly influence both the likelihood of acquisition completion and post-acquisition innovation outcomes, leading to endogeneity. To estimate this model, we construct an extended sample of 438 transactions, including both completed and withdrawn acquisitions within the same time window. In the first stage, we estimate a probit model predicting acquisition completion. Following prior research (Jandik, Jandik, & Xu, Reference Jandik, Jandik and Xu2024; Schmitz & Sievers, Reference Schmitz and Sievers2021), we use the number of consultant institutions involved, such as financial advisors, legal counsel, and strategic consultants, as an exclusion restriction. This variable is theorized to influence the success of acquisition completion but is unlikely to directly affect post-acquisition innovation performance (Certo, Busenbark, Woo, & Semadeni, Reference Certo, Busenbark, Woo and Semadeni2016), thereby satisfying the exclusion condition for identification. We then calculate the inverse Mills ratio from the first stage and include it in the second-stage outcome model, which estimates post-acquisition innovation performance (Heckman, Reference Heckman1976, Reference Heckman1979; Lee & Kim, Reference Lee and Kim2016). As shown in Table 5, the main results remain consistent and statistically significant, reinforcing the robustness of our findings after accounting for potential endogeneity from non-random acquisition completion.
Heckman two-step regression

Table 5 Long description
Six negative binomial models report coefficients and standard errors in parentheses for two outcomes, Completion in Model 1 and Innovation performance in Models 2 through 6. For Innovation performance, Distance HQ to target is negative and marked significant in Models 3 to 6, with coefficients minus 0.150, minus 0.178, minus 0.157, and minus 0.157, and standard errors 0.044, 0.048, 0.042, and 0.043. Distance subs to target is positive and marked significant in Models 3 and 4 at 0.112 and 0.104 with standard errors 0.032 and 0.033, then is minus 0.113 in Models 5 and 6 with standard errors 0.072 and 0.077. Geographic dispersion appears in Models 5 and 6 at 0.351 with three stars, with standard errors 0.059 and 0.062. Interaction terms appear only in some models: the interaction of Distance HQ to target with Distance subs to target is minus 0.016 with one star in Model 4 with standard error 0.008 and is minus 0.000 in Model 6 with standard error 0.012; the interaction of Distance HQ to target with Geographic dispersion is minus 0.044 with one star in Models 5 and 6 with standard errors 0.025 and 0.026; the interaction of Distance subs to target with Geographic dispersion is minus 0.136 with three stars in Model 5 and minus 0.135 with two stars in Model 6 with standard errors 0.051 and 0.057. Acquirer R and D intensity is negative and marked significant in Models 2 to 6, ranging from minus 3.385 with three stars to minus 2.527 with two stars, while Acquirer profit is negative and marked significant in Models 2 to 6 from minus 5.073 with three stars to minus 3.689 with three stars. Completion Model 1 includes Number of consultant at 0.330 with three stars and standard error 0.068, while IMR appears only in Models 2 to 6 and is negative with three stars from minus 3.073 to minus 2.252 with standard errors from 0.505 to 0.544. Year and Industry are marked Y in all models; N is 438 for Model 1 and 346 for Models 2 to 6, with chi square from 80.538 to 254.608 and log likelihood from minus 184.871 to minus 2058.277.
Notes: Standard errors are reported in parentheses.
*** P < 0.01, ** P < 0.05, * P < 0.1.
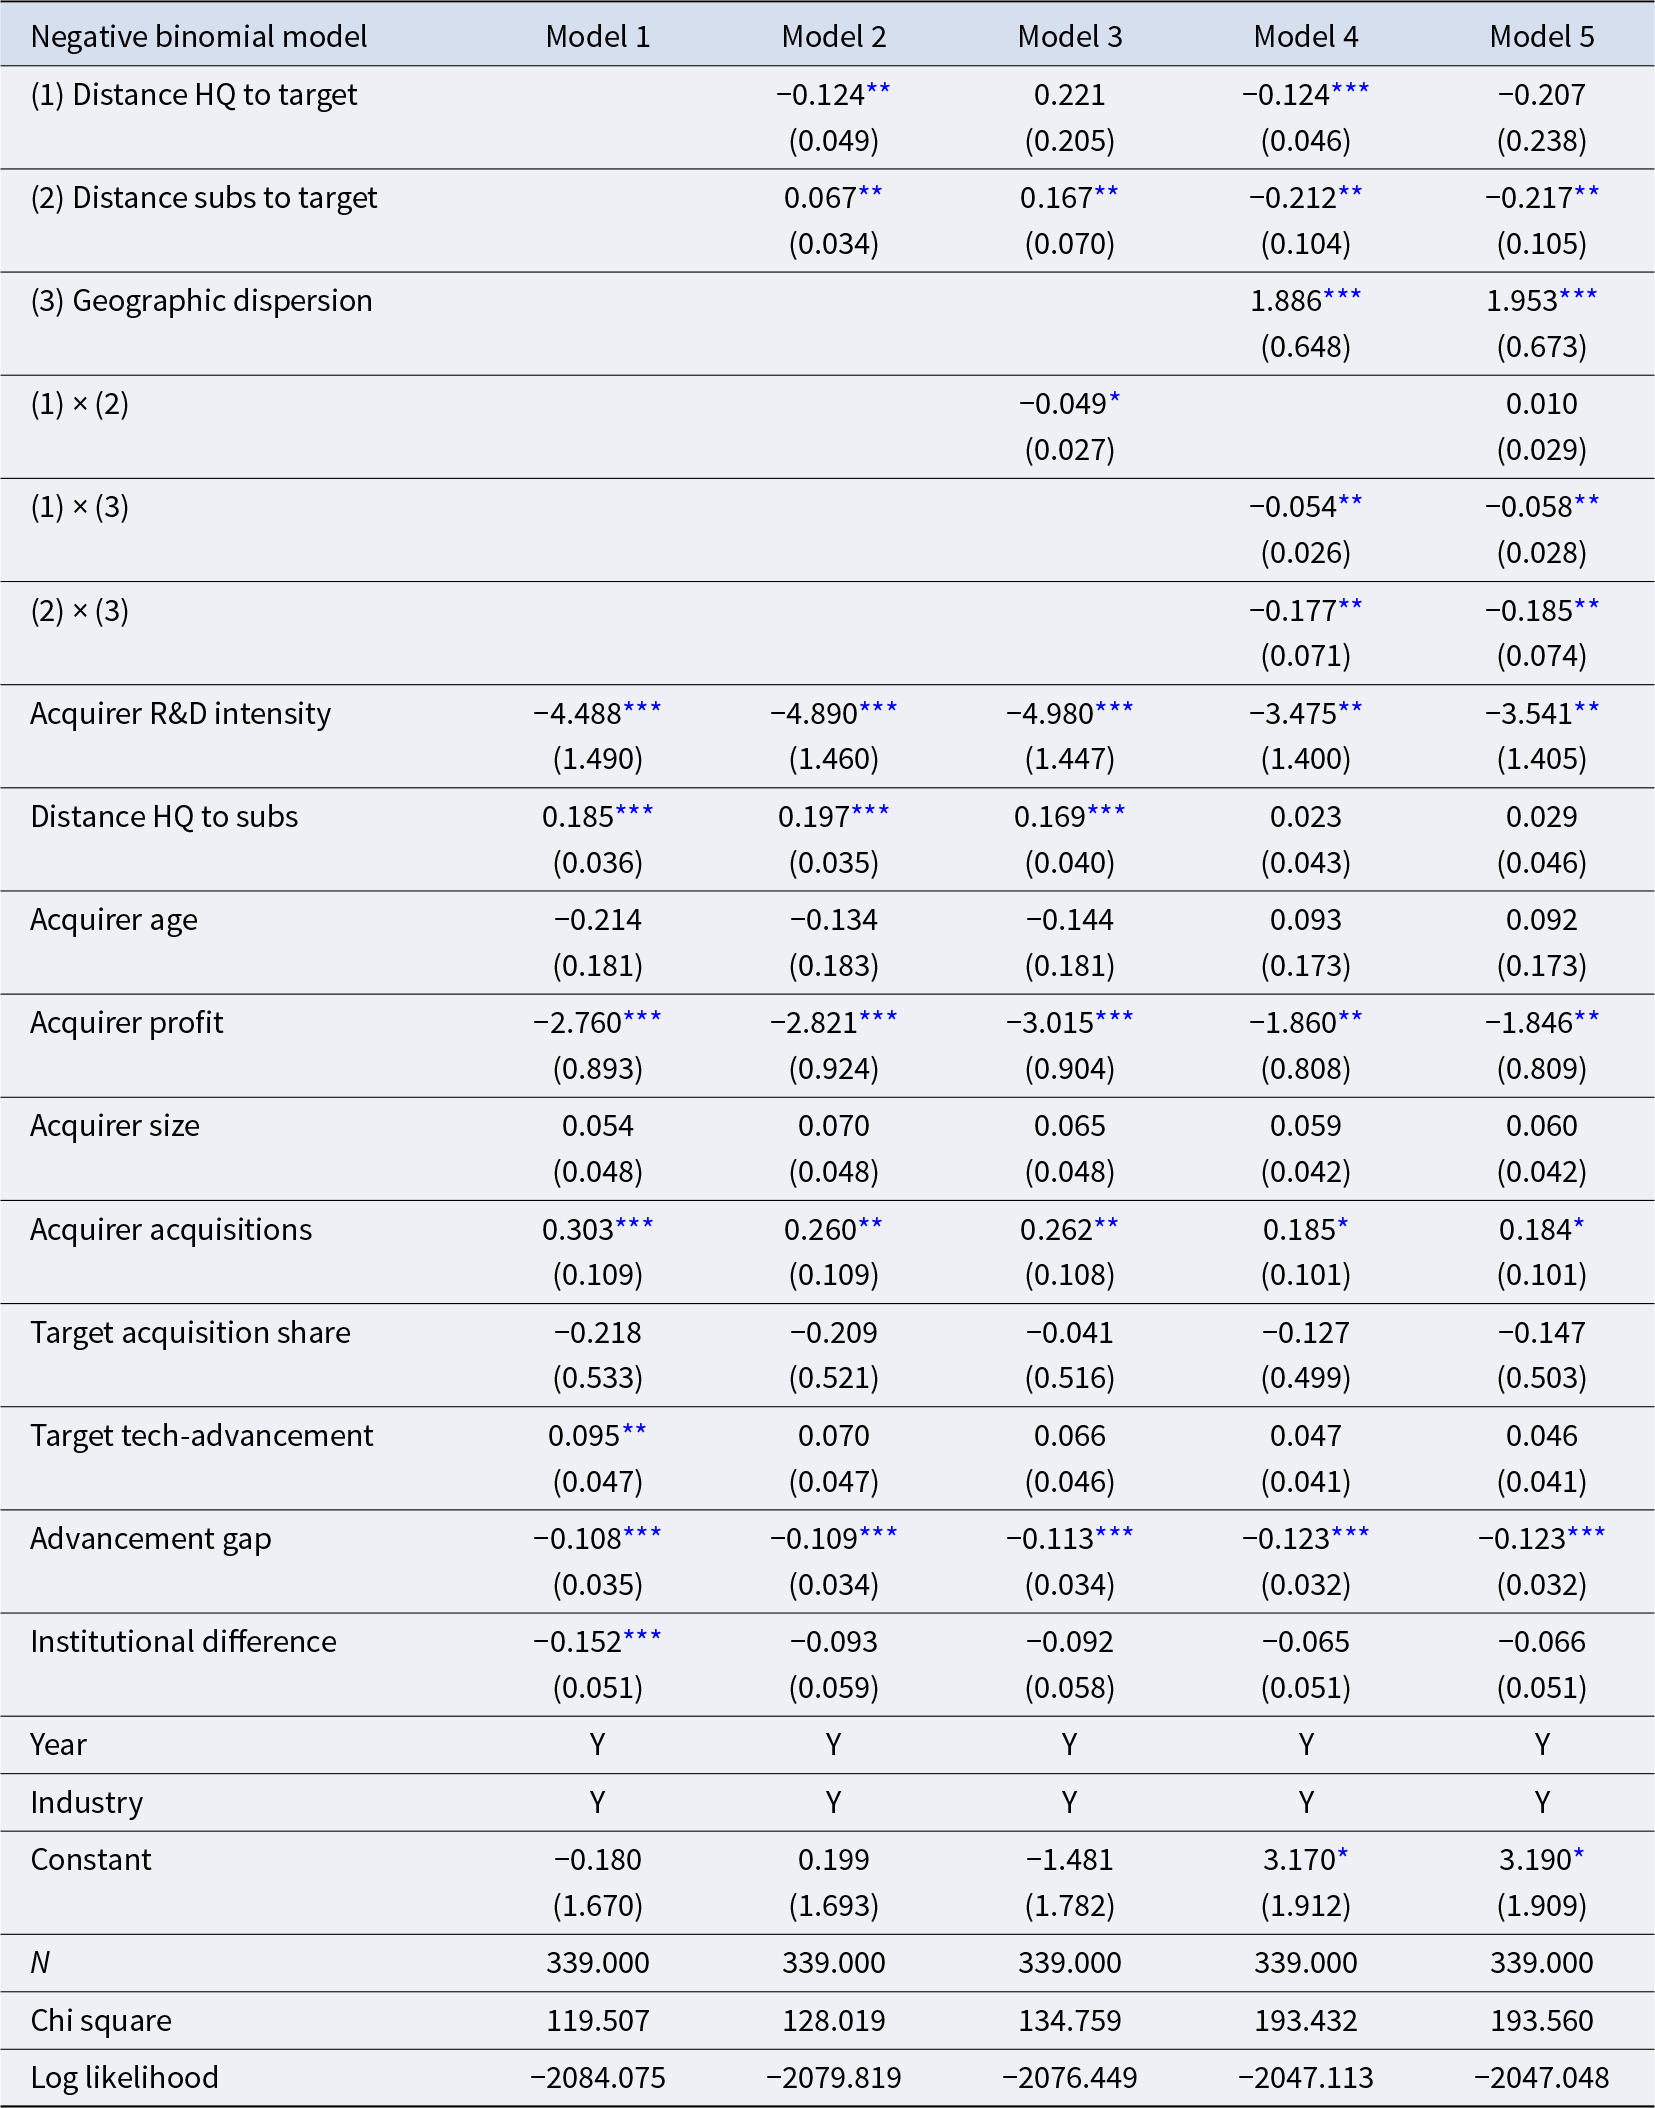
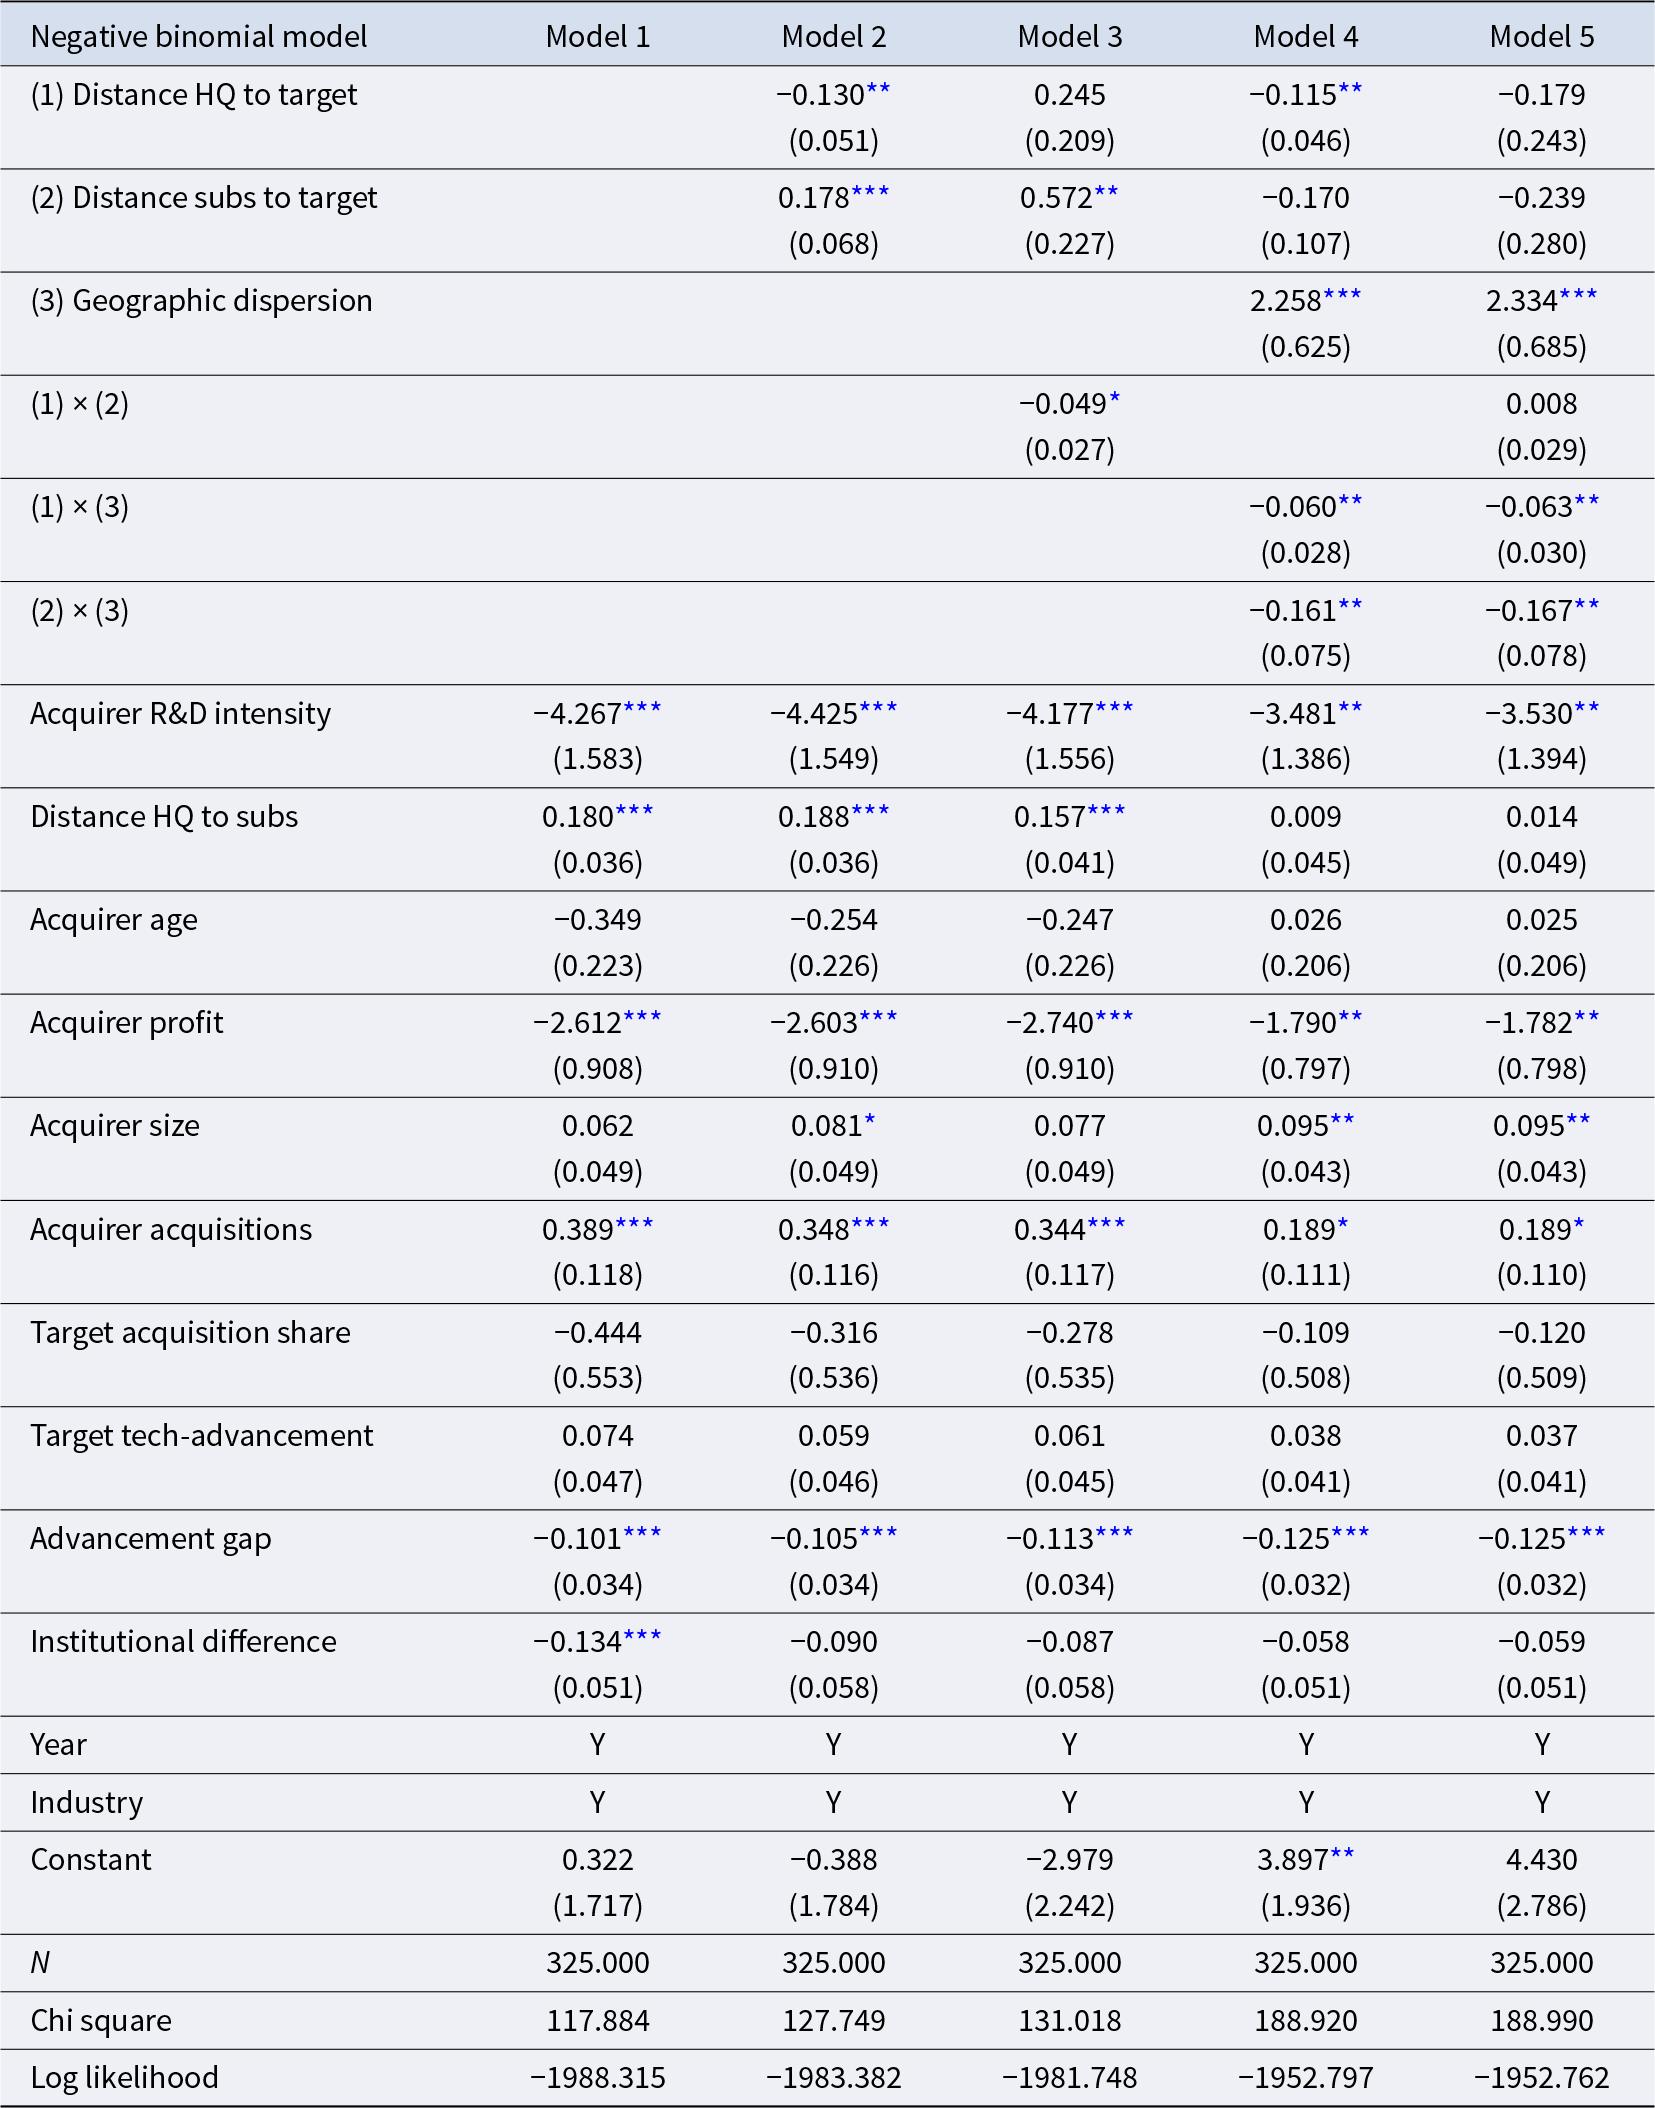
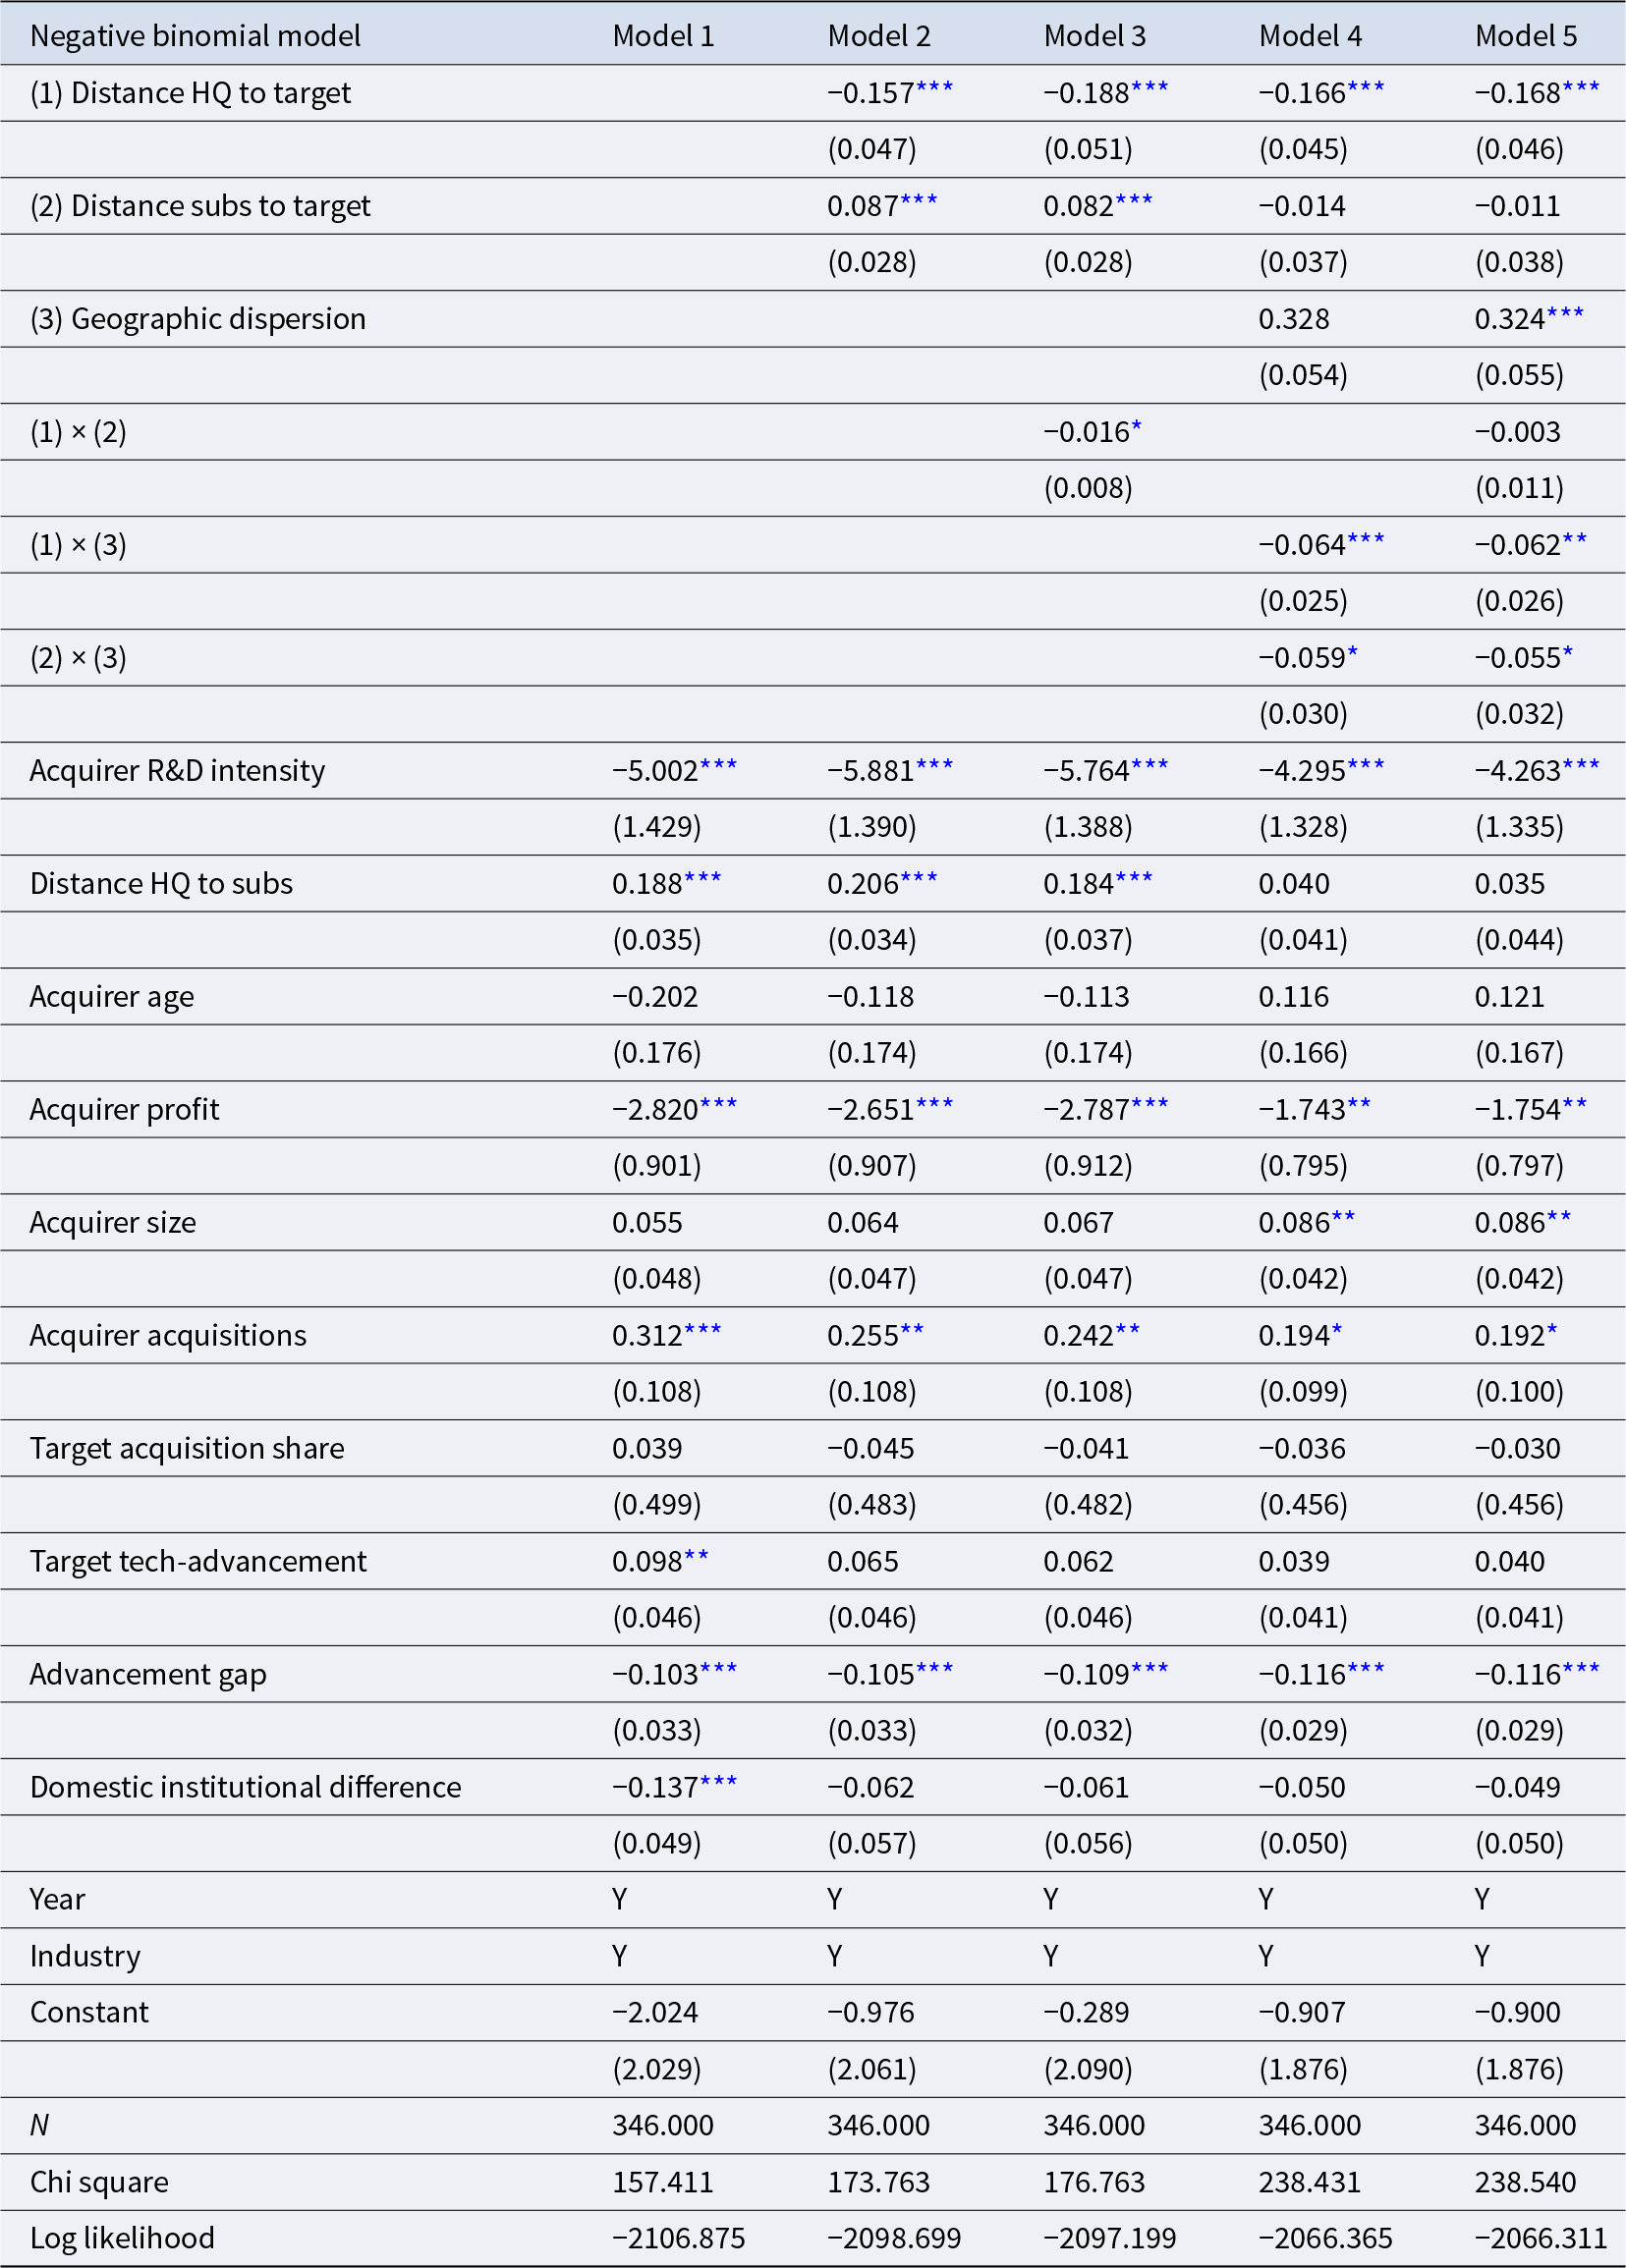
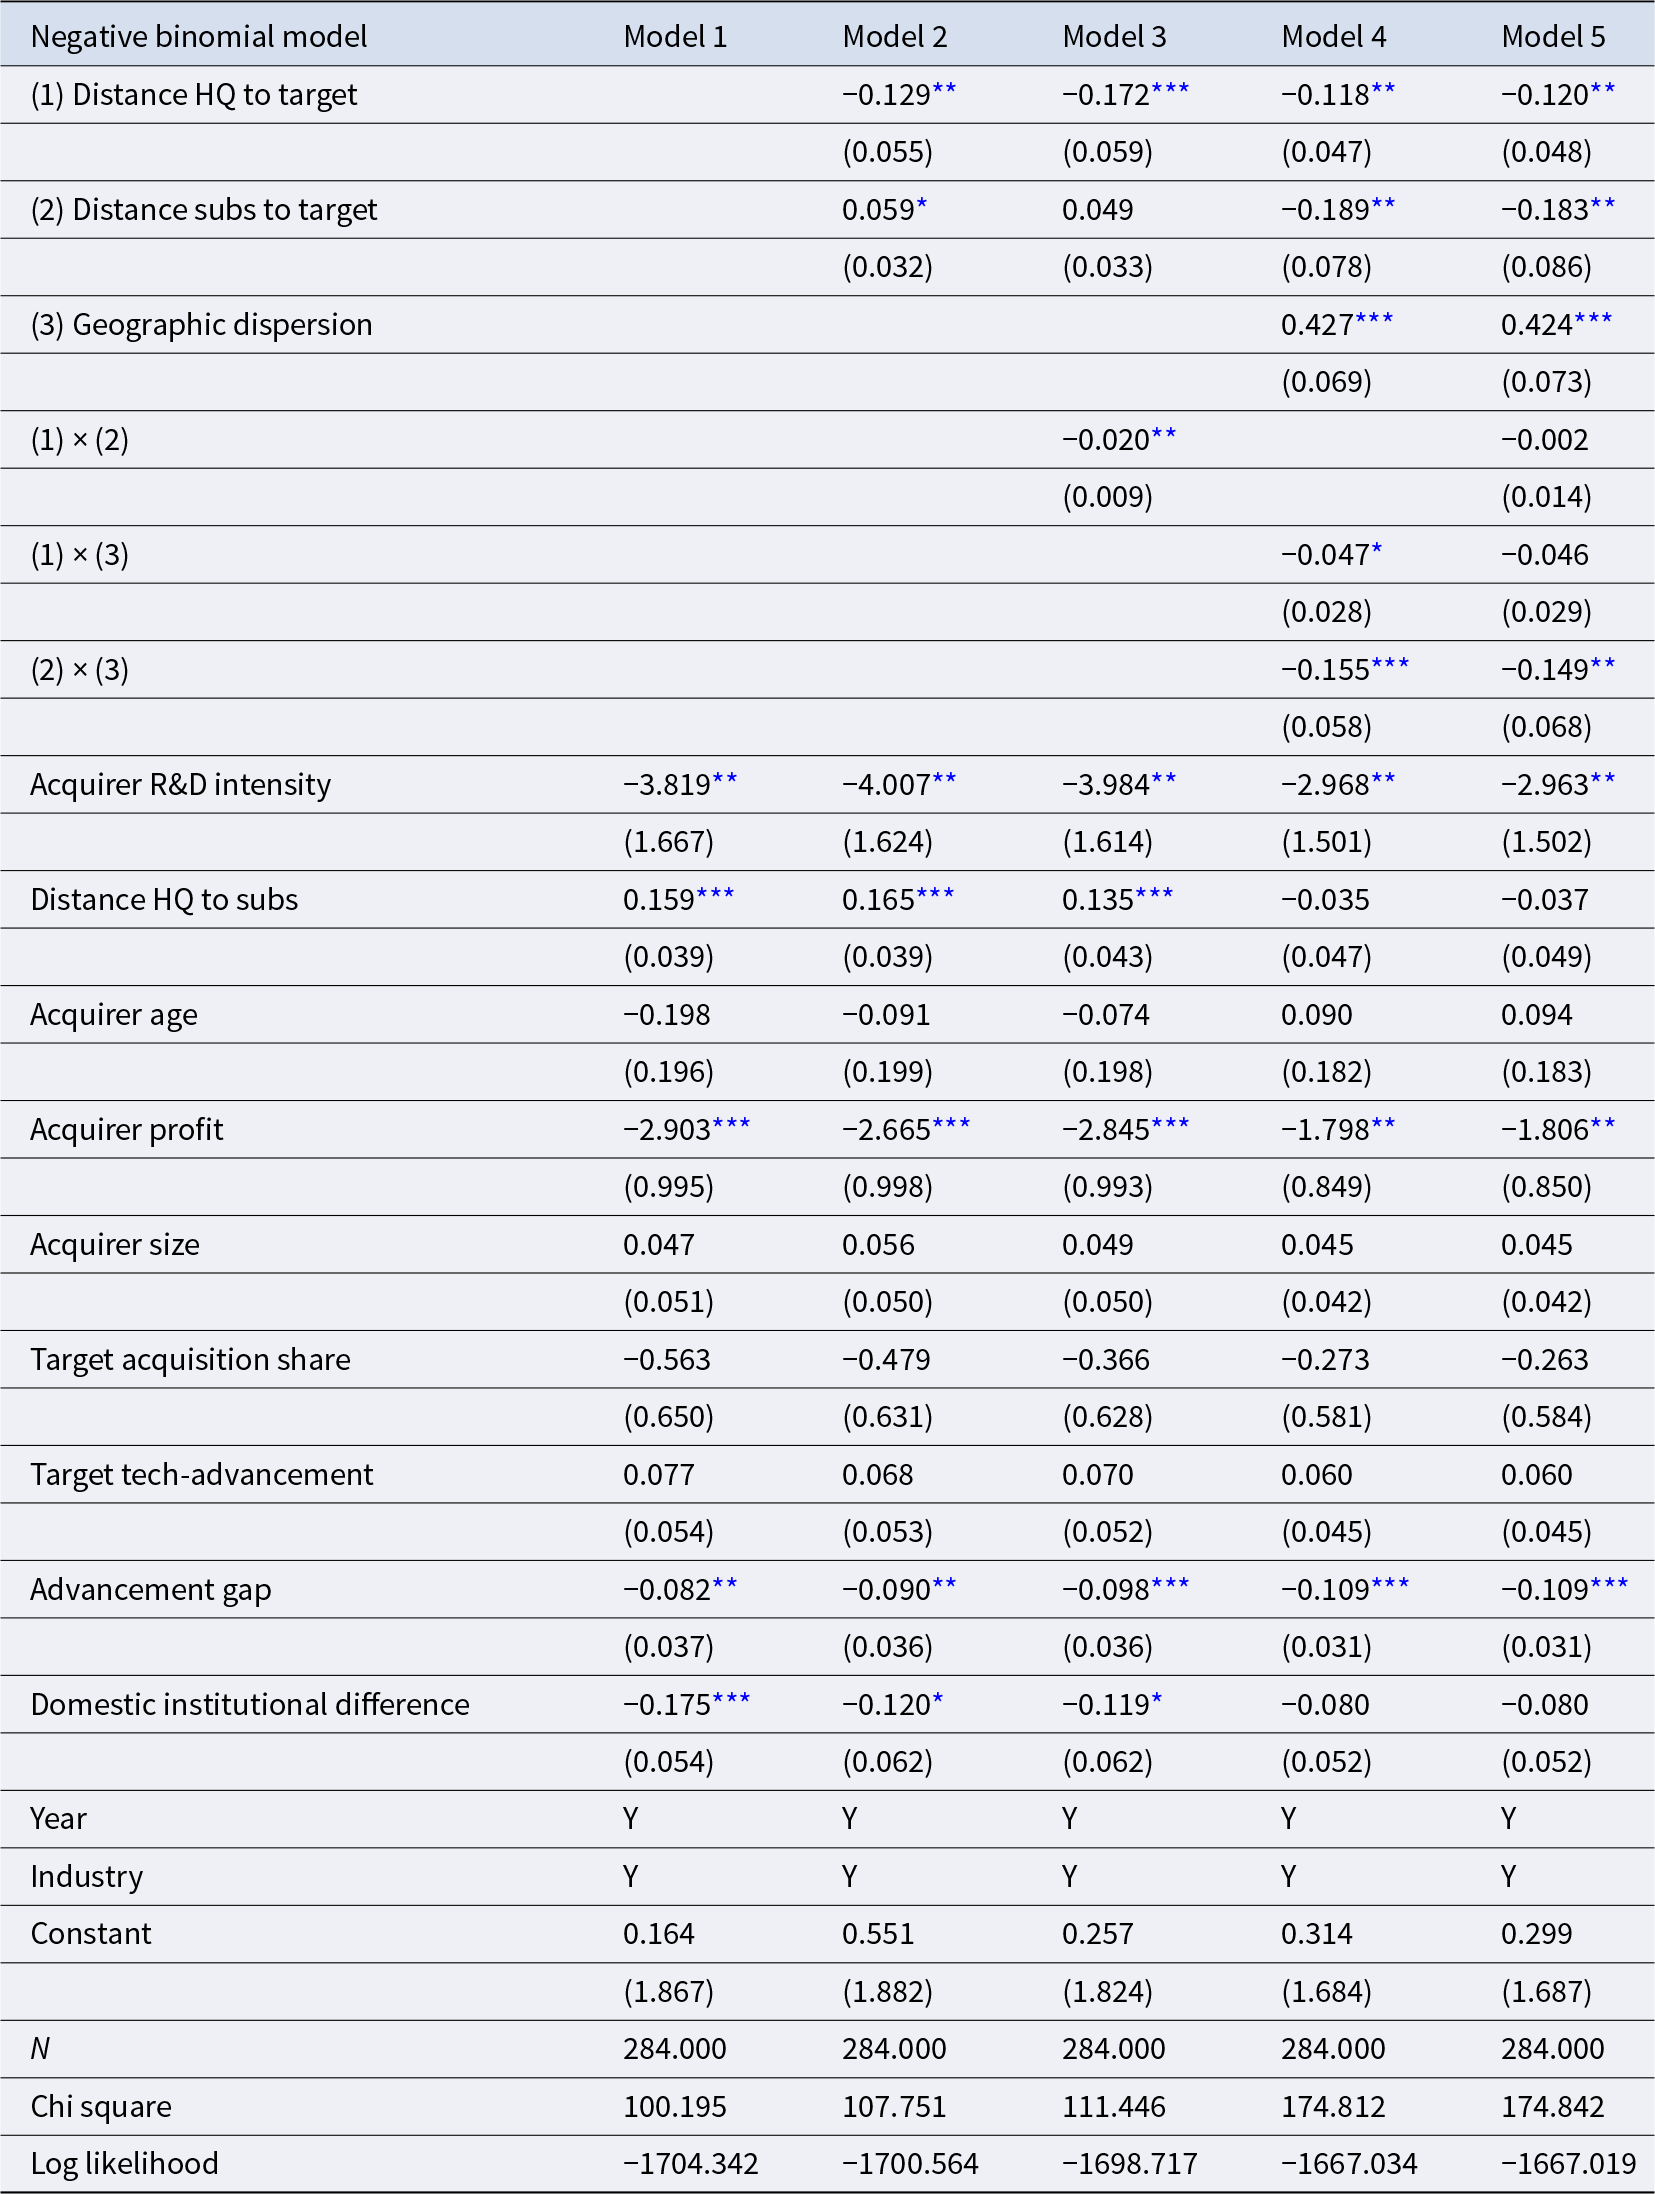
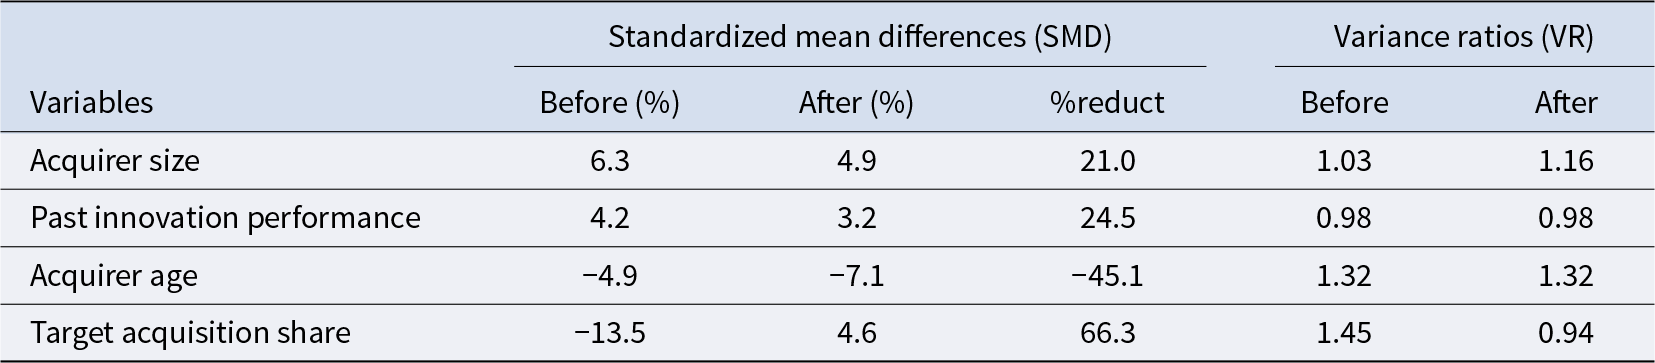
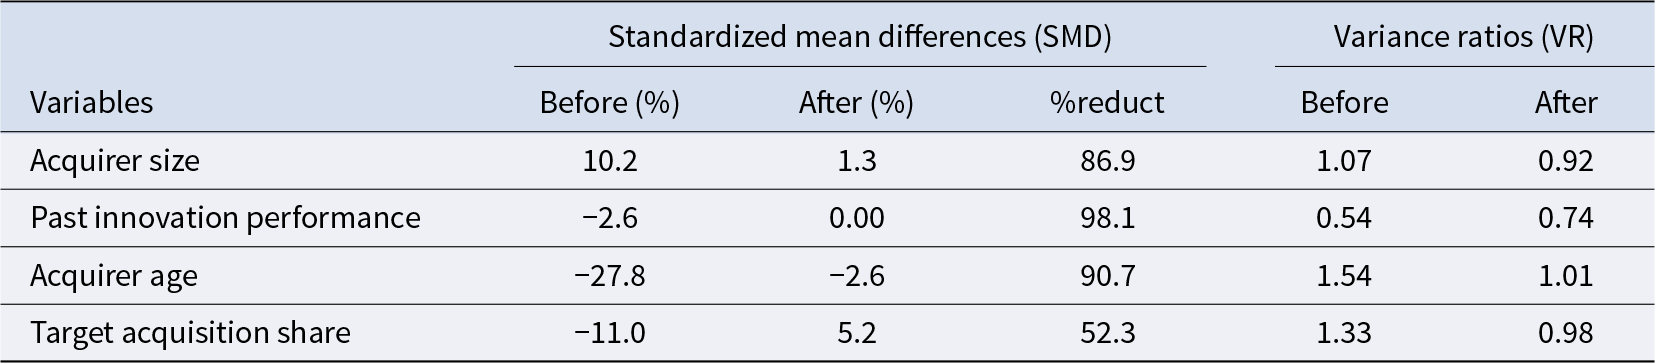
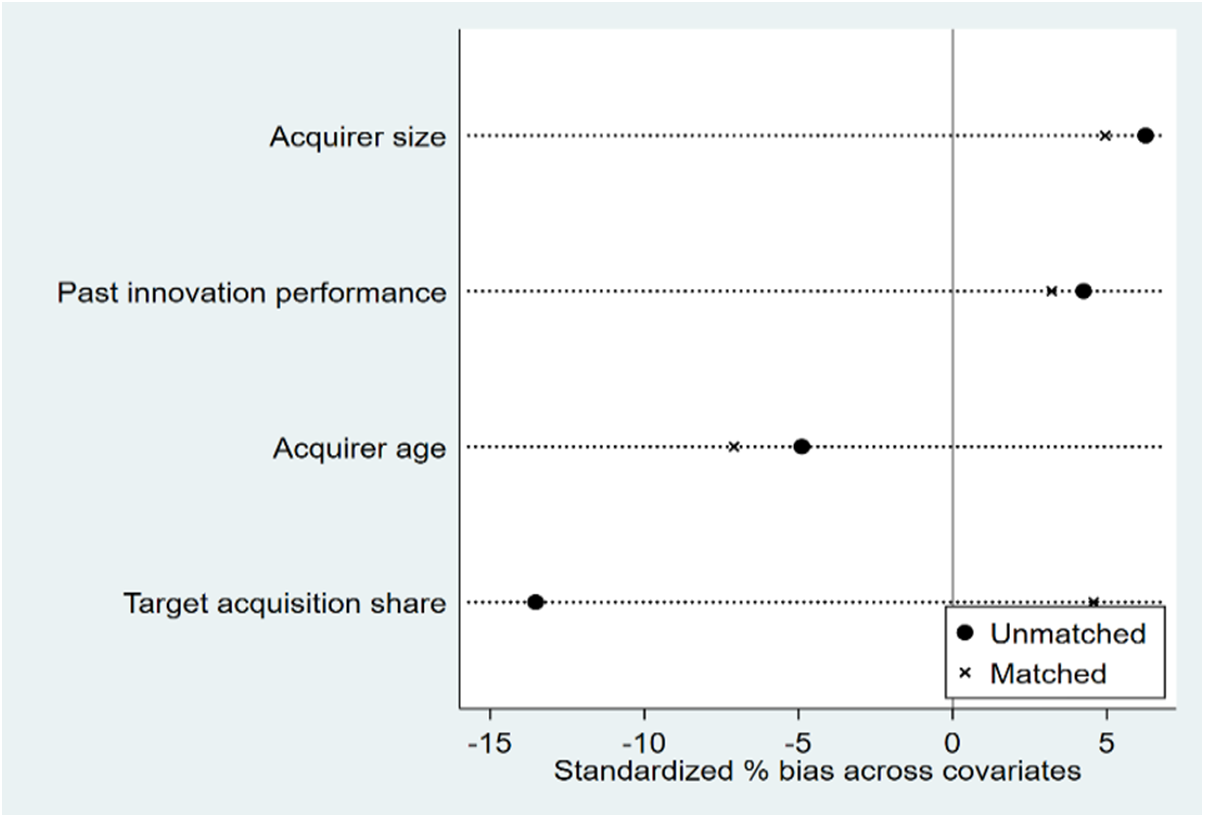
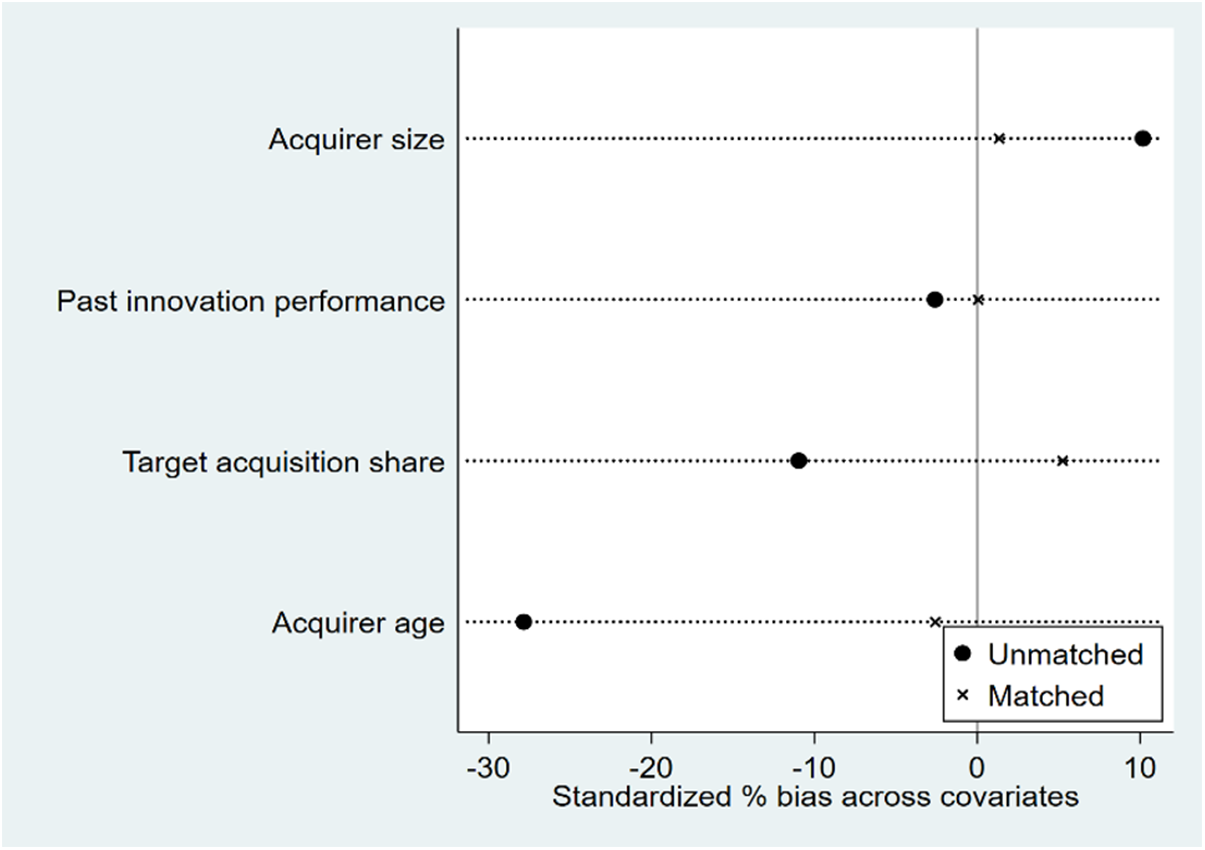
In an additional robustness analysis, we implement propensity score matching (PSM) to mitigate concerns that our results might be driven by observable differences between high- and low-distance acquisitions. For both headquarters-target distance and subsidiaries-target distance, we define a treatment indicator based on a median split of the respective distance measure and estimate propensity scores using pre-acquisition innovation performance, acquirer age, acquirer size, and target acquisition share as covariates. We then re-estimate our baseline models on the resulting matched samples (339 acquisitions for headquarters-target distance and 325 acquisitions for subsidiaries-target distance), as reported in Tables 6 and 7. The PSM-based regression results remain consistent with our main findings, reinforcing the robustness of our conclusions. Detailed information on the propensity score specification, matching procedure, and balance diagnostics is provided in the Appendix.
PSM-based robustness test for Distance HQ to target

Table 6 Long description
Negative binomial model results are reported for five specifications labeled Model 1 through Model 5, with coefficients and standard errors in parentheses. Distance HQ to target appears in Models 2 to 5 with coefficients of minus 0.124, 0.221, minus 0.124, and minus 0.207. Distance subs to target appears in Models 2 to 5 with coefficients of 0.067, 0.167, minus 0.212, and minus 0.217. Geographic dispersion is included in Models 4 and 5 with coefficients of 1.886 and 1.953. The interaction of Distance HQ to target with Distance subs to target is included in Model 3 at minus 0.049 and in Model 5 at 0.010; the interaction of Distance HQ to target with Geographic dispersion is minus 0.054 in Model 4 and minus 0.058 in Model 5; the interaction of Distance subs to target with Geographic dispersion is minus 0.177 in Model 4 and minus 0.185 in Model 5. Control variables include Acquirer R and D intensity, Distance HQ to subs, Acquirer age, Acquirer profit, Acquirer size, Acquirer acquisitions, Target acquisition share, Target tech advancement, Advancement gap, and Institutional difference, with Year and Industry marked Y in all models. Sample size is 339 in every model, with chi square values from 119.507 to 193.560 and log likelihood values from minus 2084.075 to minus 2047.048.
Notes: Standard errors are reported in parentheses.
*** P < 0.01, ** P < 0.05, * P < 0.1.
PSM-based robustness test for Distance subs to target

Table 7 Long description
Negative binomial model results are reported for five specifications labeled Model 1 through Model 5, with coefficients and standard errors in parentheses. Distance HQ to target appears in Models 2 to 5 with coefficients minus 0.130, 0.245, minus 0.115, and minus 0.179, and standard errors 0.051, 0.209, 0.046, and 0.243. Distance subs to target appears in Models 2 to 5 with coefficients 0.178, 0.572, minus 0.170, and minus 0.239, and standard errors 0.068, 0.227, 0.107, and 0.280. Geographic dispersion appears in Models 4 and 5 with coefficients 2.258 and 2.334, and standard errors 0.625 and 0.685. Interaction terms are included as follows: Distance HQ to target by Distance subs to target in Model 3 is minus 0.049 with standard error 0.027 and in Model 5 is 0.008 with standard error 0.029; Distance HQ to target by Geographic dispersion in Models 4 and 5 is minus 0.060 and minus 0.063 with standard errors 0.028 and 0.030; Distance subs to target by Geographic dispersion in Models 4 and 5 is minus 0.161 and minus 0.167 with standard errors 0.075 and 0.078. Control variables reported in all models include Acquirer R and D intensity, Distance HQ to subs, Acquirer age, Acquirer profit, Acquirer size, Acquirer acquisitions, Target acquisition share, Target tech advancement, Advancement gap, and Institutional difference, plus Year and Industry marked Y in every model. Constant is 0.322, minus 0.388, minus 2.979, 3.897, and 4.430 across Models 1 to 5 with standard errors 1.717, 1.784, 2.242, 1.936, and 2.786. Sample size N is 325.000 for all models, with Chi square 117.884, 127.749, 131.018, 188.920, and 188.990, and Log likelihood minus 1988.315, minus 1983.382, minus 1981.748, minus 1952.797, and minus 1952.762.
Notes: Standard errors are reported in parentheses.
*** P < 0.01, ** P < 0.05, * P < 0.1.
Second, we incorporate a control for the pre-acquisition innovation performance of the corporate group. Specifically, we include the number of patents filed by the acquiring firm in the five years preceding the acquisition as an additional explanatory variable. This adjustment helps account for baseline differences in firms’ innovation capacity, thereby mitigating concerns that the observed effects of geographic distance may simply reflect pre-existing levels of innovation productivity rather than post-acquisition dynamics. As reported in Table 8, the estimated results remain consistent with our main findings.
Robustness check controlling for pre-acquisition innovation performance

Table 8 Long description
Negative binomial model results are reported for five specifications labeled Model 1 through Model 5, with coefficients and standard errors in parentheses. Model 1 includes Past innovation performance at 0.004 with three stars, Acquirer R and D intensity at minus 4.874 with three stars, and Distance HQ to subs at 0.167 with three stars, plus controls, year and industry marked Y. Model 2 adds Distance HQ to target at minus 0.112 with one star and Distance subs to target at 0.058 with one star, and Past innovation performance is 0.003 with three stars. Model 3 includes Distance HQ to target at minus 0.141 with three stars, Distance subs to target at 0.049 with no stars, and the interaction of Distance HQ to target with Distance subs to target at minus 0.015 with one star. Model 4 includes Distance HQ to target at minus 0.118 with three stars, Distance subs to target at minus 0.106 with no stars, Geographic dispersion at 0.314 with three stars, and interactions with Geographic dispersion of minus 0.039 with one star for Distance HQ to target, and minus 0.098 with one star for Distance subs to target. Model 5 includes Distance HQ to target at minus 0.123 with three stars, Distance subs to target at minus 0.087 with no stars, Geographic dispersion at 0.299 with three stars, and interactions of minus 0.007, minus 0.036, and minus 0.078, each with no stars. Across Models 1 to 5, N is 346.000, chi square ranges from 205.042 to 269.190, and log likelihood ranges from minus 2083.060 to minus 2050.986.
Notes: Standard errors are reported in parentheses.
*** P < 0.01, ** P < 0.05, * P < 0.1.
Third, to address the potential confounding effects of treating all R&D subsidiaries collectively, we refined the construction of the variable Distance subs to target. Specifically, we use the proportion of invention patents applied for by each subsidiary (within the past 5 years) as a weighting factor, and then compute a weighted average of the geographic distance between each R&D subsidiary and the target. This method captures the differential influence that individual subsidiaries exert based on their innovation activity, rather than assuming uniform contribution across all units. The results using this refined measure are reported in Table 9. Most results are consistent with the main except that the moderating effect of Geographic dispersion on Distance subs to target becomes less statistically significant (P-value = 0.517). One possible explanation is that, when innovation is concentrated in a few core R&D subsidiaries, geographic dispersion of the network has limited impact on the subsidiary-target distance effect. In other words, dispersion among low-innovation subsidiaries does not materially affect integration or knowledge flows, consistent with prior work on the distribution and intensity of innovative activities (Alcácer & Zhao, Reference Alcácer and Zhao2012; Singh, Reference Singh2008).
Robustness check using patent-count-weighted measure of Distance subs to target

Table 9 Long description
Negative binomial model results are reported for five specifications labeled Model 1 through Model 5, with coefficients and standard errors in parentheses. Distance HQ to target is not included in Model 1, then is minus 0.123 with standard error 0.045 in Model 2, minus 0.176 with 0.051 in Model 3, minus 0.142 with 0.044 in Model 4, and minus 0.140 with 0.045 in Model 5, each with three asterisks. Distance subs to target is 0.093 with 0.042 and two asterisks in Model 2, 0.087 with 0.041 and two asterisks in Model 3, then minus 0.006 with 0.055 in Model 4 and minus 0.005 with 0.055 in Model 5. Geographic dispersion appears in Models 4 and 5, with 0.447 and standard error 0.281 in Model 4, and 0.304 with 0.071 and three asterisks in Model 5. Interaction terms appear in later models: the interaction of Distance HQ to target with Distance subs to target is minus 0.030 with 0.012 and two asterisks in Model 3 and 0.003 with 0.013 in Model 5; the interaction of Distance HQ to target with Geographic dispersion is minus 0.082 with 0.025 and three asterisks in Model 4 and minus 0.086 with 0.030 and three asterisks in Model 5; the interaction of Distance subs to target with Geographic dispersion is minus 0.021 with 0.032 in both Models 4 and 5. Across Models 1 to 5, Acquirer R and D intensity ranges from minus 5.002 with 1.429 to minus 4.507 with 1.287, each with three asterisks; Distance HQ to subs is 0.188 with 0.035 and three asterisks in Model 1 and is 0.095 with 0.059, 0.109 with 0.058 and one asterisk, 0.017 with 0.066, and 0.016 with 0.066 in Models 2 to 5. Year and Industry are marked Y in all models; N is 346.000 for all models; Chi square is 157.411, 169.393, 175.615, 233.898, and 233.953; Log likelihood is minus 2106.875, minus 2100.884, minus 2097.773, minus 2068.632, and minus 2068.604.
Notes: Standard errors are reported in parentheses.
*** P < 0.01, ** P < 0.05, * P < 0.1.
Fourth, to further account for knowledge similarity between subsidiaries and the target, we construct another alternative measure of Distance subs to target that directly incorporates technological overlap. Specifically, we retrieve patents (both invention and utility models) for all subsidiaries and the target from IncoPat and aggregate their IPC classifications at the four-digit level over the 5 years prior to the acquisition. For each subsidiary, we count the number of four-digit IPC classes shared with the target and then sum these shared counts across all subsidiaries within the same corporate group. The technological overlap between a given subsidiary and the target is defined as the number of shared IPC classes for that subsidiary divided by the total number of shared IPC classes between all subsidiaries and the target, following prior work on technological overlap. We then use these technological overlap values as weights to compute a weighted geographic distance between subsidiaries and the target and take the natural logarithm of this weighted distance as an alternative measure of Distance subs to target. The results based on this overlap-weighted distance, reported in Table 10, are highly consistent with our main findings.
Robustness check using technological-overlap-weighted measure of Distance subs to target

Table 10 Long description
Negative binomial model results are reported for five specifications labeled Model 1 through Model 5, with coefficients and standard errors in parentheses. Distance HQ to target appears in Models 2 to 5 with coefficients minus 0.157 with three stars, minus 0.188 with three stars, minus 0.166 with three stars, and minus 0.168 with three stars, with standard errors 0.047, 0.051, 0.045, and 0.046. Distance subs to target appears in Models 2 to 5 with coefficients 0.087 with three stars, 0.082 with three stars, minus 0.014, and minus 0.011, with standard errors 0.028, 0.028, 0.037, and 0.038. Geographic dispersion appears in Models 4 and 5 with coefficients 0.328 and 0.324 with three stars, with standard errors 0.054 and 0.055. Interaction terms are included as follows: the term labeled (1) times (2) is minus 0.016 with one star in Model 3 and minus 0.003 in Model 5; the term labeled (1) times (3) is minus 0.064 with three stars in Model 4 and minus 0.062 with two stars in Model 5; the term labeled (2) times (3) is minus 0.059 with one star in Model 4 and minus 0.055 with one star in Model 5, with corresponding standard errors shown in the table. Control variables are listed for all models, including Acquirer R and D intensity, Distance HQ to subs, Acquirer age, Acquirer profit, Acquirer size, Acquirer acquisitions, Target acquisition share, Target tech advancement, Advancement gap, and Domestic institutional difference, with year and industry marked Y in every model. Sample size N is 346.000 for all models; chi square values are 157.411, 173.763, 176.763, 238.431, and 238.540; log likelihood values are minus 2106.875, minus 2098.699, minus 2097.199, minus 2066.365, and minus 2066.311.
Notes: Standard errors are reported in parentheses.
*** P < 0.01, ** P < 0.05, * P < 0.1.
Fifth, we re-estimate our models at the firm level by averaging all deal-level variables to the acquiring firm-year level. This approach mitigates concerns that results may be driven by idiosyncratic characteristics of individual transactions or by firms engaging in multiple acquisitions within the same period. As shown in Table 11, the results are consistent for all the hypotheses, supporting the main findings.
Robustness check using firm-level analysis

Table 11 Long description
Negative binomial model results are reported for five specifications labeled Model 1 through Model 5, with coefficients and standard errors in parentheses. Distance HQ to target appears in Models 2 to 5 with coefficients minus 0.129, minus 0.172, minus 0.118, and minus 0.120, with standard errors 0.055, 0.059, 0.047, and 0.048. Distance subs to target appears in Models 2 to 5 with coefficients 0.059, 0.049, minus 0.189, and minus 0.183, with standard errors 0.032, 0.033, 0.078, and 0.086. Geographic dispersion appears in Models 4 and 5 with coefficients 0.427 and 0.424, with standard errors 0.069 and 0.073. Interaction terms are included as follows: Distance HQ to target times Distance subs to target is minus 0.020 with standard error 0.009 in Model 3 and minus 0.002 with standard error 0.014 in Model 5; Distance HQ to target times Geographic dispersion is minus 0.047 with standard error 0.028 in Model 4 and minus 0.046 with standard error 0.029 in Model 5; Distance subs to target times Geographic dispersion is minus 0.155 with standard error 0.058 in Model 4 and minus 0.149 with standard error 0.068 in Model 5. Control variables are listed for all models, including Acquirer R and D intensity, Distance HQ to subs, Acquirer age, Acquirer profit, Acquirer size, Target acquisition share, Target tech advancement, Advancement gap, and Domestic institutional difference, plus Year and Industry marked Y in every model. Sample size N is 284.000 for all models, with Chi square values 100.195, 107.751, 111.446, 174.812, and 174.842, and Log likelihood values minus 1704.342, minus 1700.564, minus 1698.717, minus 1667.034, and minus 1667.019.
Notes: Standard errors are reported in parentheses.
*** P < 0.01, ** P < 0.05, * P < 0.1.
Discussion
As corporate groups engage in technological acquisitions, they often face a geographic distance dilemma: gains from accessing diverse knowledge in distant locations are often offset by heightened coordination challenges. Much of the existing research adopts a dyadic view between acquirer and target, neglecting the geographically distributed nature of corporate groups. Drawing on economic geography and network theory, we conceptualize technological acquisition as a process of reconfiguring the firm’s geographically distributed R&D network. Based on a sample of 346 domestic technological acquisitions by Chinese corporate groups, we find that the distance between the headquarters and the target exerts a negative impact on post-acquistion innovation. In contrast, the distance between R&D subsidiaries and the target has a positive effect. We also find that geographic proximity between the headquarters and the target strengthens the positive effects associated with subsidiary-target distance. Furthermore, greater geographic dispersion of the corporate group attenuates the negative effect of headquarters-target distance and weakens the positive effect of subsidiary-target distance. These findings highlight that geographic distance in technological acquisitions cannot be understood in isolation, but must be evaluated through the network lens of the corporate group’s internal geographic configuration.
Theoretical Contributions
We have made three main contributions. First, we extend M&A research beyond the dominant dyadic perspective of acquirer–target relationships by focusing on the multi-layered, geographically distributed corporate groups as the acquirers. Prior studies largely treat the acquiring firm as a unified, monolithic entity (e.g., Chakrabarti & Mitchell, Reference Chakrabarti and Mitchell2016; McCarthy & Aalbers, Reference McCarthy and Aalbers2016), overlooking the reality that many acquirers are geographically dispersed corporate groups (Ardito et al., Reference Ardito, Natalicchio, Petruzzelli and Garavelli2017). Zooming into the internal organizational structure of corporate groups, we adopt a network lens and shift the analytical focus to the broader intra-organizational R&D network of the acquirer. This network lens enables a more nuanced understanding of how geographic distance shapes post-acquisition innovation – not as a singular relational factor, but as a set of interdependent spatial relationships among headquarters, subsidiaries, and the acquired firm. Specifically, we show that headquarters and R&D subsidiaries occupy distinct structural positions in technological acquisitions (Meyer et al., Reference Meyer, Li and Schotter2020; Yiu et al., Reference Yiu, Lu, Bruton and Hoskisson2007), leading their respective geographic distances from the target to have differential implications for post-acquisition innovation. By conceptualizing technological acquisitions as a strategy to reconfigurate the innovation network of corporate groups (Hernandez & Menon, Reference Hernandez and Menon2018; Öberg et al., Reference Öberg, Henneberg and Mouzas2007), we provide a nuanced understanding of how inter-organizational spatial relationships between the target and different internal actors shape post-acquisition outcomes.
Second, we contribute to the innovation and economic geography literature by addressing the long-standing geographic distance dilemma in technological acquisitions. Prior research presents conflicting views: while some studies argue that geographical distance hampers communication and coordination, thereby negatively affecting innovation outcomes (McCarthy & Aalbers, Reference McCarthy and Aalbers2016), others suggest that distance is associated with access to diverse, novel knowledge that fosters innovation (Ozer & Zhang, Reference Ozer and Zhang2015; Su & Moaniba, Reference Su and Moaniba2020). This dilemma highlights the dual role of distance in open innovation – as both a barrier to integration and a source of valuable heterogeneity (Zaheer & Hernandez, Reference Zaheer and Hernandez2011). We resolve this paradox by incorporating the intra-organizational structure of corporate groups into the analysis, distinguishing between the roles of headquarters and R&D subsidiaries in the acquisition process. Specifically, while geographic distance from headquarters impedes strategic alignment and integration – thereby harming innovation outcomes – distance from R&D subsidiaries facilitates the exploration of non-redundant technological knowledge, thereby enhancing innovation. This differentiated perspective clarifies that the costs and benefits of geographic distance are not inherently contradictory, but rather contingent on organizational roles within the corporate network. By situating the geographic distance dilemma within the network of corporate groups, our study not only resolves prior inconsistencies but also deepens the theoretical dialogue between innovation research and economic geography, highlighting the need to account for internal geography heterogeneity in external acquisition.
Third, we advance the literature on network dynamics by theorizing technological acquisitions as a strategy for reconfiguring a firm’s geographically distributed R&D network through the incorporation of new nodes into existing knowledge network. While prior research in social networks has underscored the dynamic nature of interorganizational ties and their implications for innovation, limited attention has been paid to how geographic network reconfiguration, especially via acquisitions, influences innovative outcomes (Ahuja, Soda, & Zaheer, Reference Ahuja, Soda and Zaheer2012; Kumar & Zaheer, Reference Kumar and Zaheer2022). Moreover, although scholars have noted that reconfiguration is path-dependent and shaped by existing network structures (Parmigiani & Rivera-Santos, Reference Parmigiani and Rivera-Santos2011; Soda, Usai, & Zaheer, Reference Soda, Usai and Zaheer2004), few studies examine how pre-existing and evolving structures jointly affect post-acquisition innovation. To address this gap, we examine how the corporate group’s geographic dispersion moderates the innovation effects of geographic distance in acquisitions. We find that greater dispersion amplifies the negative impact of headquarters-target distance by compounding challenges in strategic alignment and coordination. Meanwhile, it diminishes the positive effect of R&D subsidiary-target distance by reducing the marginal benefit of accessing novel external knowledge, due to already broad spatial exposure. These findings highlight the contingent value of network reconfiguration, showing that the innovation gains from geographic expansion through acquisition hinge on the structural characteristics of the existing R&D network (Grigoriou & Rothaermel, Reference Grigoriou and Rothaermel2017). By doing so, we contribute to emerging research on network evolution through a geographic lens, and offer a dynamic network perspective on how firms can reconfigure their innovation systems via external acquisition strategies to enhance innovation.
Practical Implications
Our findings also yield several practical implications for geographically distributed corporate groups engaging in technological acquisitions.
First, managers should view technological acquisitions not merely as bilateral transactions between acquirer and target, but as opportunities to strategically reconfigure the corporate group’s broader R&D network. This requires careful assessment of how the newly acquired geographic node fits within the firm’s existing R&D network. Specifically, firms need to evaluate not only the strategic alignment and integration potential between the headquarters and the target, but also the heterogeneity and complementarity between the target and other R&D subsidiaries. Such a network-oriented evaluation enables corporate groups to unlock the full innovation potential of technological acquisitions.
Second, firms should adopt a differentiated role perspective to better understand and manage the effects of geographic distance on acquisition performance. Rather than viewing geographic distance as uniformly beneficial or harmful, managers should recognize that its impact differs depending on whether it is from the headquarters or R&D subsidiaries. Proximity between the headquarters and the target supports strategic alignment and integration, which are critical for overall acquisition success. In contrast, geographic distance between R&D subsidiaries and the target can foster innovation by offering opportunities for novel, non-redundant knowledge. By embracing this role-based understanding, firms can design more nuanced acquisition strategies that leverage the benefits of distance while mitigating its downsides.
Third, our findings suggest that the innovative gains from geographic expansion via acquisition depend heavily on the structure of the existing R&D network. For firms with already highly dispersed networks, the marginal benefits of acquiring distant knowledge may diminish, while coordination burdens may increase. Therefore, corporate groups should assess the level of geographic dispersion in their current network and use it as a guide to determine where and how to grow. What matters is not just the distance itself, but how well the new node complements the existing geographical structure of the network. In sum, successful innovation through technological acquisition requires a nuanced understanding of geography – not only in terms of where the target is, but also how that location interacts with the firm’s broader geographical configuration.
Limitations and Future Research Directions
This study has some limitations. First, our study focuses on domestic acquisitions within a single national context, i.e., China. Although China spans a vast territory with substantial regional heterogeneity (Guo et al., Reference Guo, Jiang, Xu and Yang2020; Zeng et al., Reference Zeng, Wu, Liu, Huang, Zhao and Liu2019), the range of geographic distance and dispersion observed in our data remains limited compared to a multinational setting. Prior research suggests that the relationship between geographic distance, dispersion, and innovation outcomes may follow an inverted U-shape, where the benefits of distance give way to coordination challenges beyond a certain threshold (e.g., Lahiri, Reference Lahiri2010). However, the potentially negative effects associated with extreme distances may be underrepresented in our findings given the domestic context. Moreover, international acquisitions involve not only spatial separation but also cultural, institutional, and political differences, which may further complicate the mechanisms of knowledge diversity and integration, particularly in the current geopolitical climate (Li & Wang, Reference Li and Wang2025). Future research should extend this line of inquiry to international contexts, examining whether the spatial dynamics observed here hold under more heterogeneous international regimes.
Second, while we differentiate between the headquarters and R&D subsidiaries to reflect their distinct network positions and functional roles in the context of technological acquisition, this binary classification may oversimplify the complexity of intra-firm structures. In reality, due to differences in firm size, profit, R&D intensity and other factors, the degree of functional differentiation between headquarters and subsidiaries may vary considerably across firms. To account for such heterogeneity, we introduce a moderating variable, subsidiary innovation dominance, which captures the proportion of pre-acquisition patents filed by subsidiaries relative to the entire corporate group. This measure serves as a proxy for the functional centrality of subsidiaries in the firm’s innovation system. Our findings suggest that when subsidiaries play a more prominent innovation role, the effects of distance from the target to headquarters versus subsidiaries are more pronounced, supporting our theoretical logic. Nonetheless, future research could further explore other factors that may influence the distinctiveness of intra-organizational roles, such as knowledge governance mechanisms, decision-making decentralization, or the presence of regional innovation hubs. These structural and managerial characteristics may shape how innovation responsibilities are distributed within the corporate group, and in turn, affect the relative influence of headquarters and subsidiaries on post-acquisition innovation outcomes.
Third, although we have implemented several robustness checks, including controls for pre-acquisition innovation, acquirer size, and a Heckman two-stage model, to mitigate potential endogeneity, our cross-sectional design inherently limits causal inference. Specifically, there remains the possibility of unobserved firm-level or deal-specific factors (e.g., managerial intent, unmeasured absorptive capacity, or pre-existing informal ties) that simultaneously influence both geographic configuration and post-acquisition innovation performance. As such, while our findings are consistent with our theoretical predictions, they should be interpreted as associational rather than strictly causal. Future research could strengthen causal identification by exploiting longitudinal data, natural experiments, or instrumental variable approaches to better isolate the exogenous variation in spatial acquisition strategies.
Conclusion
Using a sample of 346 domestic technological acquisitions by Chinese corporate groups, this study investigates how geographic distance affects post-acquisition innovation within geographically distributed corporate groups. Confronting the paradox of distance, we draw on economic geography and network theory to reveal the differentiated roles of headquarters and R&D subsidiaries. We find that while headquarters-target distance impairs innovation through integration challenges, subsidiary-target distance enhances innovation by facilitating knowledge exploration. These effects are further shaped by the group’s internal geographic configuration: Headquarters-target proximity amplifies the innovation benefits of subsidiary-target distance by facilitating coordination across heterogeneous knowledge bases. In contrast, greater geographic dispersion increases coordination burdens and diminishes the marginal value of distant knowledge, thereby making proximity to both headquarters and subsidiaries a more favorable condition for innovation. By conceptualizing technological acquisition as a process of network reconfiguration, our study offers a network lens on how corporate groups reorganize their geographic R&D network structures to optimize innovation in technological acquisitions.
Data availability statement
The final dataset that support the findings of this study are available at https://osf.io/kg7qa/overview?view_only=fe744f57c33047f6867f2a059d102778
Acknowledgements
We appreciate the help and hard work of Editor-in-Chief Professor Xiao-Ping Chen, Senior Editor Professor Jiamin Zhang, and the three anonymous reviewers. Excellent research assistance was provided by Yuxin Liu. This research is supported by the National Natural Science Foundation of China (72502139; 71902109) and SUFE Behavioral Lab for Innovation and Entrepreneurship.
Shixiang Wang (wang.shixiang@sufe.edu.cn) is an associate professor at the College of Business, Shanghai University of Finance and Economics. Her research focuses on corporate strategy, innovation management, and international business. She has published in several journals, including Strategic Management Journal, Journal of International Business Studies, Journal of Economic Geography, Management and Organization Review, Asia Pacific Journal of Management, and Technovation.
Yu Shen (2023310050@stu.sufe.edu.cn) is a doctoral student at the College of Business, Shanghai University of Finance and Economics. Her research focuses on social network, strategic alliance, and technology innovation. She also pays close attention to international business and intellectual property management.
Chuanjia Li (li.chuanjia@sufe.edu.cn) is an associate professor at the College of Business, Shanghai University of Finance and Economics. Her research focuses on social networks, digitalization and artificial intelligence, innovation, and creativity. She has published in several journals, including Academy of Management Journal and Asia Pacific Journal of Management.
Appendix A. Propensity Score Matching Design
This Appendix provides additional details on the propensity score matching (PSM) procedures used to address potential selection on observables in the relationship between geographic distance and post-acquisition innovation outcomes. Specifically, we implement PSM for both headquarters-target distance and subsidiaries-target distance and use the matched samples to conduct robustness checks of our main findings.
1. Propensity score model: Headquarters-target distance
We first focus on the distance between the acquiring firm’s headquarters and the target. We define a binary treatment indicator, HighDist_HQTargeti, which equals 1 if the headquarters-target distance for acquisition i is above the sample median, and 0 otherwise. We then estimate the following probit model:
 \begin{align}
\text{P}(\text{HighDist}\_\text{HQTarget}_\text{i} = 1|\text{X}_\text{i})=\Phi(\alpha+\beta^{\prime}\text{X}_\text{i}),
\end{align}
where Φ(⋅) is the cumulative distribution function of the standard normal distribution and Xi is a vector of acquisition-level covariates. Consistent with our theoretical arguments and data availability, Xi includes: past innovation performance, acquirer age, acquirer size, and target acquisition share. The estimated coefficients from Equation (A1) are used to construct the propensity score for each acquisition as the predicted probability of being in the ‘high headquarters-target distance’ group.
2. Propensity score model: Subsidiaries-target distance
We apply an analogous procedure to the distance between the acquirer’s R&D subsidiaries and the target. We define a binary treatment indicator, HighDist_SubsTargeti, which equals 1 if the subsidiaries-target distance for acquisition i is above the sample median and 0 otherwise. The corresponding probit model is:
 \begin{align}
\text{P}(\text{HighDist}\_\text{HQTarget}_\text{i} = 1|\text{Y}_\text{i})=\Phi(\gamma+\delta^{\prime}\text{Y}_\text{i}),
\end{align}
where Yi is a vector of covariates. For comparability, we use the same set of covariates as in Equation (A1): past innovation performance, acquirer age, acquirer size, and target acquisition share. The estimated coefficients from Equation (A2) are used to compute the propensity scores for the subsidiaries-target distance specification.
3. Matching algorithm and parameters
For both distance measures, we use the estimated propensity scores to construct matched samples. We adopt radius matching with a caliper and allow for 1:N matching with replacement. For each treated acquisition, we identify all control acquisitions whose propensity scores lie within the radius of 0.005. Treated acquisitions with no suitable control within this caliper are discarded. We also drop control acquisitions that are never selected as matches. Consequently, the matched samples retain only those acquisitions that are observationally comparable in terms of their propensity to undertake high-distance acquisitions. After applying the matching procedure, the final matched sample for the headquarters-target distance specification includes 339 acquisitions, while the matched sample for the subsidiaries-target distance specification comprises 325 acquisitions.
4. Balance diagnostics: Standardized mean differences and variance ratios
We assess matching quality using standard balance diagnostics. For each covariate, we compute the standardized mean difference between the treated and control groups. Tables A1 and A2 below report standardized mean differences, and variance ratios for all covariates before and after matching for the headquarters-target distance and subsidiaries-target distance specifications, respectively. Figures A1 and A2 below provide graphical summaries of the standardized mean differences.
The SMD and VR before and after matching for Distance HQ to target

The SMD and VR before and after matching for Distance subs to target

Standardized mean differences before and after matching for Distance HQ to target

Standardized mean differences before and after matching for Distance subs to target

The diagnostics show that matching substantially improves balance:
• For headquarters-target distance, all post-matching standardized mean differences fall below 0.10 (Rosenbaum & Rubin, Reference Rosenbaum and Rubin1985), and all variance ratios lie between 0.94 and 1.32, well within commonly accepted ranges (Stuart & Rubin, Reference Stuart and Rubin2008).
• For subsidiaries-target distance, all post-matching standardized mean differences are also below 0.10, and the variance ratios lie between 0.74 and 1.01.
In addition, none of the covariates differ significantly between the treated and control groups after matching. Taken together, these diagnostics indicate that the covariates are well balanced in the matched samples and that the PSM procedure effectively reduces observable selection bias.
5. Post-matching outcome models
Using the matched samples, we re-estimate the outcome models employed in the main analysis. Specifically, we estimate the same regression specification as in the baseline results, but restrict the sample to the matched acquisitions and treat the distance measures (headquarters-target distance and subsidiaries-target distance, respectively) as exogenous conditional on observables.
The regression results for the headquarters-target distance specification based on the matched sample are reported in Table 5 of the manuscript. The corresponding results for the subsidiaries-target distance specification are reported in Table 6. Across both specifications, the key coefficients on the distance variables and their interaction terms remain statistically and economically similar to those in the baseline models, suggesting that our main conclusions are robust to accounting for selection on observables via PSM.