


Exclusionary attitudes—prejudice toward outgroups and opposition to the policies that promote their well-being (Enos Reference Enos2014)—have been implicated in political and social strife worldwide, including populist voting in the United States (Reny, Collingwood and Valenzuela Reference Reny, Collingwood and Valenzuela2019; Sides, Tesler, and Vavreck Reference Sides, Tesler and Vavreck2018) and the resurgence of far-right political parties in Europe (Dinas et al. Reference Dinas, Matakos, Xefteris and Hangartner2019; Hangartner et al. Reference Hangartner, Dinas, Marbach, Matakos and Xefteris2019). Unfortunately, previous research has found that intergroup prejudices and corresponding exclusionary political attitudes typically are strong (Hopkins, Sides and Citrin Reference Hopkins, Sides and Citrin2019; Tesler Reference Tesler2015), arise in the presence of even minimal group differences (Tajfel Reference Tajfel1970), persist over time (Lai et al. Reference Lai, Nosek, Sartori, Shin, Marini and Rubichi2016), and are likely to further grow in response to demographic change (Craig and Richeson Reference Craig and Richeson2014; Hajnal and Rivera Reference Hajnal and Rivera2014; Hopkins Reference Hopkins2010; Sands and de Kadt Reference Sands and de Kadt2019; Velez Reference Velez2018). Moreover, few strategies have been shown to allow individuals, organizations, or policymakers to feasibly reduce these exclusionary attitudes in practice (Paluck Reference Paluck2016; Paluck and Green Reference Paluck and Green2009b). The few such strategies that have been identified typically decay within days (Lai et al. Reference Lai, Nosek, Sartori, Shin, Marini and Rubichi2016) or require intense intervention over months or years (e.g., Paluck and Green Reference Paluck and Green2009b; but see Broockman and Kalla Reference Broockman and Kalla2016; Simonovits, Kezdi, and Kardos Reference Simonovits, Kezdi and Kardos2018).
Theories from psychology suggest that individuals resist persuasion on many topics, including those related to outgroups, due to self-image concerns. These theories argue that individuals do not want to admit that their current views are in error and that yielding to persuasion may also threaten their sense of autonomy by making them feel vulnerable to manipulation by others (Cohen, Aronson, and Steele Reference Cohen, Aronson and Steele2000). Consistent with these motivations to resist persuasion, research finds that individuals engage in motivated reasoning, being motivated to dismiss evidence and arguments contrary to their views (Leeper and Slothuus Reference Leeper and Slothuus2014; Miller Reference Miller1976; Sigelman and Sigelman Reference Sigelman and Sigelman1984), and are often resistant to durable persuasion on many topics (e.g., Kalla and Broockman Reference Kalla and Broockman2018; Paluck Reference Paluck2009).
Fortunately for individuals and organizations who wish to persuade, prior work in psychology has also documented several lab-based strategies that are able to reduce individuals’ resistance to persuasion by seeking to elude or assuage these self-image concerns (e.g., Chen, Minson, and Tormala Reference Chen, Minson and Tormala2010; Cohen, Aronson, and Steele Reference Cohen, Aronson and Steele2000; Itzchakov, Kluger, and Castro Reference Itzchakov, Kluger and Castro2017; Slater and Rouner Reference Slater and Rouner2002; Steele, Spencer, and Lynch Reference Steele, Spencer and Lynch1993). However, it is not immediately clear how individuals and organizations seeking to persuade could practically deploy many of these lab-based strategies in the real world, such as in interpersonal conversations between colleagues or with voters as part of a political campaign.
In this article, we argue that a strategy that attempts to address these sources of resistance to persuasion can facilitate the durable reduction of exclusionary attitudes in interpersonal conversations: the non-judgmental exchange of narratives. We define the non-judgmental exchange of narratives as a strategy where an individual attempts to persuade another person by providing to or eliciting from them narratives about relevant personal experiences while non-judgmentally listening to the views they express. This approach builds on two strategies in the psychology literature: narrative persuasion and high-quality listening. In this article, we present three original, pre-registered field experiments that support our argument about the effectiveness of this approach. These experiments deployed the non-judgmental exchange of narratives to durably reduce prejudice toward two outgroups and increase support for policies that promote their well-being: unauthorized immigrantsFootnote 1 and transgender people. These experiments took place across 7 US locations in partnership with canvassers affiliated with 7 community-based organizations and involved conversations with 6,869 voters.
In the first field experiment we present, we randomly varied the presence of the non-judgmental exchange of narratives strategy while holding constant the other content of the conversations. This experiment found that door-to-door canvassing conversations that employed this strategy reduced exclusionary attitudes toward unauthorized immigrants for at least four months, whereas otherwise identical conversations that omitted this strategy had no detectable effects. The null effects of these otherwise identical conversations support our argument about the effects of non-judgmentally exchanging narratives, in addition to helping assuage concerns about demand effects.
Our second and third field experiments targeted attitudes toward transgender people and explored potential boundary conditions on these effects. These experiments tested whether this strategy could be effective on a new topic (in Experiments 2 and 3), with other kinds of narratives (in Experiment 2), and when these narratives are shared through other mediums (in Experiments 2 and 3). In particular, in a second treatment condition in Experiment 2, targeting transphobia, canvassers only shared narratives from a third party shown in a video; this tested whether non-judgmentally exchanging narratives from third parties could also be effective. In Experiment 3, canvassers again provided and elicited narratives to reduce transphobia, but did so by phone instead of at the door; this tested whether an in-person exchange was required. Both these experiments were motivated by a desire to test whether the non-judgmental exchange of narratives could be effective when deployed in a more easily scalable manner. Encouragingly, we found reductions in transphobia and increases in support for policies to protect transgender people from discrimination across these more scalable approaches to non-judgmentally exchanging narratives.
Our studies are relatively unique among field experiments in varying the presence of a particular strategy across multiple treatment conditions and in probing its boundary conditions in multiple experiments (e.g., Gerber, Green, and Larimer Reference Gerber, Green and Larimer2008). Across our three experiments, we show that the strategy of non-judgmentally exchanging narratives can be successfully deployed with differing narratives; across diverse geographic contexts; when practiced by individuals and organizations with little to no prior experience; on two highly contentious topics; in the presence of contrary elite messages; and across modes of conversation. With this said, although, like many other experiments, our experiments cannot isolate a particular mechanism, we explain the theoretical reasoning that led us to expect these treatments to have the effects that they did; and, in Experiment 1, we support this reasoning by testing modified treatments where our argument predicts effects should diminish.
In the pages that follow, we first provide more theoretical background about the non-judgmental exchange of narratives strategy we describe and detail how it was implemented in our three field experiments. We next describe the experimental design and results of our studies. We conclude by discussing broader implications and remaining questions for future research.
THE NON-JUDGMENTAL EXCHANGE OF NARRATIVES
Theoretical Background: Self-Image Concerns and Resistance to Persuasion
Theories from psychology suggest that individuals often resist persuasion because yielding to it would pose a threat to their self-image. First, yielding to persuasion may necessarily involve admitting that one has held views that were in error, threatening self-image (Cohen, Aronson, and Steele Reference Cohen, Aronson and Steele2000). Second, individuals’ current attitudes may support their self-image while contrary attitudes may endanger it; for example, admitting that one’s political party supports policies one opposes may threaten the self-esteem individuals derive from their partisan identities (Theodoridis Reference Theodoridis2017), as might recognizing any inconsistency between different attitudes one holds (Little Reference Little2019; Steele and Liu Reference Steele and Liu1983). Such motivations may contribute to patterns well-known to political scientists, such as the pattern that individuals adopt their preferred party’s positions on issues (Lenz Reference Lenz2013). Finally, individuals may also dislike seeing themselves as susceptible to persuasion, as this can threaten their sense of autonomy by making them feel vulnerable to manipulation by others (Brehm Reference Brehm1966; Pavey and Sparks Reference Pavey and Sparks2009; Slater and Rouner Reference Slater and Rouner2002).
Common approaches to political persuasion that individuals and campaigns deploy may unintentionally serve to exacerbate these motives to resist persuasion. For example, campaigns often portray opponents and their supporters as deserving condemnation, as Hillary Clinton famously did in 2016 when referring to many supporters of Donald Trump’s presidential candidacy as a “basket of deplorables” (Sides, Tesler, and Vavreck Reference Sides, Tesler and Vavreck2018, 146). But such condemnations may backfire, heightening the motivation of potentially persuadable voters to counter-argue and defend their current views. Indeed, consistent with the potential for such reactance in the case of Clinton’s comment, the Trump campaign began to repeat it in campaign ads, underscoring for their supporters who might otherwise have been persuaded to vote for Clinton, the threat that supporting Clinton would thus present to their self-image (Sides, Tesler, and Vavreck Reference Sides, Tesler and Vavreck2018, 146). Likewise, in contexts such as college campuses, there is evidence for the existence of a “call-out culture” that encourages individuals to condemn perceived expressions of exclusionary attitudes (Lukianoff and Haidt Reference Lukianoff and Haidt2019; Sawaoka and Monin Reference Sawaoka and Monin2018). However, while potentially playing an important role in discouraging exclusionary behavior (Paluck Reference Paluck2009), such condemnations may unintentionally increase resistance to persuasion among those who harbor exclusionary attitudes by heightening the negative self-image consequences of yielding to persuasion.
How can individuals and organizations seeking to persuade others attempt to overcome this challenge? It may seem obvious that condemnation would not facilitate persuasion, but it is less obvious how to reduce many sources of resistance to persuasion outside of a lab. Lab studies have highlighted a variety of strategies that reduce resistance to persuasion by reducing the threat that yielding to persuasion poses to self-image (Cohen, Aronson, and Steele Reference Cohen, Aronson and Steele2000; Gehlbach and Vriesema Reference Gehlbach and Vriesema2019; Sherman, Nelson, and Steele Reference Sherman, Nelson and Steele2000). For example, in some lab studies, individuals are instructed to write essays that provide alternative sources of self-esteem, such as essays reflecting on the characteristics of themselves that they value (e.g., Cohen, Aronson, and Steele Reference Cohen, Aronson and Steele2000; Steele Reference Steele1988). However, it is not immediately clear from these prior lab-based studies how individuals and organizations seeking to persuade others (e.g., on policies toward outgroups) could practically deploy these strategies in the real world, such as in interpersonal conversations between colleagues or with voters as part of a political campaign. It is not easy to imagine, for example, a Presidential candidate’s television advertisement successfully prompting its viewers to write a reflective essay before viewing the rest of it. More generally, it is not immediately clear how individuals or organizations can argue that an opposing candidate or contrary viewpoint is incorrect without threatening the self-image of those who currently disagree with them, the very individuals they must persuade.
Strategies for Overcoming Resistance to Persuasion
The non-judgmental exchange of narratives approach we study builds on two strategies from the psychology literature for overcoming resistance to persuasion that may arise from self-image concerns.
First, previous research indicates that individuals are especially open to persuasion from narratives,Footnote 2 as prior work in psychology has found that individuals perceive narratives as less manipulative and that narratives produce less counter-arguing than direct argumentation (Green and Brock Reference Green and Brock2000; Moyer-Gusé Reference Moyer-Gusé2008; Slater and Rouner Reference Slater and Rouner2002). This research finds that individuals see arguments as intended to persuade, and therefore as threatening to their sense of autonomy, but are more likely to perceive stories as primarily entertaining and non-manipulative. In addition, arguments are typically explicit (e.g., “immigrants are only a small share of the U.S. population”; e.g., Hopkins, Sides, and Citrin Reference Hopkins, Sides and Citrin2019), and therefore easy for individuals to explicitly counter-argue against (e.g., “but they will still compete for our jobs”). But it is more difficult to argue against a story; and individuals also often become “immersed” and “transported” into narratives, putting individuals into a less critical state of mind when they think about narratives than when individuals think about arguments, while also increasing engagement with their content (Green and Brock Reference Green and Brock2000, Reference Green, Brock, Green, Strange and Brock2002; Moyer-Gusé Reference Moyer-Gusé2008; Slater and Rouner Reference Slater and Rouner2002). Consistent with this, evidence from survey experiments finds that individuals are often more persuaded by narratives than by statistical evidence (Slater and Rouner Reference Slater and Rouner1996), and field experiments that successfully influence community norms through mass media often convey their messages through dramatic narratives (e.g., Banerjee, Barnhardt, and Duflo Reference Banerjee, Barnhardt, Duflo and Wise2017; Green, Wilke, and Cooper Reference Green, Wilke and Cooper2019; Paluck and Green Reference Paluck and Green2009a).
Second, previous research suggests that non-judgmental conversational contexts should also reduce resistance to attitude change by reducing threat to the self (Cohen, Aronson, and Steele Reference Cohen, Aronson and Steele2000; Steele Reference Steele1988). Outside of lab settings, it may not be readily feasible to reduce threat to the self by prompting individuals to engage in strategies such as writing self-affirming essays. However, listening in a “non-judgmental, empathic, and respectful” manner (Itzchakov, Kluger, and Castro Reference Itzchakov, Kluger and Castro2017, 105) has been found to limit defensive reactions and increase openness to alternative viewpoints by reducing perceived threat to the self and providing affirmation (Chen, Minson, and Tormala Reference Chen, Minson and Tormala2010; Itzchakov, Kluger, and Castro Reference Itzchakov, Kluger and Castro2017; see also Bruneau and Saxe Reference Bruneau and Saxe2012; Voelkel, Ren, and Brandt Reference Voelkel, Ren and Brandt2019). Itzchakov, Kluger, and Castro (Reference Itzchakov, Kluger and Castro2017) call this “high-quality listening,” and we summarize it as “non-judgmental listening.” In typical political exchanges where a persuader argues that one side of an issue or one candidate is superior to another, individuals’ self-image may be threatened by the persuader’s implicit or explicit negative judgments about individuals’ existing views, and they therefore may be motivated to rebut or ignore the persuader’s message. However, if a persuader shows respect by seeking out an individuals’ point of view and refraining from expressing any negative judgments of it, this may affirm individuals’ self-esteem and decrease the perceived threat to the self from also acknowledging the persuader’s viewpoint in reciprocation (Chen, Minson, and Tormala Reference Chen, Minson and Tormala2010; Itzchakov, Kluger, and Castro Reference Itzchakov, Kluger and Castro2017). In this way, creating a non-judgmental conversational context in which to persuade provides “a safe space” for political opponents to acknowledge alternative viewpoints (Itzchakov, Kluger, and Castro Reference Itzchakov, Kluger and Castro2017, 106). In addition, no viewpoint should be less threatening to the self than one’s own; and so, such conversations may even encourage individuals to explicitly acknowledge the merits of alternative viewpoints, promoting so-called “self-persuasion” as individuals begin to see arguments for alternative viewpoints as their own (Aronson Reference Aronson1999).
The non-judgmental exchange of narratives attempts to harness the strategies of narrative persuasion and non-judgmental listening identified in this prior work. Based on this prior work, we argue that interpersonal conversations that deploy the non-judgmental exchange of narratives can reduce exclusionary attitudes.
A recent paper by Broockman and Kalla (Reference Broockman and Kalla2016) lends support to this argument. Broockman and Kalla (Reference Broockman and Kalla2016) showed that conversations with 501 individuals in South Florida durably reduced transphobia. In these conversations, canvassers shared stories about transgender people and asked voters to share stories about times when others judged them negatively for being different. The authors theorize that these conversations were effective because they encouraged analogic perspective-taking, a form of perspective-taking in which “perceivers try to understand the target’s experience by recalling a different situation from their own experience that is presumed to parallel the target’s situation” (Gehlbach and Brinkworth Reference Gehlbach and Brinkworth2012, 16). However, examining the details of the canvass scripts and training from this study reveals that these conversations used several tactics that likely created a non-judgmental context and involved exchanging further narratives. Moreover, that article did not theorize—and its experiment did not manipulate—the presence of these strategies. The effects observed in Broockman and Kalla (Reference Broockman and Kalla2016) therefore could have arisen from many features of the conversations, such as the provision of basic information about who transgender people are (Flores et al. Reference Flores, Haider-Markel, Lewis, Miller, Tadlock and Taylor2018). In this article, we show the presence of the non-judgmental exchange of narratives may be necessary to produce the effects they observed (in Experiment 1) and that the analogic perspective-taking is itself not necessary (in Experiment 2). We also show that these same effects can be produced when non-judgmentally exchanging narratives by phone (in Experiment 3). We are not aware of other prior studies that have sought to combine narrative persuasion and non-judgmental listening.
One caveat to our argument is that it is agnostic about the content of the narratives that are exchanged, even though some narratives clearly will be more persuasive than others. In addition, different narratives may persuade through different mechanisms. In order to probe the generalizability of our argument across narratives, our empirical applications therefore show that the non-judgmental exchange of narratives can facilitate persuasion across several different kinds of narratives that likely persuade through different mechanisms. For example, Experiment 2 finds that the analogic perspective-taking is not necessary to produce the effects we observe, but this may be the mechanism underpinning persuasion in Experiment 3. Likewise, none of our findings are significantly moderated by whether canvassers are members of the target outgroup, meaning that brief contact with outgroup members is unlikely to be responsible for any of the effects we observe.Footnote 3 Further research should continue to probe boundary conditions on the effects of narratives and the mechanisms through which they can persuade.
Implementing the Non-judgmental Exchange of Narratives to Reduce Exclusionary Attitudes in Interpersonal Conversations
In this article, we test our argument that non-judgmentally exchanging narratives can facilitate durable persuasion with three experiments that focus on efforts to durably reduce exclusionary attitudes toward unauthorized immigrants and transgender people. Although future research should explore the efficacy of this strategy with other groups and issues, as we review below, attitudes toward these groups are currently highly contested in US politics and thought to be strong and resistant to change.
The experiments we present study outreach from canvassers for community-based organizations who reached out to have conversations with voters in person and over the phone, common mediums of political outreach. Despite the reliable effects of high-quality personal conversations on voter turnout (Green and Gerber Reference Green and Gerber2015), individuals often resist durable persuasion from these conversations (Bailey, Hopkins, and Rogers Reference Bailey, Hopkins and Rogers2016; Kalla and Broockman Reference Kalla and Broockman2018), with few documented exceptions (e.g., Broockman and Kalla Reference Broockman and Kalla2016).
In all the interpersonal conversations in our experiments, canvassers approached members of the general population by knocking on individuals’ doors or calling them on the phone unannounced. Canvassers first asked individuals their view on a policy issue related to an outgroup and what considerations were on each side of the issue for them.
Next, canvassers engaged in the strategy we study: non-judgmentally exchanging narratives. To implement this strategy, canvassers provided or elicited narratives that differed across the studies and conditions, such as narratives about personally known outgroup members or about other personal experiences. For example, in Experiment 1, which targeted attitudes toward unauthorized immigrants, canvassers asked individuals to tell a story about “a time when someone showed [them] compassion when [they] really needed it”; per the canvass training, this was intended to help elicit “voters’ own…experiences that relate to the undocumented immigrant experience.” Canvassers in Experiment 1 also provided narratives about immigrants they knew or, if they were immigrants, about themselves. The canvassers’ goal was to encourage individuals to engage in perspective-taking—that is, considering outgroup members’ point of view (Galinsky and Moskowitz Reference Galinsky and Moskowitz2000; Simonovits, Kezdi, and Kardos Reference Simonovits, Kezdi and Kardos2018)—and to activate—that is, increasing the salience of—inclusionary values (Druckman Reference Druckman2004b).
Canvassers engaged in this exchange non-judgmentally by explicitly expressing interest in understanding individuals’ views and experiences, while also not expressing any negative judgments toward any statements hostile to the outgroup individuals made. The canvass training likewise instructed canvassers to “make it clear [to voters] we’re not there to judge them and we’re curious about their honest experience, whatever it is.” During this exchange of narratives, canvassers asked questions that sought to prompt individuals to draw their own implications from the narratives. Canvassers’ goal was for this non-judgmental exchange of narratives to end with individuals self-generating and explicitly stating aloud implications of the narratives that ran contrary to their previously stated exclusionary attitudes. Qualitative debriefs with the canvassers indicate that such “self-persuasion” appeared to be common.
Finally, canvassers attempted to address common misconceptions, discussed why they were supportive of inclusionary policies, and asked individuals to describe whether and why the conversation changed their views.Footnote 4 The conversations lasted around 10 minutes on average. We describe more details below and in the Online Appendix, where we provide the full scripts.
As mentioned above, our experiments deploy different narratives so that we can establish our findings are general across types of narratives and not driven by any one particular type of narrative. We describe the narratives exchanged in the experiments in more detail below.
EXPERIMENT 1: DOES THE NON-JUDGMENTAL EXCHANGE OF NARRATIVES FACILITATE REDUCING EXCLUSIONARY ATTITUDES TOWARD UNAUTHORIZED IMMIGRANTS?
To test whether non-judgmentally exchanging narratives facilitates durable reductions in exclusionary attitudes, we conducted a randomized field experiment targeting exclusionary attitudes toward unauthorized immigrants.
Attitudes toward unauthorized immigration are salient in contemporary American society and have important implications for immigrants’ well-being (for a review, see Hainmueller and Hopkins Reference Hainmueller and Hopkins2014). American political elites have long used exclusionary rhetoric and supported exclusionary policies toward unauthorized immigrants, including in recent campaigns (Sides, Tesler, and Vavreck Reference Sides, Tesler and Vavreck2018). The 2016 American National Election Study also found that Americans had more negative evaluations of “illegal immigrants” than of any other group asked about on the survey, including Muslims, Christian fundamentalists, and transgender people. This hostile social and political environment has undermined political support for policies that would improve unauthorized immigrants’ well-being (Hainmueller et al., Reference Hainmueller, Lawrence, Martén, Black, Figueroa, Hotard, Jiménez, Mendoza, Rodriguez, Swartz and Laitin2017; Hainmueller, Hangartner, and Pietrantuono Reference Hainmueller, Hangartner and Pietrantuono2017). Prior work has found that such anti-immigrant exclusionary attitudes are strong and typically resistant to long-term change (e.g., Hopkins, Sides, and Citrin Reference Hopkins, Sides and Citrin2019).
Concern about local manifestations of these trends prompted local organizationsFootnote 5 to help develop and conduct the first intervention we report in three areas: central Tennessee; Fresno, California; and Orange County, California. In response to worksite raids by federal Immigration and Customs Enforcement (ICE) in Tennessee, a lack of legal assistance in immigration courts in Fresno, and local police reporting unauthorized immigrants to federal authorities in Orange County, the organizations had door-to-door canvassing conversations in fall 2018 in the areas they expected to have higher concentrations of individuals with exclusionary attitudes toward unauthorized immigrants.Footnote 6 These groups had no prior experience attempting to reduce exclusionary attitudes through interpersonal conversations. The canvassing took place during the run-up to the 2018 US midterm elections (August–October, 2018), in which immigration issues featured prominently, such as when US President Donald Trump repeatedly warned voters about a caravan of unauthorized immigrants approaching the US–Mexico border.
To measure the effects of these conversations, we conducted a pre-registered, randomized, placebo-controlled experiment and parallel survey measurement using the design in Broockman, Kalla, and Sekhon (Reference Broockman, Kalla and Sekhon2017). The experiment began by recruiting registered voters (n = 217,600) via mail for an ostensibly unrelated online baseline survey, presented as the first in a series of surveys not specifically about immigration and which made no reference to any potential canvassing. We gathered voters’ contact information to recruit them to the survey from the public lists of registered voters, which contains a number of other covariates we use to assess the representativeness of respondents with respect to the sampling frame of registered voters we attempted to recruit. We next randomly assigned baseline survey respondents (n = 7,870) to Full Intervention (n = 2,624), Abbreviated Intervention (n = 2,623), or Placebo conditions (n = 2,623). Blocked random assignment was conducted at the household level (n = 6,551 households) such that participants within the same household were always assigned to the same experimental condition.
Next, to deliver the intervention, staff and volunteers affiliated with the partner organizations went door-to-door during August–October, 2018, to visit individuals’ homes at their addresses in the voter registration database. As described above, canvassers began by knocking on voters’ doors unannounced. Canvassers then asked to speak with the person on their list who had enrolled in the study and confirmed the person’s identity. After the person’s identity was confirmed, canvassers implemented the experimental condition corresponding with the person’s random assignment.
When individuals were assigned to the Full Intervention, the conversations proceeded as described in the introduction: Canvassers asked individuals for their view on the issue, engaged in the non-judgmental exchange of narratives, addressed common misconceptions, and made supportive arguments. The Full Intervention condition included the non-judgmental exchange of narratives on two topics: canvassers’ and individuals’ previous experience with immigrants and, second, as described above, about “a time when someone showed [them] compassion when [they] really needed it.” Canvassers were trained to particularly focus on the latter. These narratives were intended to promote general perspective-taking (Galinsky and Moskowitz Reference Galinsky and Moskowitz2000), analogic perspective-taking (Gehlbach and Brinkworth Reference Gehlbach and Brinkworth2012), and the salience of compassion as a value (Rokeach Reference Rokeach1971).
The Abbreviated Intervention condition removed the exchange of these narratives but was otherwise identical to the Full Intervention, including containing addressing common misconceptions and making supportive arguments, similar to a traditional political canvass.
The Placebo condition was a brief (approximately 1 minute) conversation unrelated to immigration, conducted solely for the purpose of identifying which individuals could be contacted (Nickerson Reference Nickerson2005).Footnote 7
The Online Appendix provides further details about the intervention, including the full scripts. Table 1 also summarizes the experimental conditions.
Summary of Differences Between Conditions and Results in Previous Study and Experiments 1–3

Notes: Each Experiment also contained a Placebo condition not shown in the table. These Placebo conditions contained no persuasive content on the topics but are used as a baseline for comparison when estimating the effect sizes shown in the table.
a To summarize the results of each study, we first average the pre-specified Overall Index in each study across survey waves to compute a pooled Overall Index. We then report intent-to-treat (ITT) effects on this pooled Overall Index, which represents the mean difference between individuals assigned to each condition among all individuals who identified themselves at their doors, regardless of whether the conversation continued after that point. The ITT estimates represent the average causal effect of attempting to treat people who open their doors, even if they refuse to converse soon after. This means the ITT estimates are “diluted” by the presence of individuals who open the door but do not enter into the conversation.
b To estimate the implied Complier Average Causal effect (CACE), or the effect among those who received the intervention, we estimate compliance under a conservative definition of compliance, whether participants got to the “first rating” part of the conversation where they initially told canvassers how they felt about the policy. The CACE estimates represent the average causal effect of treating the people who do enter (or would have entered) into the conversation. These estimates require the assumption that there was no effect of beginning the conversation but not reaching this “first rating.” The p-values are identical to the ITT results.
Canvassers successfully reached 2,374 individuals at their doors across the three conditions. Approximately 70% of voters assigned to the Full Intervention condition who were reached went on to complete the entire conversation, and 77% shared a personal narrative with the canvasser, as recorded by canvassers after each conversation ended. On average, voters who identified themselves at their doors in the Full Intervention condition went on to converse for 11 minutes on average; this figure is 5 minutes for voters in the Abbreviated Intervention condition.Footnote 8 The canvassers had no experience conducting in-person conversations to reduce exclusionary attitudes prior to the project, had an average age of 25, and were ethnically diverse, with 54% self-identifying as Latino.
We recruited individuals who were reached to follow-up surveys that began 4 days (n = 1,578), 30 days (n = 1,508), and 3–6 months (n = 1,384) after the conversations.Footnote 9 We monitored responses to an open-ended question about any comments on the survey and debriefed the canvassers to see whether participants registered any suspicions that the canvass intervention was related to the surveys and found none.
The Online Appendix include further recruitment, design, survey, and estimation details, representativeness assessments (Table OA.1), and tests of design assumptions such as the proper implementation of the placebo, balance checks, and checks for differential attrition (Tables OA.2–8). The Online Appendix reports that end line participants are slightly more likely to be older, to be white, and to politically participate than individuals in the sampling frame recruited to the baseline survey, patterns that also appear in Experiments 2 and 3. These patterns appear to bias the estimates downwards, as Table OA.25 in the Online Appendix shows that applying survey weights typically increases the point estimates.
The intervention sought to reduce exclusionary attitudes toward unauthorized immigrants along two pre-registered dimensions: increasing support for more inclusionary government policies (e.g., granting legal status to people who were brought to the United States illegally as children) and decreasing prejudice toward unauthorized immigrants, defined broadly as negative attitudes toward the group (e.g., “I would have no problem living in areas where undocumented immigrants live”). The surveys included 6 items measuring support for policies related to immigrants and 7 items capturing anti-immigrant prejudice. As we pre-registered, we combine these two groups of items into two indices, a policy index and a prejudice index, as well as a third overall index containing all 13 items.
To estimate treatment effects in all our experiments, we use linear regressions including pre-registered pre-treatment covariates to increase precision (Gerber and Green Reference Gerber and Green2012). Given the household-level random assignment in all our studies, the standard errors are clustered at the household level. We pre-registered this estimation strategy and the covariates we would use to increase precision.
These estimated treatment effects are intent-to-treat (ITT) effects among all individuals who open their doors and identify themselves before the intervention and placebo scripts diverge. Because not all individuals continue with the intervention after this point, the estimates are therefore diluted by the presence of individuals who did not receive the entire intervention (Gerber and Green Reference Gerber and Green2012). As the Online Appendix describes, and as shown in Table 1, complier average causal effect (CACE) estimates that correct for this by estimating the effects among those who do enter the conversation are larger.
Experiment 1 Results
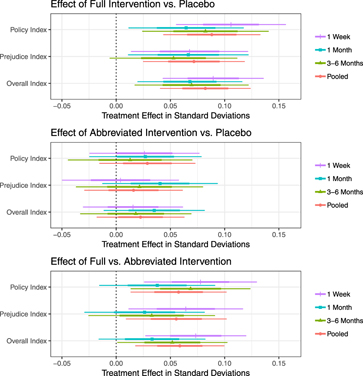
Figure 1 shows the results.
Experiment 1 Results: Intent-to-Treat Effects
Notes: Each panel shows the estimated intent-to-treat effects when comparing the two experimental conditions described in the panel title (e.g., the top panel compares the Full Intervention condition to the Placebo condition). Within each panel, we show treatment effects on the pre-specified primary outcome indices. Results are average treatment effects with 1 standard error (thick) and 95% confidence intervals (thin). To form each pooled index, we average each respondent's values for the corresponding index across all post-treatment survey waves. See Online Appendix Tables OA.9–11 for numerical point estimates and standard errors.

The first panel shows that the Full Intervention increased support for inclusive policies as measured in the surveys 1 week (d = 0.11, t = 4.12, p < 0.001), 1 month (d = 0.06, t = 2.39, p < 0.02), and 3–6 months after the intervention (d = 0.08, t = 2.78, p < 0.01). Averaging individuals’ responses at all three points in time, the pooled effect is also significant (d = 0.09, t = 3.89, p < 0.001).Footnote 10 Examining results on dichotomized versions of the individual items in the policy index,Footnote 11 the average share of inclusive policies individuals strongly supported increased from 29% in the Placebo condition to 33% in the Full Intervention condition (p < 0.01). For example, while the Abbreviated Intervention had no effect on individuals strongly supporting granting legal status to people who were brought to the United States illegally as children and who have graduated from a US high school, individuals assigned to the Full Intervention were 4.7 percentage points more likely to indicate strong support (p < 0.04). Likewise, when dichotomizing the policy items by whether individuals supported each policy at all, instead of expressing indifference or opposition, the share of policies individuals supported at all increased by 2.2 percentage points in the Full Intervention condition (p = 0.058). Note again that all these estimates are intent-to-treat estimates and that the compliance-adjusted estimates would be larger. See Online Appendix Tables OA.23–4 for additional results on the dichotomized individual policy items.
The Full Intervention also reduced prejudice toward unauthorized immigrants in the surveys 1 week (d = 0.07, t = 2.47, p < 0.02), 1 month (d = 0.07, t = 2.36, p < 0.02), and 3–6 months after the intervention (d = 0.05, t = 1.77, p < 0.08; pooled estimate d = 0.07, t = 3.02, p < 0.01).
The second panel of Figure 1 shows that the Abbreviated Intervention, which excluded the non-judgmental exchange of narratives, had effects indistinguishable from zero. This is consistent with the positive results of the Full Intervention not being driven by demand effects; the experimental design is capable of producing null results.
However, as the third panel in Figure 1 shows, we can statistically distinguish the effects of the Full from the Abbreviated intervention, the most direct test of the impact of the non-judgmental exchange of narratives. This indicates that including the non-judgmental exchange of narratives significantly increased the treatment effects. Those assigned to the Full instead of Abbreviated Intervention were significantly more supportive of inclusive policies in the surveys 1 week (d = 0.08, t = 2.95, p < 0.01), 1 month (d = 0.04, t = 1.40, p = 0.17), and 3–6 months after the intervention (d = 0.07, t = 2.45, p < 0.02). The pooled result is d = 0.06 (t = 2.57, p < 0.01). There are largely similar results for the prejudice index in the surveys 1 week (d = 0.06, t = 2.40, p < 0.02), 1 month (d = 0.03, t = 0.93, p = 0.36), and 3–6 months after the intervention (d = 0.03, t = 1.11, p = 0.27); averaging individuals’ responses at these three points in time, the average effect on the prejudice index is statistically significant (d = 0.05, t = 2.36, p < 0.02).
Online Appendix Tables OA.9–11 present the precise point estimates, standard errors, t-statistics, and p-values. Note that all these statistics use our pre-specified estimation approach of incorporating pre-treatment covariates to increase precision, which is central to the experimental design we employed (Broockman, Kalla, and Sekhon Reference Broockman, Kalla and Sekhon2017). Online Appendix Tables OA.9–11 also present results without covariates for transparency; as one would expect, without incorporating covariates, the standard errors are larger, as are the p-values.
There was little meaningful treatment effect heterogeneity by canvasser or voter attributes; the conversations were broadly persuasive regardless of which canvassers or voters were involved. Online Appendix Table OA.12 shows that the effects of the Full Intervention are similar regardless of whether the canvasser is an immigrant (d = 0.12, t = 2.20, p < 0.03) or is not an immigrant (d = 0.08, t = 3.12, p < 0.01). The clearly significant effects for non-immigrant canvassers mean the effects cannot be attributed to mere contact and that voters need not be prompted to take canvassers’ own perspective for the intervention to be effective. Table OA.16 also shows the Full Intervention was effective when implemented by both Latino and non-Latino canvassers. Tables OA.17–25 present additional heterogeneous treatment effect results, including by voter education, economic well-being, race, and partisanship. There are few clear patterns of heterogeneity, although there are clearly significant persuasive effects among both Republican and Independent voters. In the Online Appendix, we show that there is no evidence of differential attrition by condition (Tables OA.7 and OA.8) and that applying survey weights if anything increases the point estimates (Table OA.25).
To summarize, Experiment 1 has three important findings. First, interpersonal conversations that deployed the non-judgmental exchange of narratives reduced exclusionary attitudes toward unauthorized immigrants—a widely discussed, openly stigmatized group, attitudes toward whom have been deemed strong and resistant to change (Hopkins, Sides, and Citrin Reference Hopkins, Sides and Citrin2019). Second, these effects lasted for at least 4.5 months in a competitive political context (the immediate run-up to the 2018 US midterm elections) in which elites, including US President Donald Trump, expressed contrary policy arguments and open hostility toward the group; and these effects persisted even among self-identified Republicans. Third, we experimentally demonstrated that the non-judgmental exchange of narratives was primarily responsible for generating these effects, as removing it significantly reduces if not eliminates the effects of these conversations.
EXPERIMENT 2: PROBING BOUNDARY CONDITIONS WITH A DOOR-TO-DOOR CANVASS TARGETING TRANSPHOBIA
Experiment 2 targets exclusionary attitudes toward transgender people. As with policies toward unauthorized immigrants, policies toward transgender people have been increasingly salient in recent years, with US President Donald Trump issuing a Memorandum preventing transgender people from serving in the military and legislators in sixteen states introducing laws in 2017 requiring transgender people to use the bathroom of the sex they were assigned at birth (Kralik Reference Kralik2017).
Experiment 2 attempts to replicate our findings, explore potential boundary conditions, and assess a more scalable version of the non-judgmental exchange of narratives strategy. In particular, Experiment 2 includes a Video Narratives Only condition where canvassers showed voters a video narrative about a third party but did not supply their own narratives nor elicit individuals’ narratives. To share this video narrative, canvassers showed and discussed a video displayed on canvasser’s smartphones that depicts a transgender woman unknown to the canvassers and the participants describing a time when a restaurant manager attempted to force her to use the men’s restroom but other patrons intervened, allowing her to use the restroom of her choosing.Footnote 12
The Video Narratives Only condition in Experiment 2 allows us to test the generality of Experiment 1’s findings by testing whether non-judgmentally exchanging narratives can be effective when different narratives are used, which do not include the canvasser sharing their own narrative nor eliciting a narrative from the voter. Recall that the Full Intervention in Experiment 1 involved eliciting narratives from voters and canvassers sharing narratives about their own experiences with voters; but the Video Narratives Only condition in Experiment 2 does neither. This condition therefore allows us to test whether it is necessary to elicit narratives from voters or for canvassers to share their own narratives in order for narratives to persuade. Second, recall that in the Full Intervention in Experiment 1, canvassers also all shared narratives about immigrants they personally knew or, if the canvassers were immigrants, about themselves. Experiment 2’s Video Narratives Only condition probes whether hearing a narrative about an outgroup member from that outgroup member or someone who personally knows them may be required to produce these effects. Experiment 2’s Video Narratives Only condition does so by omitting narratives about outgroup members from conversation participants and only including the video narrative about a third party unknown to either the canvasser or the participant.
In addition to the Video Narratives Only condition, Experiment 2 also included a Participants’ and Video Narratives condition. The video narratives described above were also present in this condition. However, when individuals were assigned to the Participants’ and Video Narratives condition, canvassers also shared their own narratives and elicited narratives from voters about experiences with outgroup members and personal experiences of being treated differently, narratives we expected to further promote the salience of inclusionary values, perspective-taking, and analogic perspective-taking in particular. This condition allows us to benchmark the effects of the Video Narratives Only condition against a condition similar to the Full Intervention in Experiment 1. Table 1 again summarizes the conditions.
To measure the effects of these interventions, we again conducted a pre-registered randomized placebo-controlled experiment and parallel survey measurement. The experiment took place in 2016 in four areas: Atlanta, Georgia; Cleveland, Ohio; Jacksonville, Florida; and Scottsdale, Arizona. First, we recruited registered voters (n = 324,620) via mail for an ostensibly unrelated online baseline survey, presented as the first in a series of surveys. These surveys were broad university-sponsored surveys that included dozens of items unrelated to transphobia to disguise their connection with the upcoming intervention. We next randomly assigned respondents to this baseline survey (n = 8,456) to either the Participants’ and Video Narratives condition (n = 2,815), the Video Narratives Only condition (n = 2,817), or a Placebo condition receiving a brief conversation about banning plastic bags, an issue unrelated to transphobia (n = 2,824). Blocked random assignment was conducted at the household level (n = 3,485 households) such that participants within the same household were always assigned to the same experimental condition.
Next, canvassers affiliated with four partner non-profit organizationsFootnote 13 visited individuals’ homes at their addresses in the voter registration database. When study participants were assigned to the Participants’ and Video Narratives condition, the intervention proceeded similarly to as described above. The scripts are available in the Online Appendix. As described above, in the Video Narratives Only condition, canvassers continued discussing the narratives non-judgmentally, but did not provide their own narratives or ask for voters’ narratives, instead only showing and discussing the narrative of the third party in a video. Consistent with the canvassers successfully implementing this change, in conversations that successfully began, records the canvassers made after each conversation indicate that voters and canvassers ultimately shared their own stories 69% and 85% of the time, respectively, when voters were assigned to the Participants’ and Video Narratives condition. These figures are only 12% and 19% when voters were assigned to the Video Narratives Only condition. On average, individuals who identified themselves at the door in the Participant and Video Narratives condition conversed for 10.5 minutes on average; this figure is 7.7 minutes in the Video Narratives Only condition. 37% of conversations were conducted by canvassers who identify as transgender.
Canvassers successfully reached 1,858 individuals at their doors across the three conditions. We recruited individuals who were reached to follow-up surveys that began one week (n = 1,044) and one month (n = 989) after the conversations. We monitored survey responses and debriefed canvassers to see whether participants had any suspicions that the canvass intervention was related to the surveys and found none.
The intervention sought to reduce transphobia along two pre-registered dimensions: increasing support for more inclusionary government policies (e.g., support for “a law in your state that would protect gay and transgender people from discrimination in employment, housing, and public accommodations”) and decreasing prejudice toward transgender people (e.g., “I would support a friend choosing to have a sex change”). Each survey included 9 items measuring support for policies related to transgender people and 6 items capturing anti-transgender prejudice. As we pre-registered, we combine these two groups of items into two indices, a policy index and a prejudice index, as well as a third index containing all 15 items.
The Online Appendix includes further recruitment, design, survey, and estimation details, tests of design assumptions (such as the proper implementation of the placebo, balance checks, and checks for differential attrition; see Online Appendix Tables OA.28–31, OA.36–7), representativeness assessments (Table OA.26), and estimates with survey weights, which are typically slightly larger (Table OA.50).
Experiment 2 Results
Figure 2 shows the results. The first panel shows that the Participants’ and Video Narratives condition successfully increased support for inclusive policies as measured in the surveys 1 week (d = 0.09, t = 2.66, p < 0.01) and 1 month (d = 0.07, t = 2.22, p < 0.03) after the intervention (pooled effect d = 0.07, t = 2.52, p < 0.02). It also reduced prejudice toward transgender people in the surveys 1 week (d = 0.09, t = 3.31, p < 0.001) and 1 month (d = 0.09, t = 3.01, p < 0.001) after the intervention (pooled effect d = 0.08, t = 3.34, p < 0.001).
Experiment 2 Results: Intent-to-Treat Effects
Notes: Each panel shows the estimated treatment effects when comparing the two experimental conditions described in the panel title (e.g., the top panel compares the Participants’ and Video Narratives condition to the Placebo condition). Within each panel, we show treatment effects on the pre-specified primary outcome indices. Results are average treatment effects with 1 standard error (thick) and 95% confidence intervals (thin). To form each pooled index, we average each respondent’s values for the corresponding index across all post-treatment survey waves. See Online Appendix Tables OA.40–42 for numerical point estimates and standard errors.
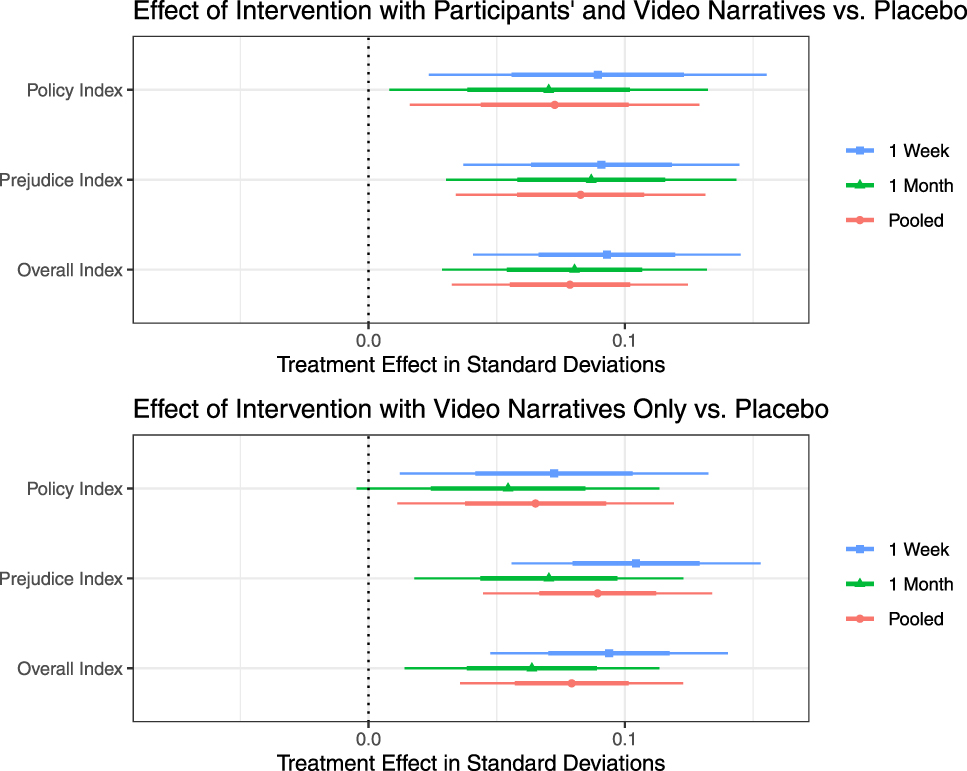
However, the Video Narratives Only condition that involved the non-judgmental exchange of narratives shown in videos but did not include participants’ own narratives was also effective. In particular, the Video Narratives Only intervention also successfully increased support for inclusive policies as measured in the surveys 1 week (d = 0.07, t = 2.36, p < 0.02) and 1 month (d = 0.05, t = 1.81, p < 0.07; pooled effect d = 0.07, t = 2.37, p < 0.02). The Video Narratives Only intervention also reduced prejudice toward transgender people in the surveys 1 week (d = 0.10, t = 4.21, p < 0.001) and 1 month (d = 0.07, t = 2.63, p < 0.01) after the intervention (pooled effect d = 0.09, t = 3.93, p < 0.001). Online Appendix Tables OA.40–42 present the precise point estimates, standard errors, t-statistics, and p-values. (All differences between the two treatment conditions in Experiment 2 were insignificant. Online Appendix Tables OA.40–42 report the point estimates and standard errors on this difference; although we can be confident that both treatment conditions had effects, the standard error on the differences in their effects is large, meaning we also cannot rule out the possibility of meaningful differences between the conditions.) Note that all these statistics use our pre-specified estimation approach of incorporating pre-treatment covariates to increase precision. Online Appendix Tables OA.40–42 also present results without covariates; without incorporating covariates, the standard errors are larger, as are the p-values.
One sign that new attitudes are strong is that they endure over time; another is that they resist attack (Petty, Haugtvedt, and Smith Reference Petty, Haugtvedt, Smith, Petty and Krosnick1995). In Experiment 1, we found durable persuasive effects despite the presence of contrary elite messages from US President Donald Trump during the 2018 midterm elections. In Experiment 2, lacking such a naturally occurring context, we provided contrary messages in our survey. In particular, we showed an opposing advertisement mid-way through the post-treatment surveys and pre-registered that we would separately analyze indices of items asked before and after the opposing video was shown. (This video was shown to all participants in both the treatment and control groups.) Consistent with these new attitudes formed from the canvassing treatment being strong, we find that the treatment effects are essentially identical on the index of items asked after individuals were shown the opposition advertisement (see Online Appendix Tables OA.43–4). This is also propitious for the external validity for our results to a competitive political context.
In Table OA.52, we show that the canvassing treatments had effects regardless of whether delivered by transgender or cisgender canvassers; and in Table OA.56, we show consistent results across participants’ partisan identifications. Additional subgroup analyses are presented in Tables OA.53–55. Tables OA.59–60 also show results on the dichotomized policy items, which are broadly consistent with both creating new supporters and strengthening support.
However, as shown in Table 1, we also note that the two interventions reported here were around one-half as effective as that reported in Broockman and Kalla (Reference Broockman and Kalla2016). We pre-registered an expectation that this was a less favorable implementation context than in Broockman and Kalla (Reference Broockman and Kalla2016) given that the partner organizations had less prior experience implementing longer canvassing interactions, which could explain this smaller treatment effect.
In summary, Experiments 1 and 2 find that non-judgmentally exchanging narratives present in a video (Experiment 2) and narratives from participants in the conversation (Experiment 1, where no video was present) are both able to durably reduce exclusionary attitudes.
EXPERIMENT 3: PROBING SCALABILITY WITH PHONE CONVERSATIONS TARGETING TRANSPHOBIA
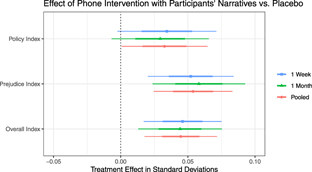
Our third field experiment administered a version of the intervention in which individuals non-judgmentally exchanged narratives over the phone. Canvassers could not show voters videos over the phone; therefore, similar to the Full Intervention condition in Experiment 1, the intervention only included canvasser- and voter-supplied narratives (again, see Table 1 for summary). The prompts used to elicit canvasser- and voter-supplied narratives in Experiment 3 were the same as those used in Experiment 2 (narratives about experiences with outgroup members and about personal experiences of being treated differently). Experiment 3 therefore both further replicates the finding from Experiment 1 that a conversation including only participants’ narratives (and no video narratives) can have durable effects and shows they generalize to the less personal, more easily scalable context of a telephone conversation. These narratives were intended to promote the salience of inclusionary values, perspective-taking, and especially analogic perspective-taking, which Experiment 2 found was not necessary for persuasion but could nevertheless still have persuasive effects.
This experiment took place in the same four areas as Experiment 2, among individuals who either lived outside of the canvass area or whose household members were never reached during the canvass phase (e.g., no one was home when a canvasser knocked). We randomized these participants to a treatment group targeted with the Participants’ Narratives by Phone condition (n = 6,879) or a Placebo condition receiving a brief telephone call unrelated to transphobia (n = 6,888). Random assignment was conducted at the household level (n = 12,081 households) such that participants within the same household always received the same experimental condition. Next, canvassers called individuals on the phone and administered either the Placebo or the Participants’ Narratives by Phone condition. Canvassers successfully reached 2,637 individuals. Individuals in the Participants’ Narratives by Phone condition who were reached on the phone conversed for 6.6 minutes on average. We recruited individuals who were reached to follow-up surveys that began one week (n = 1,943) and one month (n = 1,897) after the conversations. These follow-up surveys asked the same questions as in Experiment 2, and we formed the same policy and prejudice indices in the same manner.
The Online Appendix includes further recruitment, design, survey, and estimation details, tests of design assumptions (such as the proper implementation of the placebo, balance checks, and checks for differential attrition; see Tables OA.32–35, 37, and 39), representativeness assessments (Table OA.27), and estimates with survey weights, which are similarly sized (Table OA.51).
Experiment 3 Results
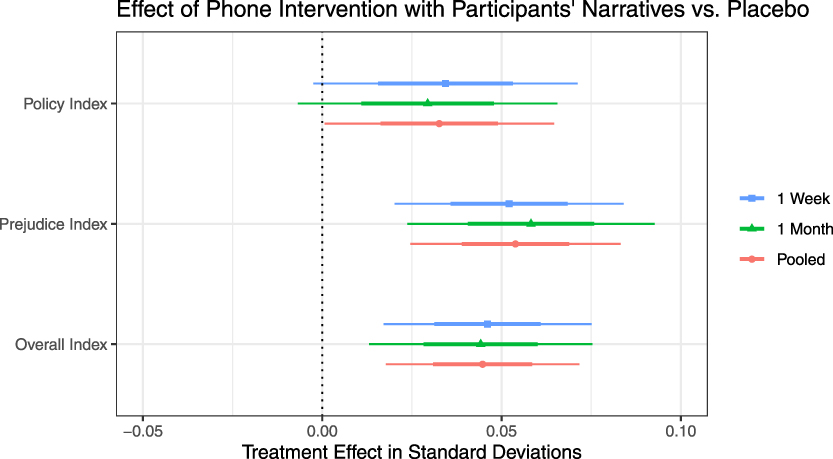
Figure 3 shows the results. The Participants’ Narratives by Phone intervention reduced prejudice toward transgender people in the surveys 1 week (d = 0.05, t = 3.20, p < 0.001) and 1 month (d = 0.06, t = 3.31, p < 0.001) after the intervention (pooled effect d = 0.05, t = 3.60, p < 0.001). The intervention also likely increased support for inclusive policies after the intervention; although the effects measured in the 1 week (d = 0.03, t = 1.83, p < 0.07) and 1 month (d = 0.03, t = 1.59, p = 0.11) surveys do themselves not reach statistical significance, the pooled effect on policy attitudes averaging the two surveys does (d = 0.03, t = 2.00, p < 0.05). Online Appendix Tables OA.45–8 present the precise point estimates, standard errors, t-statistics, and p-values. Note that all these statistics use our pre-specified estimation approach of incorporating pre-treatment covariates to increase precision. Online Appendix Tables OA.45–8 also present results without covariates for transparency; without incorporating covariates, the standard errors are larger, as are the p-values.
Experiment 3 Results: Intent-to-Treat Effects
Notes: This figure shows the estimated treatment effects when comparing the Phone Intervention with Participants’ Narratives condition to the Placebo condition. We show treatment effects on the pre-specified primary outcome indices. Results are average treatment effects with 1 standard error (thick) and 95% confidence intervals (thin). To form each pooled index, we average each respondent’s values for the corresponding index across all post-treatment survey waves. See Online Appendix Tables OA45–47 for numerical point estimates and standard errors.
As in Experiment 2, we also again see that the new attitudes the intervention formed are resistant to attack, as the results are similar on an index of items asked after individuals were shown an opposition advertisement (see Online Appendix Tables OA.48–9). In Tables OA.57–8, we show that the intervention was broadly effective across participants’ partisan identifications and levels of political knowledge. Tables OA.61–2 also show results on the dichotomized policy items.
DISCUSSION
Prejudice toward outgroups and opposition to the policies that promote their well-being have contributed to social and political challenges worldwide. Individuals and organizations that wish to reduce these exclusionary attitudes, be they individuals speaking with acquaintances or political campaigns seeking to change voter opinion, have few proven strategies available to them to productively engage those who disagree with them on these topics. If they do engage, social norms may also encourage individuals to engage in strategies such as condemnation and argumentation that may in fact be counter-productive (Itzchakov, Kluger, and Castro Reference Itzchakov, Kluger and Castro2017) and lead individuals to believe others do not respect them (Cramer Reference Cramer2012, Reference Cramer2016). Meanwhile, existing strategies largely have effects that rapidly decay or require sustained intervention over months or years (Lai et al. Reference Lai, Nosek, Sartori, Shin, Marini and Rubichi2016; Paluck and Green Reference Paluck and Green2009b).
Our results—which focus on two highly stigmatized groups and divisive political issues—indicate that individuals and organizations can durably reduce exclusionary attitudes in these interpersonal conversations by non-judgmentally exchanging narratives. Our evidence shows that this strategy can be effective across varied contexts: These interventions were successfully deployed to complete strangers in the general population across seven sites by seven different organizations; we found effects when administering this strategy on an extremely salient issue in the midst of many contrary elite messages (for Experiment 1, immigration during the 2018 US midterm elections; and in Experiments 2 and 3, from an opposing advertisement shown in the survey); we found them regardless of whether narratives were shared through the mediums of in-person conversation (Experiments 1 and 2), phone conversation (Experiment 3), or video (Experiment 2); and from narratives of different types, including when participants exchanged personal narratives (Experiments 1, 2, and 3) and when canvassers shared a narrative from a third party (Experiment 2). Our findings therefore suggest optimism that individuals seeking to reduce exclusionary attitudes may be able to productively employ this strategy in everyday interpersonal conversations.
The contexts in which these experiments took place also suggest optimism for efforts by individuals and organizations to implement the non-judgmental exchange of narratives at scale: None of the seven organizations we worked with had previously implemented such an intervention, nor had the canvassers had any such prior experience. Previous research has found smaller treatment effects of other interventions when they are implemented at larger scale and by new partner organizations (Allcott Reference Allcott2015; Grossman, Humphreys, and Sacramone-Lutz Reference Grossman, Humphreys and Sacramone-Lutz2019), consistent with the smaller effects we found in this study than in Broockman and Kalla (Reference Broockman and Kalla2016), as shown in Table 1.Footnote 14 While future research should continue to test potential boundary conditions on these effects, our findings already suggest optimism for other practitioners seeking to implement our findings. The fact that the canvassers themselves had no prior experience also underscores the normative benefits of deliberations between citizens (Druckman Reference Druckman2004a; Druckman and Nelson Reference Druckman and Nelson2003; Landemore Reference Landemore2013) and suggests that Americans may be able to adopt this strategy in their deliberations with others.
At the same time, we do not wish to overstate the substantive size of the effects we estimated. On the one hand, some may see these effects as relatively sizable given the null effects of many other door-to-door persuasion programs (Kalla and Broockman Reference Kalla and Broockman2018) and the difficulty of changing attitudes, at least on immigration, in many survey-based experiments (Hopkins, Sides, and Citrin [Reference Hopkins, Sides and Citrin2019]; although see effects even larger than those observed here in Simonovits, Kezdi, and Kardos [Reference Simonovits, Kezdi and Kardos2018]). On the other hand, many social psychologists would traditionally consider effect sizes of the sizes we observed (intent-to-treat effects of d = 0.08 in Experiments 1 and 2 and d = 0.04 in Experiment 3) small. Moreover, given the size of the effects we observe, a campaign implementing this approach should expect that a very large number of such conversations would be needed to produce detectable changes in aggregate public opinion or changes in electoral outcomes. At the same time, a campaign looking for strategies to change aggregate public opinion may have no choice but to pursue strategies with small effects; few if any other campaign tactics have been rigorously shown to have lasting meaningful effects in the field on public opinion.
Another important limitation of this work, as with many experiments, is that we were unable to test all the specific mechanisms that might produce the reduction in exclusionary attitudes that we observe. For example, it is difficult to control what processes individuals engage in (e.g., perspective-taking, activation of inclusionary values, or other emotional processes) when supplying their own narratives outside a laboratory setting. Although we detailed our theoretical reasoning and were able to support this reasoning by testing modified treatments where our argument predicts effects should diminish, further tests of these mechanisms could be taken up by future studies.
However, our findings nevertheless are notable for pinpointing a strategy that is important to generate the effects we observed. Most importantly, in Experiment 1, removing the non-judgmental exchange of narratives significantly reduced if not eliminated the effectiveness of the intervention, supporting our argument that this strategy facilitates the reduction of exclusionary attitudes. We also conceptually replicated these findings using different forms of narratives in the context of conversations that took place through different modes in Experiments 2 and 3. The results of all three experiments also are inconsistent with the alternative explanations that the physical presence of outgroups are necessary or sufficient for the effects we observed.
With this said, future work should continue to refine these interventions and our understanding of why they work. Five areas seem especially important. First, future work should explore how to apply the non-judgmental exchange of narratives in mass media (Paluck Reference Paluck2009, Reference Paluck2010), where limiting defensive reactions through non-judgmental listening may prove more difficult but narratives may still be effective. Second, it is an open question whether this strategy would be effective when targeting attitudes on other topics where personal narratives may be more difficult to share and elicit (e.g., climate change). Third, our theoretical argument is agnostic to the type of narratives shared. Although we showed that the effects we observed are not particular to any one type of narrative, future research should seek to better understand which narrative strategies are most effective for different types of issues, voters, and contexts; no doubt some narratives would fail to persuade on some topics (e.g., as occurred in an experiment on door-to-door canvassing on abortion, reported in Broockman, Kalla, and Sekhon [Reference Broockman, Kalla and Sekhon2017], Section 6). Fourth, what consequences would result if both sides of an issue engaged in this strategy, especially in a traditional partisan campaign? Although any competing efforts to change policy attitudes may cancel out, such efforts may still increase tolerance for those who share opposing viewpoints (Bruneau and Saxe Reference Bruneau and Saxe2012; Mutz Reference Mutz2002). Finally, it would also be valuable to test what if any behavioral consequences such conversations have, such as on actual voting behavior or prejudiced behaviors (Enos Reference Enos2016; Sands Reference Sands2017), as well as any potential effects on implicit, as opposed to explicit, attitudes (Lai et al. Reference Lai, Nosek, Sartori, Shin, Marini and Rubichi2016).
Our results also suggest a possible tension between strategies for reducing exclusionary attitudes at the individual level and strategies for reducing their behavioral consequences at a societal level. Previous field experiments find that promulgating norms that discourage exclusionary behaviors—i.e., signaling that exclusionary behaviors will be judged negatively by others—can effectively reduce the consequences of intergroup prejudice, even though this does not reduce exclusionary attitudes themselves (Paluck Reference Paluck2009). However, our work joins others in suggesting that signaling individuals will not be judged negatively for expressing exclusionary attitudes may facilitate their openness to changing these attitudes (Itzchakov, Kluger, and Castro Reference Itzchakov, Kluger and Castro2017). Efforts to promote a culture where individuals expect social opprobrium for engaging in exclusionary behavior may therefore need to balance the value of creating conditions in which individuals do not feel threatened by discussing their attitudes and experiences with those who wish to persuade them.
SUPPLEMENTARY MATERIAL
To view supplementary material for this article, please visit https://doi.org/10.1017/S0003055419000923.
Replication materials can be found on Dataverse at: https://doi.org/10.7910/DVN/8BFYQO.





Comments
No Comments have been published for this article.