
I. INTRODUCTION
Despite Ti–Ni shape memory alloys (SMAs) likely being the most studied SMAs, Reference Otsuka and Wayman1 the origins of the intriguing martensitic transformation (MT) behaviors that appear in their Ni-rich portion remain under discussion. Regarding the thermal MT from the B2-parent phase to the B19′-martensite phase, which is herein called B2/B19′ MT, it has been reported that the B2/B19′ MT starting temperature (T Ms) decreases with increasing Ni content and suddenly disappears at approximately Ti–51.4 Ni (at.%). Reference Zhang, Wang, Wang, Zhou, Otsuka and Ren2 Some anomalous properties associated with this behavior, such as a frequency-dependent storage modulus Reference Sarkar, Ren and Otsuka3 and history-dependent (non-ergodic) strain, Reference Wang, Ren, Otsuka and Saxena4 have been observed and explained by the concept named “strain glass”. Reference Sarkar, Ren and Otsuka3
Very recently, using the conversion of intensive variables from stress (σ) to composition (x) in the Clausius–Clapeyron relation, the present authors revealed that the sudden drop of T Ms with increasing Ni composition originates from the decrease in the entropy change ΔS B2–B19′ (= S B2 − S B19′ where S B2 and S B19′ mean the entropy of the B2 and B19′ phases, respectively) with decreasing temperature. Reference Niitsu, Kimura, Xu and Kainuma5 This conversion also suggested that the isothermal nature of the B2/B19′ MTs Reference Fukuda, Yoshida and Kakeshita6,Reference Ji, Wang, Ding, Otsuka and Ren7 should arise in relation to the dramatic increase in the transformation stress hysteresis (σhys), as confirmed by the superelastic behaviors at low temperatures for Ti–51.8 Ni. Reference Niitsu, Omori and Kainuma8
In the Ni-rich Ti–Ni section, another kind of MT, known as the R-phase (B2/R) transformation, has to be considered to take place as well as the B2/B19′ MT. The B2/R transformation is typically observed in Ti–Ni alloys annealed at low temperatures Reference Hara, Ohba, Okunishi and Otsuka9 but is believed not to take place in quenched alloys. However, Ji et al. recently reported that the B2/R transformation can be introduced by isothermal holding just above the B2/B19′ MT equilibrium temperature (T 0) in a quenched Ti–51.3 Ni alloy, Reference Ji, Wang, Ding, Otsuka and Ren7 near the composition at which T Ms suddenly drops.
In relation to the B2/R transformation, its precursor phenomenon in the B2 phase, which is so far reported in Fe,Co,Cu-doped Ti–Ni ternary systems,
Reference Choi, Fukuda, Kakeshita and Mori10–Reference Kakeshita, Fukuda, Tetsukawa, Saburi, Kindo, Takeuchi, Honda, Endo, Taniguchi and Miyako13
should also be addressed. In the B2 phase facing to the B2/R transformation, a short-range atomic modulation with a very fine domain-like microstructure appears because of the [110]
 $\left[ {1\bar 10} \right]$
-type transverse atomic displacements, which is accompanied by diffuse scatterings near the {1/3 1/3 0} positions in reciprocal space.
Reference Murakami and Shindo14
The commensurability of the diffuse reflections is known to increase upon cooling; the temperature at which the position of the diffuse reflections reaches the exact position of {1/3 1/3 0} is called the commensurate–incommensurate (C–IC) transition temperature T
C–IC (or the lock-in temperature), and this transition is believed to be of second-order nature.
Reference Choi, Fukuda, Kakeshita and Mori10
Considering the strong similarities of the transformation behaviors among the Ti–Ni binary and Fe,Co,Cu-doped Ti–Ni ternary systems, Reference Choi, Fukuda, Kakeshita and Mori10–Reference Kakeshita, Fukuda, Tetsukawa, Saburi, Kindo, Takeuchi, Honda, Endo, Taniguchi and Miyako13 the possibilities of the B2/R transformation and the precursor phenomenon in the B2 phase are worth considering toward essential understandings of the phase equilibrium in the Ti–Ni binary system. However, a possible interplay between the R-phase and the precursor state has hardly been claimed in spite of their similar lattice modulation trends. We now consider that they are thermodynamically or kinetically cross-correlated to each other, which makes the phase equilibrium in the Ni-rich Ti–Ni portion much more complicate. Knowing the entropy (S) of each phase and their changes (ΔS) during the phase transformations at various temperatures for various alloy compositions is critical to understanding the phase equilibrium and the origins of the phase transformation behaviors. In this study, the mechanical and thermodynamic properties were investigated for Ni-rich Ti–Ni alloys with various compositions, and S and ΔS were evaluated based on the overall experimental results. The relative phase stabilities among the observed phases were also discussed.
II. EXPERIMENTAL PROCEDURE
Ti–(50 + x) at.% Ni alloys for x = 0.92, 1.30, 1.54, 1.63, and 1.89 were prepared by arc melting under an argon atmosphere. The obtained buttons were homogenized at 1173 K for 30 h followed by water quenching. The values of x represent the alloy compositions analyzed by an electron probe microanalyzer (JXA-8100, JEOL Ltd., Akishima, Japan) for the homogenized samples. Cuboidal specimens with sides of several millimeters were cut out and used as compression test specimens. The compression tests were performed at various temperatures in the range of 7–300 K under the same conditions as the precedent work for x = 1.8 (1.75 in analytical x) Reference Niitsu, Omori and Kainuma8 with a temperature-variable testing machine (Instron Co. Ltd., Massachusetts, USA). The caloric properties were investigated using a physical property measurement system (PPMS; Quantum Design, Inc., San Diego, California), a differential scanning calorimeter (DSC; Erich Netzsch GmbH & Co., Selb, Germany), and a high-resolution differential scanning calorimeter (h-DSC; Erich Netzsch GmbH & Co., Selb, Germany). The sweeping rate for the DSC and h-DSC measurements was set to 10 K/min. In situ transmission electron microscopy (TEM; HF-3300S, Hitachi High-Technologies, Tokyo, Japan) observations were performed on a thin-foil specimen of x = 0.92, which was fabricated using a jet-polishing machine (TenuPol-5, Struers Ltd., Rotherham, United Kingdom).
In this article, ΔS during the B2/B19′ MT derived from the DSC results, the specific heat (c P), and the superelastic properties are represented as ΔS DSC B2–B19′, ΔS cp B2–B19′, and ΔS SE B2–B19′, respectively. ΔS DSC B2–B19′ was directly derived from the integral of the h-DSC peak corresponding to the reverse B2/B19′ MT, with the latent heat Q and peak temperature T P using the following expression:
 $$\Delta {S_{{\rm{DSC}}}}^{{\rm{B}}2 - {\rm{B}}19'} = {Q \mathord{\left/ {\vphantom {Q {{T_{\rm{P}}}}}} \right. \kern-\nulldelimiterspace} {{T_{\rm{P}}}}}\quad .$$
ΔS cp B2–B19′ is the difference between S of the B2-parent (S cp B2) and B19′-martensite (S cp B19′) phases, where S cp i as a function of temperature can be obtained with the temperature function of specific heat of the i phase, c P i (T):
 $${S_{{\rm{cp}}}}^i\left( T \right) = \int_0^T {\left( {{{{c_{\rm{P}}}^i\left( T \right)} \mathord{\left/ {\vphantom {{{c_{\rm{P}}}^i\left( T \right)} T}} \right. \kern-\nulldelimiterspace} T}} \right){\rm{d}}T\quad .}$$
ΔS SE B2–B19′ was indirectly determined from the temperature dependence of the equilibrium stress, σ0, using the Clausius–Clapeyron equation:
 $${{{\rm{d}}{\sigma _0}} \over {{\rm{d}}T}} = {{\Delta {S_{{\rm{SE}}}}^{{\rm{B}}2 - {\rm{B}}19'}} \over {{\varepsilon _{{\rm{SE}}}} \cdot {V_{\rm{m}}}}}\quad .$$
Here, the molar volume V m = 8.25 × 10⁻⁶ m3/mol Reference Niitsu, Omori and Kainuma8 and the experimentally obtained full transformation strain εSE = 0.049 (not shown here), which was very close to the phenomenologically estimated value of 0.044, Reference Niitsu, Kimura, Xu and Kainuma5 were utilized.
III. RESULTS AND DISCUSSION
A. Compressive stress–strain curves
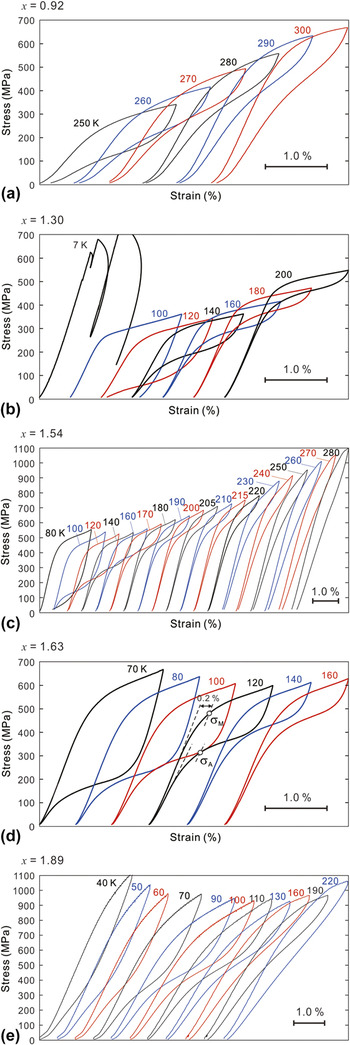
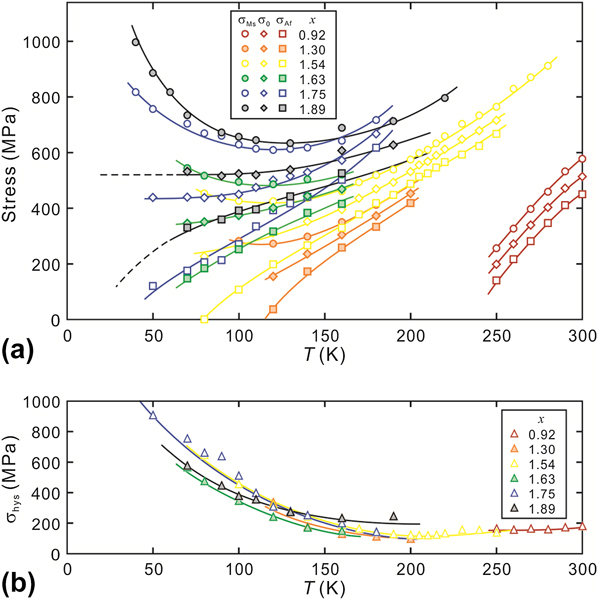
Figure 1 presents the σ–ε curves at the initial stage of superelasticity (SE) at various temperatures for various x values. The stress-induced forward/reverse transformation starting/finishing stresses, σMs and σAf, respectively, were difficult to define using the former definition Reference Niitsu, Omori and Kainuma8 for some of the σ–ε curves, especially for large x alloys, because of the irreversible behavior in the elastic deformation region. Instead, we herein defined σM and σA as the 0.2% proof stresses for the loading and unloading curves, respectively, as shown in Fig. 1(d). The values determined for the present alloys and for x = 1.75 in the previous paper Reference Niitsu, Omori and Kainuma8 are plotted in Fig. 2(a) as a function of temperature together with their σ0 values, which were approximated as the average of σM and σA. Overall, the curve for σM was concave, and σA and σ0 decreased with decreasing temperature. The gradient of σ0 gradually approached zero as temperature decreases. Similar behavior was reported for various types of MTs induced not only by one-dimensional stress Reference Kimura, Xu, Niitsu, Omori and Kainuma12,Reference Niitsu15–Reference Xu, Ito, Umetsu, Kainuma and Ishida17 but also by applying magnetic fields. Reference Ito, Ito, Umetsu, Kainuma, Koyama, Watanabe, Fujita, Oikawa, Ishida and Kanomata18 The temperature dependence of σ0 allows us to see ΔS SE B2–B19′ by Eq. (3). Further discussions on σ0 will be provided in terms of ΔS in Sec. III.F.
Stress–strain curves obtained by compression tests at various temperatures ranging from 7 to 300 K for polycrystalline Ti–(50 + x)Ni alloys for x = (a) 0.92, (b) 1.30, (c) 1.54, (d) 1.63, and (e) 1.89.

Temperature dependences of (a) σM, σA, and σ0 and (b) σhys for x = 0.92, 1.30, 1.54, 1.63, 1.75, Reference Niitsu, Omori and Kainuma8 and 1.89.
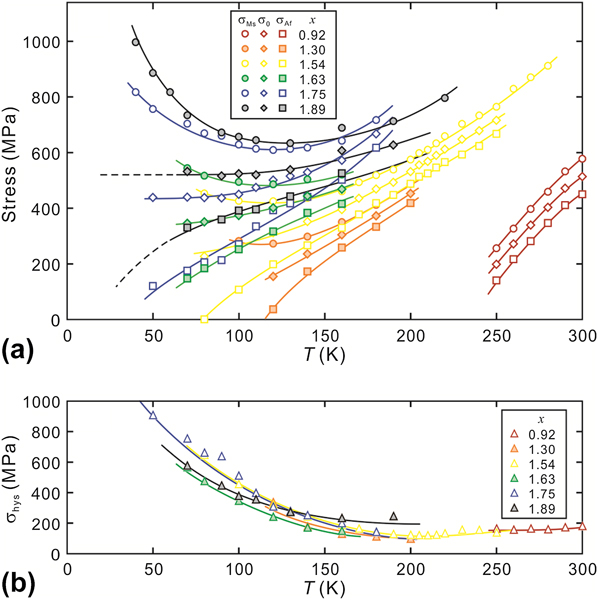
The transformation stress hysteresis, σhys (≡ σM − σA), is plotted as a function of temperature in Fig. 2(b). σhys starts to drastically increase with decreasing temperature from approximately 150 K. This behavior is considered to be caused by a type of thermal activation process in the migration of B2/B19′ phase boundaries during stress-induced B2/B19′ MT, as discussed in our previous works. Reference Niitsu, Omori and Kainuma8,Reference Niitsu15,Reference Niitsu, Xu, Umetsu and Kainuma16 In addition, it is important to note that all the σhys curves are almost coincident, which suggests the insensitivity of the thermal activation process to the alloy composition.
In the σ–ε curve at 7 K for x = 1.30, a serrated flow of SE was observed. Such behavior has also been confirmed in Ni–Co–Mn–In at 4.2 and 7 K. Reference Niitsu, Xu, Umetsu and Kainuma16 The origin of this phenomenon may be explained in analogous to a serrated flow in plastic deformation, which is also observed in the cryogenic region; at cryogenic temperatures, a release of dissipated energy locally and adiabatically heats the moving habit plane itself because of extremely small specific heat and thermal conductivity, whereby the motion of habit planes occurs discontinuously. Such a phenomenon is supposed to be typical in the alloy systems showing a dramatic increase in σhys upon cooling.
B. DSC measurements
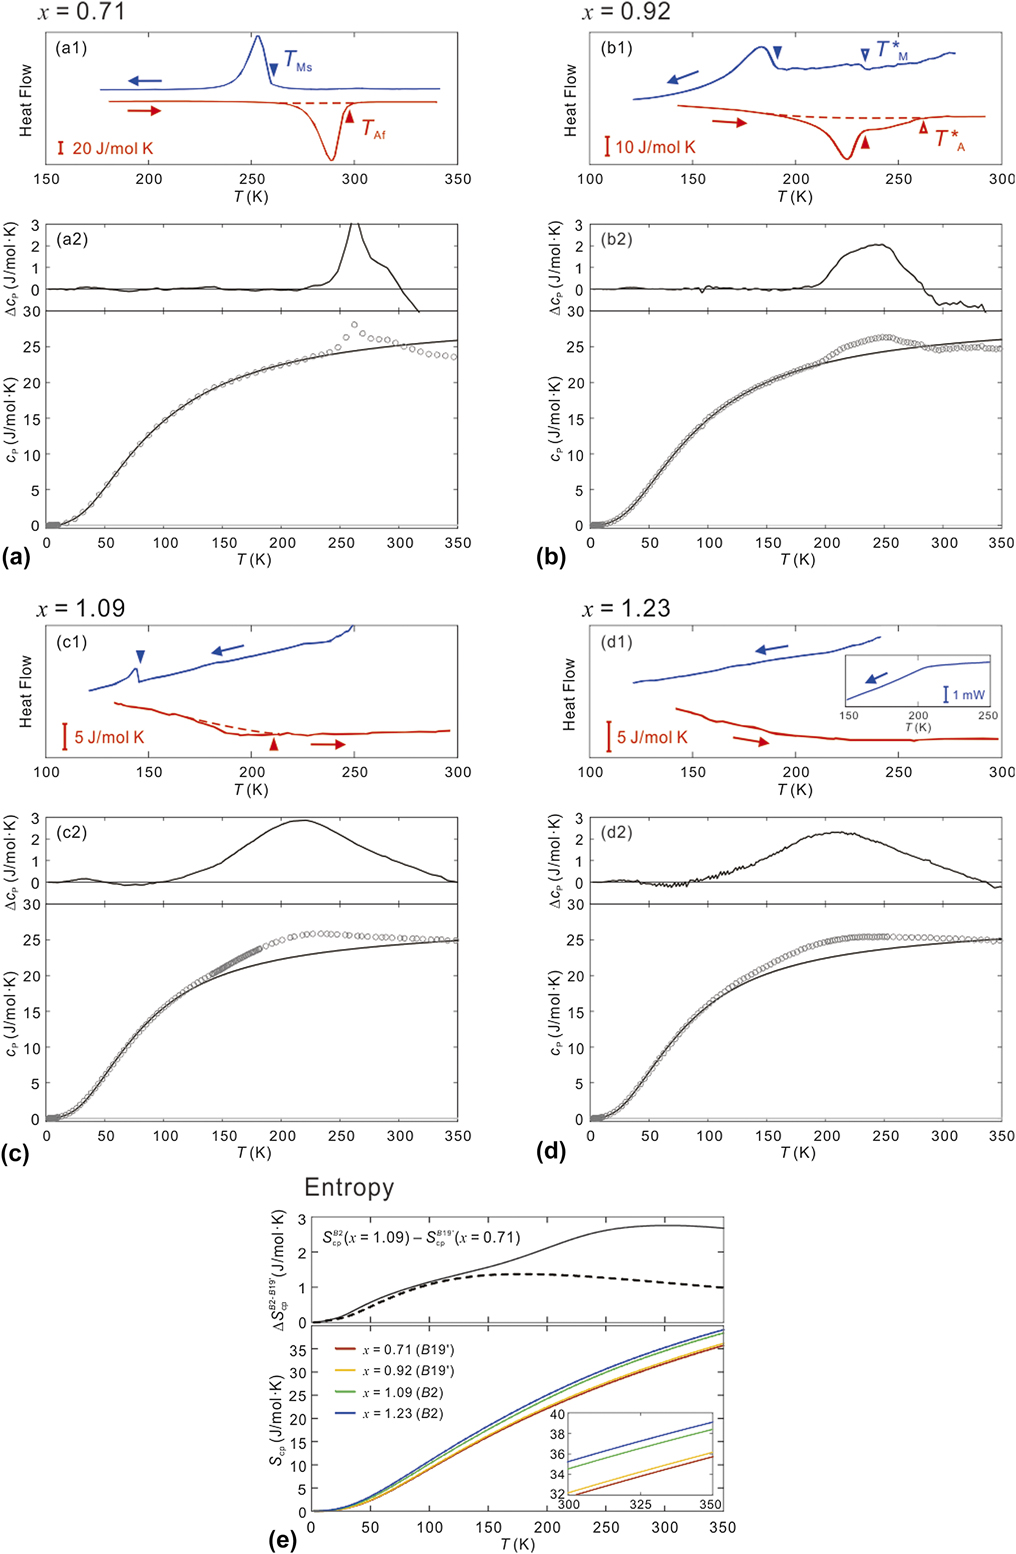
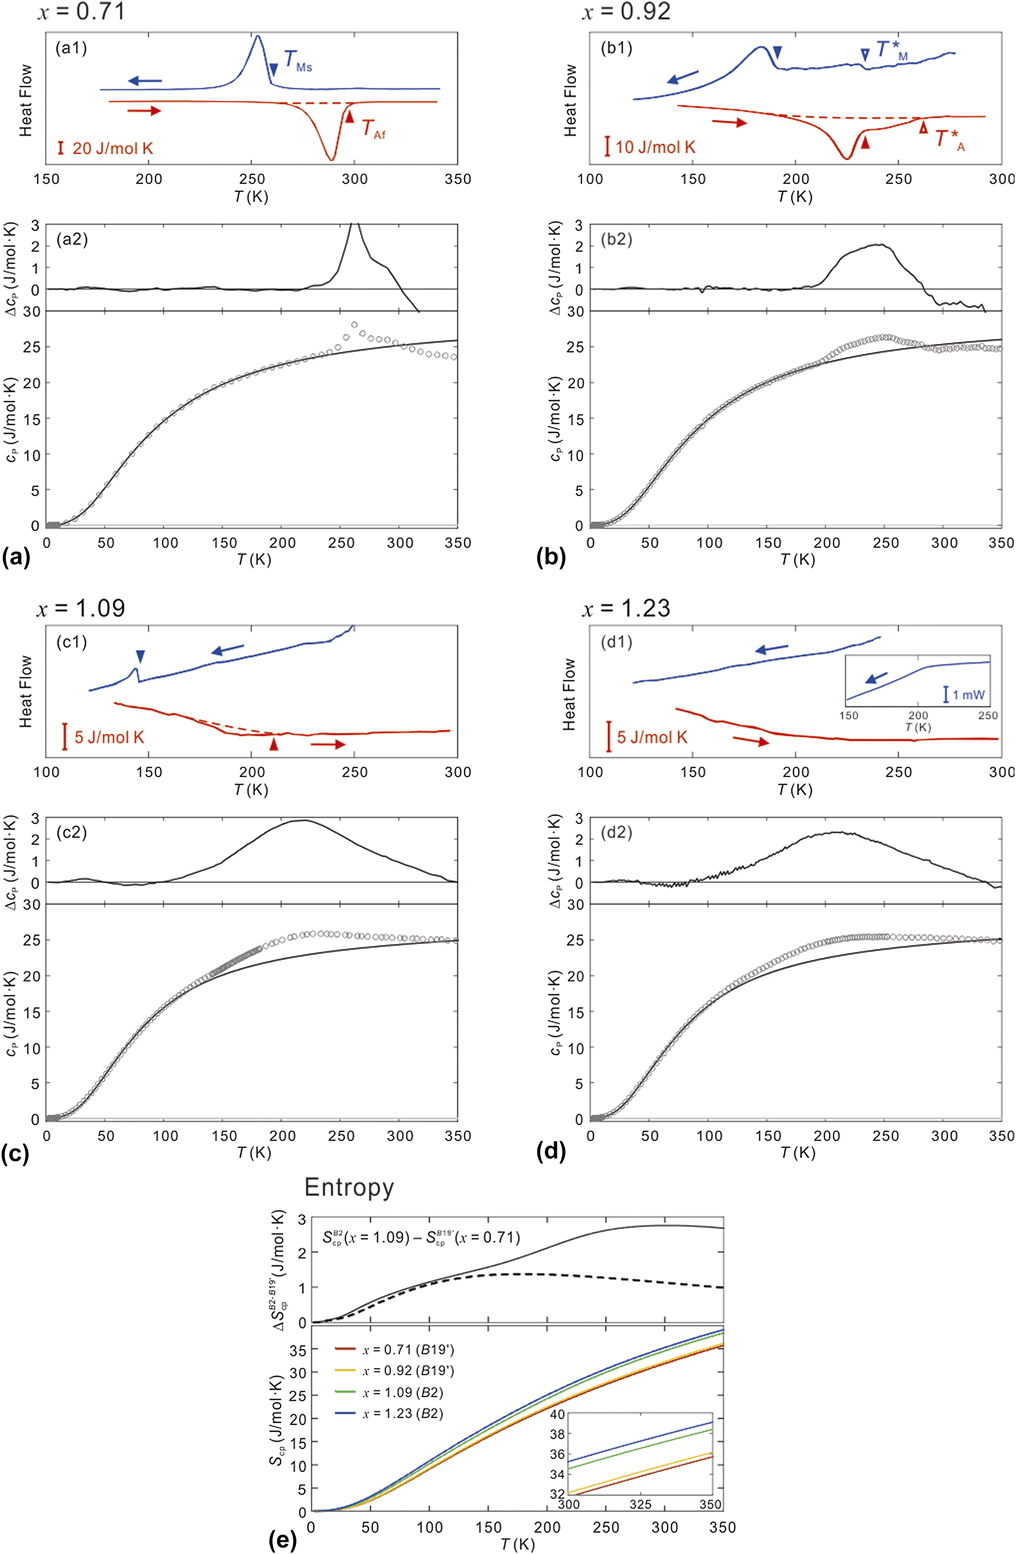
Figures 3(a1)–3(d1) present the h-DSC measurements for the alloys for various x values. For x = 0.71, exothermic and endothermic peaks attributed to the forward and reverse B2/B19′ MTs, respectively, were clearly observed, where T Ms and T Af (the B2/B19′ reverse MT finishing temperature) were designated by filled triangles. For x = 0.92, however, the intensities of these peaks were significantly suppressed and consecutive tails widely arose at the onsets of the high-temperature sides, high-temperature terminals of which were represented as T*M and T*A (open triangles). Furthermore, a very small peak is observed for x = 1.09, and no peaks are present for x = 1.23.
(a1)–(d1) h-DSC measurements for cooling (blue) and heating (red). Only the heating curves (red lines) were calibrated with respect to their baselines; therefore, the inserted scale bars are valid only for the heating curves. The forward/reverse B2/B19′ MT starting/finishing temperatures, T Ms and T Af, are marked with filled triangles, and the high-temperature terminals of the small tails detected for x = 0.92 are represented as T*M and T*A, as indicated by the open triangles in (b1), respectively. The inset of (d1) presents the DSC cooling curve obtained with a much larger specimen. The sweeping rates were 10 K/min. (a2)–(d2) Lower columns: c P and fitting curves to the c P plots at temperatures below the ending of the peak and/or hump. Upper columns: Difference between the experimental c P and fitting curves. The c P measurements were performed in a cooling sequence using the relaxation method with three repetitions and a 2% temperature increase. The plots are an average of three repetitions. (e) Lower column: S as a function of temperature for x = 0.71, 0.92, 1.09, and 1.23. Upper column: The difference ΔS cp B2–B19′ between S for x = 0.71 (the B19′ phase) and x = 1.09 (the B2 phase).
As discussed later, in situ TEM observations during heating for x = 0.92 confirmed that the B19′ phase disappeared at approximately 230 K. This temperature agrees well with its T Af and, thus, the main peaks most likely correspond to the B2/B19′ MT. All these critical temperatures are listed in Table I together with the equilibrium temperatures, T 0 (≡ (T Ms + T Af)/2) and T*0 (≡ (T*M + T*A)/2), and the transformation temperature hystereses, T hys (≡ T Af − T Ms) and T*hys (≡ T*A – T*M). Overall, the T hys values in this work are larger than those previously determined by electrical resistivity (ER) measurements. Reference Niitsu, Kimura, Xu and Kainuma5 The transformation hysteresis is known to increase with increasing sweeping rate in the low-temperature region where the thermal activation nature is developed. Reference Xu, Kihara, Tokunaga, Matsuo, Ito, Umetsu, Kindo and Kainuma19 Because the sweeping rate used for the h-DSC measurements was 10 K/min, which is 5 times larger than that used for the ER measurements, the B2/B19′ MT behavior may be more strongly arrested, thereby resulting in the larger T hys values in this work.
Transformation temperatures and entropy changes of the Ti–(50 + x)Ni alloys.

Sweeping rates of ER, and DSC and h-DSC measurements were 2 K/min and 10 K/min, respectively.
C. Specific heat measurements
The c P values for these alloys are presented in the lower columns of Figs. 3(a2)–3(d2). All the measurements were performed in a cooling sequence using the relaxation method. Therefore, in principle, the latent heats associated with the class of first-order transformations could not be detected or, if detected, were significantly suppressed in magnitude. Indeed, although a peak appeared at approximately 260 K for x = 0.71 in response to the B2/B19′ MT [Fig. 3(a2)], its magnitude was less than one-tenth of that detected by h-DSC. As observed in Fig. 3(b2), the peak of x = 0.92 broadened similar to that in the h-DSC curve. Furthermore, this peak disappeared and was replaced by a broad hump for x = 1.09 and 1.23. We applied the hybrid function of the Einstein and Debye models as a fitting function of the phonon term of c P to the fitting curves [black lines in Figs. 3(a2)–3(d2)], in line with the precedent study. Reference Lashley, Drymiotis, Safarik and Smith20 The difference between the fitting curves and measured plots (Δc P) is presented in the upper columns. The Δc P curves facilitate the visualization of the degrees of deviation from the c P components which are reasonably expected to exist in terms of the contributions of phonon and electrons, e.g., the deviation caused by the B2/B19′ MT is highlighted for x = 0.71. An anomalous hump over a very wide temperature window is clearly visible for the two most Ni-rich alloys. Their peak temperatures are ∼220 K and appear to be insensitive to x, whereas the peak magnitudes appear to be somewhat suppressed with increasing x. These features are mostly undetectable in the h-DSC curves and thus distinct from the peak attributed to the B2/B19′ MT. Only the DSC cooling curve taken with a larger sample of x = 1.23 [see the inset of Fig. 3(d1)] shows a similar tendency with an inflection point at ∼205 K, very close to the peak temperature of the hump. In the h-DSC measurements, such a hump with wide tails over the entire measured temperature region would be difficult to clearly detect because of the uncertain baseline. Considering the similarity of c P for Ti–Ni–Fe, Reference Fukuda, Choi, Kakeshita and Ohba21 the origin of the hump is most likely linked to the second-order C–IC transition and/or related precursor phenomena. Further research on microstructural developments within these alloys will be presented in the near future.
D. Transformation behavior for x = 0.92
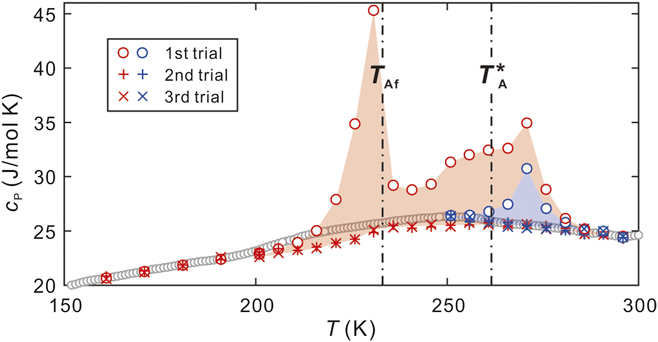
The transformation behavior for x = 0.92 was more complicated. The results of more detailed c P measurements for this alloy, which were performed using different heating sequences, are presented in Fig. 4. For the heating sequence from 10 K, the c P data of the first trial significantly deviated from those of the second and third trials, suggesting the occurrence of a first-order transformation with a temperature hysteresis larger than 2 K. Indeed, the first peak at 227 K is very close to T Af. The second peak temperature is approximately 271 K. Notably, the heating sequence from 250 K also resulted in the appearance of a peak at 271 K even though this sequence did not cross T Ms or T*M. According to the aforementioned recent work, Reference Ji, Wang, Ding, Otsuka and Ren7 isothermal holdings just above T 0 in a 51.3 Ni alloy generate the R phase, the DSC heating curve of which was very similar to those presented in Figs. 3(b1) and 4. Indeed, an in situ TEM study for this alloy revealed that three types of microstructures coexist at 80 K: the B2 phase with a modulated fine contrast, the R-like phase with twin textures, and the B19′ phase, as shown in Figs. 5(a)–5(c), respectively. Here, the amount of the B2 phase and the R-like texture was very limited and coexisted only in the thinner area of the sample foil, which may be due to the additional stabilization of the B2 phase in the thinner region. During heating, the B19′ phase fully disappeared at approximately 230 K, whereas the R-like texture remained. During further heating to 300 K, the R-like texture was significantly diminished. Accordingly, it is deduced that the peak observed at 271 K in both heating sequences is likely related to the reverse B2/R transformation and that some of the R phase arises in an isothermal nature.
Detailed c P measurements for x = 0.92. The gray data points are the same as those presented in Fig. 3(b2), the red data points represent the results for a heating sequence from 10 to 350 K, and the blue data points represent those for a heating sequence from 250 to 350 K. Above 200 K, the measurements were performed at intervals of ∼5 K. Three consecutive trials were performed for each measurement point with a temperature increase of 2 K.

Microstructures observed for x = 0.92 at 80 K: (a) B2 phase, (b) tweed-like texture, which is most likely the R phase, and (c) B19′ phase. The insets show the corresponding electron diffraction patterns obtained in the
 ${\left[ {\bar 11\bar 1} \right]_{{\rm{B}}2}}$
//
 ${\left[ {\bar 110} \right]_{{\rm{B}}19'}}$
beam direction. The scale bar is 200 nm.

E. Entropy difference between B2 and B19′ phases
S cp i (T) for various x values are presented in Fig. 3(e). Note that S cp i (T) for x = 0.71 and 0.92 was extrapolated toward higher temperatures in line with the fitting c P curves represented with solid lines in Figs. 3(a2) and 3(b2). A noticeable difference was observed between S cp i (T) for x = 0.92 and 1.09, especially at elevated temperature. This finding reasonably suggests that the B19′ phase is dominant for x = 0.92 below its B2/B19′ MT finishing temperature T Mf of ∼172 K [see Fig. 3(b1)] while including small amounts of the residual B2 phase and possibly the isothermal R phase as well and that the B2 phase is dominant for x = 1.09 over the entire temperature range. For x = 1.09, the h-DSC cooling curve showed the B2/B19′ MT sign with T Ms = 146 K [see Fig. 3(c1)] so that one may think that this alloy contains a large amount of the B19′ phase below its T Ms. However, ΔS DSC B2–B19′ associated with this MT was 0.24 J/mol K, about 10% of ΔS DSC B2–B19′ for x = 0.92 (see Table I). As discussed later, this means that the B2/B19′ MT in x = 1.09 was mostly arrested, and in such a case, the c P curve hardly shows any effects of the B2/B19′ MT, as shown in Fig. 3(c2). The upper column of Fig. 3(e) shows ΔS cp B2–B19′ (= S cp B2 − S cp B19′), i.e. the difference between S cp i (T) for x = 1.09 and 0.71 as being fully in the B2 and B19′ phases, respectively. The broken line corresponds to the ΔS cp B2–B19′ derived under the assumption that no hump would exist in the B2 phase, as indicated by the black lines in Figs. 3(c2) and 3(d2). This result strikingly demonstrates that the B2 phase in this composition region is significantly stabilized by the presence of the anomalous hump.
F. Transformation entropy change
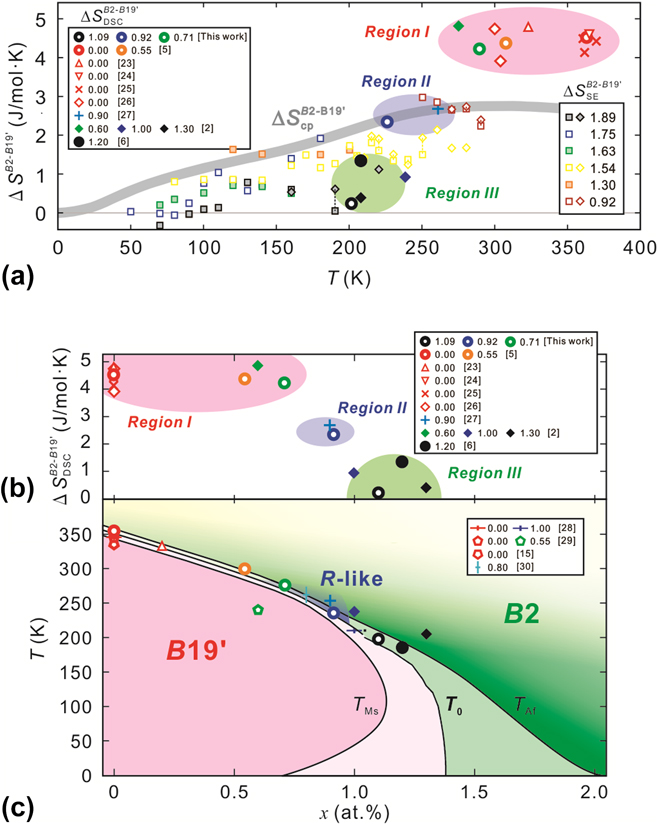
In Fig. 6(a), entropy changes between the B19′ and B2 phases are plotted for various Ti–Ni alloys for x ≥ 0 as a function of temperature. Reference Zhang, Wang, Wang, Zhou, Otsuka and Ren2,Reference Niitsu, Kimura, Xu and Kainuma5,Reference Fukuda, Yoshida and Kakeshita6,Reference Wasilewski, Butler and Hanlon22–Reference Kim, Liu and Miyazaki26 For x = 0.92, the total area of the peak and consecutive tail in the h-DSC curve are regarded as ΔS DSC B2–B19′. For the derivation of ΔS SE B2–B19′, σA at elevated temperatures has a tendency to be underestimated because of the introduction of slip deformations and, thus, σ0 is also reduced. Therefore, the ΔS SE B2–B19′ values derived from dσM/dT, instead of dσ0/dT, were plotted together for some σ–ε curves (open diamonds). Overall, the ΔS SE B2–B19′ values were relatively close to the ΔS cp B2–B19′ curve, whereas ΔS DSC B2–B19′ exhibited a very different temperature dependency from both ΔS cp B2–B19′ and ΔS SE B2–B19′.
ΔS DSC B2–B19′ as a function of (a) temperature and (b) x. Reference Zhang, Wang, Wang, Zhou, Otsuka and Ren2,Reference Niitsu, Kimura, Xu and Kainuma5,Reference Fukuda, Yoshida and Kakeshita6,Reference Berman, West and Rozner23–Reference Honma and Takei27 (c) T 0 plots for various Ti–Ni alloys. Reference Kakeshita, Fukuda, Tetsukawa, Saburi, Kindo, Takeuchi, Honda, Endo, Taniguchi and Miyako13,Reference Honma and Takei27–Reference Wang, Verlinden and Humbeeck29 The T 0, T Ms, and T Af lines below 200 K refer to our precedent work. Reference Niitsu, Kimura, Xu and Kainuma5 In (a), the ΔS SE B2–B19′ values derived from dσ0/dT and dσMs/dT are plotted with open squares and diamonds, respectively. In (c), the color change in the B2 phase region represents the possible change in the degree of commensurability: denser contrast indicates higher commensurability. The references of ΔS DSC B2–B19′ and T 0 were limited to those of alloys quenched from the B2 single-phase region.
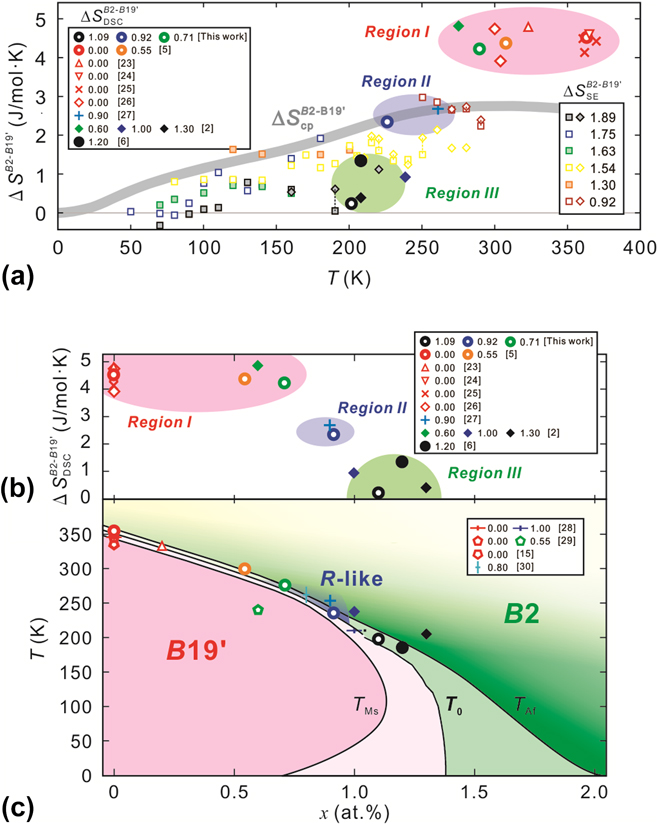
Figures 6(b) and 6(c) present the ΔS DSC B2–B19′ and T 0 values with respect to the change in x, respectively. Reference Zhang, Wang, Wang, Zhou, Otsuka and Ren2,Reference Niitsu, Kimura, Xu and Kainuma5,Reference Fukuda, Yoshida and Kakeshita6,Reference Kakeshita, Fukuda, Tetsukawa, Saburi, Kindo, Takeuchi, Honda, Endo, Taniguchi and Miyako13,Reference Wasilewski, Butler and Hanlon22–Reference Wang, Verlinden and Humbeeck29 The ΔS DSC B2–B19′ plots appear to be divided into three composition regions: Region I, x ≲ 0.8 (260 K ≲ T 0), showing a static value in the range of 4–5 J/mol K, which is obviously larger than ΔS cp B2–B19′; Region II, x ∼ 0.9 (T 0 ∼ 235 K), exhibiting values comparable to ΔS cp B2–B19′; and Region III, 0.95 ≲ x (T 0 ≲ 225 K), possessing values much smaller than ΔS cp B2–B19′. In our recent study, Reference Niitsu, Kimura, Xu and Kainuma5 dT 0/dx was expressed by
 $${{{\rm{d}}{T_0}} \over {{\rm{d}}x}} = - {{\Delta {\mu _{{\rm{Ti}}}} - \Delta {\mu _{{\rm{Ni}}}}} \over {\Delta {S^{{\rm{B}}2 - {\rm{B}}19'}}}}\quad ,$$
where Δμ i represents the difference in the chemical potentials of the element i between the B2 and B19′ phases. By combining Eqs. (3) and (4) with respect to ΔS SE B2–B19′, the T 0 line in Fig. 6(c) was derived with the known dσ0/dT for x = 1.75. Reference Niitsu, Omori and Kainuma8 In addition, the T Ms and T Af lines could also be estimated from dσMs/dT and dσAf/dT by analogy with dσ0/dT, respectively. As observed in Fig. 6(c), these conversions reveal that the transformation hysteresis drastically widened with decreasing temperature. Therefore, the unreasonably small ΔS DSC B2–B19′ in Region III can be explained by the kinetic arrest (i.e., partial transformation) in the B2/B19′ MT. However, it still appears unreasonable that the total amount of ΔS DSC B2–B19′ (2.31 J/mol K) for x = 0.92 (Region II), which is given as the total amount of ΔS DSC for the B2/B19′ MT including the partial B2/R transformation, remains much smaller than that (4.22 J/mol K) for the B2/B19′ MT of x = 0.71 (Region I). The origin of this remarkable discrepancy remains unclear but may be related to the precursor condition in the B2 phase. We guess that the following two factors, (i) change in the volume fraction of the precursor nanodomains and (ii) change in the degree of commensurability within the nanodomains, should be considered as the possible origin of the anomalous hump. It is possible that the B2 phase in Region I is additionally stabilized by both of the factors while in Region II (and possibly Region III as well) is stabilized by either one factor. Further studies on the microscopic changes of these alloys are in progress and will be provided in the near future.
IV. CONCLUSION
Using compressive tests as well as c P and DSC measurements, the entropy S and its difference ΔS B2–B19′ during the B2/B19′ MT were systematically investigated for various Ni-rich Ti–Ni alloys and temperatures. An anomalous hump with a very wide temperature tail from ∼100 to ∼350 K was observed for c P in the B2 phase and was found to additionally stabilize the B2 phase at elevated temperature. The ΔS B2–B19′ values estimated by the DSC measurements (ΔS DSC B2–B19′) were classified into three regions depending on the Ni composition. The values were unreasonably larger (by ∼2 J/mol K) than, comparable to, and smaller than those expected based on the c P measurements (ΔS cp B2–B19′) for x ≲ 0.8, x ∼ 0.9, and 0.95 ≲ x, respectively. Although the reason for the larger ΔS DSC B19′–B2 for x ≲ 0.8 is unclear, the very small ΔS DSC B2–B19′ for 0.95 ≲ x was shown to originate from the kinetic arrest in the B2/B19′ MT. The temperature dependence of σ0 indirectly enabled estimation of ΔS SE B2–B19′ even for 0.95 ≲ x, where the B2/B19′ MT cannot be thermally induced. The results were consistent with the ΔS cp B2–B19′ values rather than the ΔS DSC B2–B19′ values, which supported the deduction that the thermally induced B2/B19′ MT is arrested in this region. For x = 0.92, a tweed-like microstructure and a specific heat peak with B2/R transformation characteristics were confirmed. This result suggests that the B2/R transformation takes place as a result of significant development of the precursor state in the B2 phase, while the presence of such an interplay is still under discussion.
The present study revealed some anomalous behaviors of S and ΔS B2–B19′ underlying unresolved anomalous transformation behaviors as well as the aspects of microscopic changes and kinetic effects on the B2/B19′ MT, which became remarkable upon cooling. These findings will contribute to essential understandings of the transformation behaviors in this alloy system.
ACKNOWLEDGMENT
This study was supported by a Grant-in-Aid for Scientific Research (Grant No. JP16K21632) by the Japan Society for the Promotion of Science.