I. INTRODUCTION
Citrate salts have a variety of industrial uses, including as polymer additives and chelating agents. Citrate is a common pharmaceutical counter-anion for cationic active pharmaceutical ingredients (APIs), and calcium citrate tetrahydrate is a widely used calcium supplement to reduce the effects of osteoporosis in women. Metal citrates are often used as reagents in the synthesis of ceramic oxides by the Pechini method. Citrate anions have a rich structural chemistry, reflecting their variable states of ionization, conformational flexibility, and variety of metal coordination modes.
A systematic study of the crystal structures of Group 1 (alkali metal) citrate salts has been reported in Rammohan and Kaduk (Reference Rammohan and Kaduk2018) and companion papers. The study was extended to mixed Group 1 citrate and to alkali/ammonium citrates in another series of papers. Recent work has extended the study to Group 2 (alkaline earth) citrates, including those of magnesium (Kaduk, Reference Kaduk2020a), calcium (Kaduk, Reference Kaduk2018, Reference Kaduk2020b), and barium (Kaduk, Reference Kaduk2021). This paper represents a further extension to strontium citrates.
A search of the Cambridge Structural Database (Groom et al., Reference Groom, Bruno, Lightfoot and Ward2016) for strontium citrates yielded only strontium citrate pentahydrate (Zacharias and Glusker, Reference Zacharias and Glusker1993; CSD Refcode LATRAZ). A similar search in the Powder Diffraction File (Gates-Rector and Blanton, Reference Gates-Rector and Blanton2019) yielded entry 02-067-4890, calculated from the LATRAZ structure.
II. EXPERIMENTAL
Strontium hydrogen citrate monohydrate was prepared by adding 0.7366 g (5.0 mmol) SrCO3 to a solution of 2.0771 g (10.0 mmol) H3C6H5O7(H2O)1 in 30 ml of water and heating slowly. (SrCO3 does not react with citric acid solution at room temperature.) After slow fizzing, the solution became nearly clear after ~10 min. The solution was filtered and allowed to stand at ambient conditions. A small amount of white solid formed almost immediately as the solution cooled, so the mixture was filtered again. After 3 days at ambient conditions, a white solid formed, embedded in a yellow glass.
A laboratory X-ray powder pattern was measured (CuKα radiation, 5–70° 2θ, 0.0202144° steps, 1.0 s step−1) on a Bruker D2 Phaser diffractometer equipped with a LynxEye position-sensitive detector. The pattern (Figure 1) was indexed on a C-centered monoclinic cell having a = 25.1383, b = 10.8954, c = 6.3776 Å, β = 91.941°, V = 1745.8 Å3, and Z = 8 using N-TREOR (Altomare et al., Reference Altomare, Cuocci, Giacovazzo, Moliterni, Rizzi, Corriero and Falcicchio2013). Analysis of the systematic absences using FOX (Favre-Nicolin and Černý, Reference Favre-Nicolin and Černý2002) suggested the space group C2/c. The volume/asymmetric unit indicated that this was a 1:1 Sr:citrate salt, rather than the stoichiometric 1:2. The structure was solved using FOX using an Sr atom and a citrate anion as fragments, and a water molecule was added in the void suggested by Mercury (Macrae et al., Reference Macrae, Sovago, Cottrell, Galek, McCabe, Pidcock, Platings, Shields, Stevens, Towler and Wood2020).
Laboratory (CuKα radiation) of Sr(HC6H5O7)(H2O), which crystallized from a synthesis with an Sr:citrate ratio = 1:2.

Another pattern was measured (after storage at ambient conditions for 25 months; additional storage for 6 years did not result in further changes to the pattern) at 295 K at beamline 11-BM (Antao et al., Reference Antao, Hassan, Wang, Lee and Toby2008; Lee et al., Reference Lee, Shu, Ramanathan, Preissner, Wang, Beno, Von Dreele, Ribaud, Kurtz, Antao, Jiao and Toby2008; Wang et al., Reference Wang, Toby, Lee, Ribaud, Antao, Kurtz, Ramanathan, Von Dreele and Beno2008) of the Advanced Photon Source at Argonne National Laboratory using a wavelength of 0.413353 Å from 0.5 to 50° 2θ with a step size of 0.001° and a counting time of 0.1 s step−1. The white powder was packed into a 1.5-mm diameter Kapton capillary and rotated during the measurement at ~50 Hz. The synchrotron pattern (Figure 2) indicated that the sample had changed and was a mixture of phases.
Comparison of the synchrotron (black) and laboratory (green) patterns of strontium hydrogen citrate monohydrate. The laboratory pattern was converted to the synchrotron wavelength of 0.413353 Å using Jade Pro (MDI, 2019).

The additional peaks were indexed on a primitive triclinic cell having a = 8.9630, b = 11.7390, c = 13.7698 Å, α = 97.984, β = 101.871, γ = 106.433°, and V = 1329.59 Å3 using DICVOL14 (Louër and Boultif, Reference Louër and Boultif2014). The space group was assumed to be P-1. Using the 14.5 Å3/non-H atom in strontium hydrogen citrate monohydrate and the 15.4 Å3 in LATRAZ, this cell volume corresponds to 43-44 atoms in the asymmetric unit.
This second phase was included in a Rietveld refinement as a Le Bail phase. Its peaks account for a significant fraction of the pattern (Figure 3). The reflection list was extracted from the Crystallographic Information Framework (CIF) written by GSAS-II and converted into a d/I list using a spreadsheet. This peak list was used as input to Endeavour (Putz and Brandenburg, Reference Putz and Brandenburg2019). Initial attempts to solve the structure by Monte Carlo Simulated Annealing techniques using only Sr atoms as fragments yielded the lowest residuals with 4 Sr/cell. Four Sr/cell plus 6 citrates (13 atoms each) yields 82 atoms/cell, suggesting the presence of ~4–6 water molecules/cell. The original sample was obtained from a preparation with Sr:citrate = 1:2, so the presence of Sr(Hcit)H2O means that there was excess citrate present in the amorphous fraction. Over 2 years of storage, it is not unreasonable to expect additional crystallization, perhaps to yield a strontium citrate/citric acid co-crystal analogous to aqua(hydrogencitrato)(citric acid)calcium monohydrate, [Ca(HC6H5O7)(H3C6H5O7)(H2O)](H2O) (Kaduk, Reference Kaduk2020b). Attempts to solve the structure using 4 Sr, 6 citrate, and 8 O/cell led to a best solution containing 2 Sr, 3 citrates, and 6 water molecules in the unit cell. Refinement of such a large structure in a mixture was not promising. A better solution for characterizing this compound will be to synthesize it in pure form.
Comparison of the synchrotron pattern (black) to the pattern calculated for Sr(HC6H5O7)(H2O), highlighting the peaks from the uncharacterized second phase with a triclinic unit cell.

The structure of strontium hydrogen citrate monohydrate was first refined with the laboratory data using GSAS-II (Toby and Von Dreele, Reference Toby and Von Dreele2013). The final refinement of 87 variables using 2968 observations and 36 restraints yielded the residuals R wp = 0.04696 and GOF = 2.36. The structure was refined again with the synchrotron data using GSAS-II. The final refinement of 77 variables using 28 304 observations and 37 restraints yielded the residuals R wp = 0.11623 and GOF = 2.69. A density functional geometry (DFT) optimization was carried out, along with a Mulliken population analysis, using CRYSTAL09 (Dovesi et al., Reference Dovesi, Orlando, Civalleri, Roetti, Saunders and Zicovich-Wilson2005). The basis sets for the H, C, and O atoms were those of Gatti et al. (Reference Gatti, Saunders and Roetti1994), and the basis set for Sr was that of Piskunov et al. (2004). The calculation used 8 k-points and the B3LYP functional, and took ~4 days on a 2.4 GHz PC.
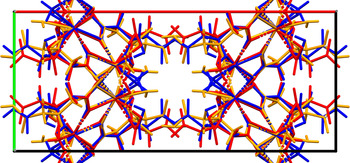
The structure contained SrO8 coordination spheres, which joined into layers. The water molecule O21 was coordinated, and bridged two Sr. Several features of these structures suggested that the structure was incorrect, despite the low refinement residuals. The agreement of the two refined structures with the DFT-optimized structure was poor (Figure 4), and well outside the normal range for correct structures. The orientations of the central carboxylate groups C6/O15/O16 were significantly different in the two refined structures. Using the laboratory data, the position of the water molecule O21 refined to a location unreasonably close to the hydroxyl group O17. In both refinements, some of the displacement coefficients refined to unreasonable values.
Comparison of the laboratory (red), synchrotron (orange), and DFT models of the initial incorrect structure of strontium hydrogen citrate monohydrate.

These features suggested that the Monte Carlo Simulated Annealing structure solution had not found the global minimum but had become trapped in a false minimum. Accordingly, two different strategies were used to search for the global minimum. FOX was used again, with a citrate, Sr, and two O atoms as fragments. The hope was that the dynamic occupancy correction feature would merge the two O atoms (water molecules) if they got too close to each other. All 150 trials yielded similar structures, which had some Sr–O distances which were far too short (<1.5 Å), and an unreasonable conformation of the citrate anions (two carboxyl groups too close to each other). Simultaneously, the simulated annealing feature of EXPO2014 (Altomare et al., Reference Altomare, Cuocci, Giacovazzo, Moliterni, Rizzi, Corriero and Falcicchio2013) was applied, with a citrate, Sr, and one O as fragments. This attempt yields a much improved structure.
The new model of the structure of strontium hydrogen citrate monohydrate was first refined with the laboratory data using GSAS-II (Toby and Von Dreele, Reference Toby and Von Dreele2013). Only the 10.0–70.0° portion of the pattern was included in the refinement (d min = 1.343 Å), as the intensities of the lowest-angle peaks are affected by beam spillover, and are too low. All non-H bond distances and angles in the citrate anion were subjected to restraints, based on a Mercury/Mogul Geometry Check (Bruno et al., Reference Bruno, Cole, Kessler, Luo, Motherwell, Purkis, Smith, Taylor, Cooper, Harris and Orpen2004; Sykes et al., Reference Sykes, McCabe, Allen, Battle, Bruno and Wood2011) of the cation and the anion. The Mogul average and standard deviation for each quantity were used as the restraint parameters. The Sr–O bonds were restrained to a value of 2.63(10) Å, based on the expected value for an 8-coordinate Sr by the bond valence method. The restraints contributed 12.3% to the final χ 2. The hydrogen atoms were included in calculated positions, which were recalculated during the refinement using Materials Studio (Dassault, 2020). The U iso were grouped by chemical similarity; the U iso for the H atoms were fixed at 1.3× the U iso of the heavy atoms to which they are attached. The peak profiles were described using a uniaxial microstrain model, with 100 as the unique axis. The background was modeled using a 9-term shifted Chebyshev polynomial. A second-order spherical harmonic preferred orientation model was included; the texture index was 1.021(2).
The final refinement of 69 variables using 2968 observations and 37 restraints yielded the residuals R wp = 0.03037 and GOF = 1.52. The largest peak (2.02 Å from C4) and hole (2.39 Å from O13) in the difference Fourier map were 0.51 and −0.46(10) eÅ−3, respectively. The final fit (Figure 5) is excellent, and only minor errors are noted.
The Rietveld plot for the laboratory refinement of strontium hydrogen citrate monohydrate. The blue crosses represent the observed data points, and the green line is the calculated pattern. The cyan curve is the normalized error plot.

The structure of strontium hydrogen citrate monohydrate was refined again with the synchrotron data using GSAS-II (Toby and Von Dreele, Reference Toby and Von Dreele2013). Only the 1.3–30.0° portion of the pattern was included in the refinement (d min = 0.798 Å), and the same strategy was followed. The restraints contributed 1.0% to the final χ 2. The peak profiles were described using the generalized microstrain model. The background was modeled using a 6-term shifted Chebyshev polynomial. A second-order spherical harmonic preferred orientation model was included; the texture index was 1.000(0).
The final refinement of 79 variables using 28 704 observations and 37 restraints yielded the residuals R wp = 0.09376 and GOF = 2.16. The largest peak (0.16 Å from Sr19) and hole (2.03 Å from O13) in the difference Fourier map were 0.43 and −0.42(11) eÅ−3, respectively. The largest errors in the fit (Figure 6) are in the shapes and positions of some of the peaks and may reflect changes in the specimen during exposure to the X-ray beam.
The Rietveld plot for the synchrotron refinement of strontium hydrogen citrate monohydrate. The blue crosses represent the observed data points, and the green line is the calculated pattern. The cyan curve is the normalized error plot. The vertical scale has been multiplied by a factor of 15× for 2θ >12.0°.

A DFT geometry optimization (fixed experimental unit cell) was carried out using VASP (Kresse and Furthmüller, Reference Kresse and Furthmüller1996) through the MedeA graphical interface (Materials Design, 2016). The calculations were carried out on 16 2.4 GHz processors (each with 4 GB RAM) of a 64-processor HP Proliant DL580 Generation 7 Linux cluster at North Central College. The calculations used the GGA-PBE functional, a plane wave cutoff energy of 400.0 eV, and a k-point spacing of 0.5 Å−1 leading to a 3 × 3 × 2 mesh. A single-point calculation was carried out, along with a Mulliken population analysis, using CRYSTAL14 (Dovesi et al., Reference Dovesi, Orlando, Erba, Zicovich-Wilson, Civalleri, Casassa, Maschio, Ferrabone, De Le Pierre, D'Arco, Noel, Causa, Rerat and Kirtman2014). The basis sets for the H, C, and O atoms were those of Gatti et al. (Reference Gatti, Saunders and Roetti1994), and the basis set for Sr was that of Laun et al. (Reference Laun, Oliveira and Bredow2018). The calculations were run on 8 2.1 GHz Xeon cores (each with 6 GB RAM) of a 304-core Dell Linux cluster at IIT, used 8 k-points and the B3LYP functional.
III. RESULTS AND DISCUSSION
The crystal structure of strontium hydrogen citrate monohydrate has been refined twice, once using laboratory (CuKα) data and once using synchrotron data from a sample containing a significant concentration of an unknown impurity. The structure has also been optimized using density functional techniques. The refined atom coordinates (both from the Rietveld refinements and the DFT optimization) are reported in the CIFs which have been deposited with ICDD. The atom numbering is shown in Figure 7, and the crystal structure is illustrated in Figure 8.
The atom numbering in strontium hydrogen citrate monohydrate. The atoms are represented by 50% probability spheroids.

The crystal structure of strontium hydrogen citrate monohydrate, viewed down the c-axis.

The root-mean-square (rms) Cartesian displacement between the laboratory and DFT structures is 0.076 Å, the rms displacement between the synchrotron and DFT structures is 0.087 Å, and the displacement between the laboratory and synchrotron structures is 0.066 Å. The structures are virtually identical, and the agreement is well within the normal range for correct structures (van de Streek and Neumann, Reference van de Streek and Neumann2014). The rest of this discussion will emphasize the DFT structure.
The citrate is ionized at the central and one of the terminal carboxyl groups, as is the typical pattern (Rammohan and Kaduk, Reference Rammohan and Kaduk2018). The citrate triply chelates to an Sr19 through the central carboxylate O15, the terminal carboxylate O12, and the hydroxyl group O17. The carboxylate O11/O12 chelates to another Sr19. O11, O12, O15, and O16 each bridge two additional Sr19. The terminal carboxylic acid C5/O13/O14/H21 does not coordinate with the Sr. Unlike in the first wrong structure, the water molecule O20 does not coordinate to the Sr. The Sr is 8-coordinate (distorted square antiprism), and the bond valence sum is 2.15.
The Sr coordination and the hydrogen bonding result in a layered structure (Figure 8). The SrO8 coordination polyhedra share edges to form corrugated layers parallel to the bc-plane. Hydrogen bonds between the carboxylic acid groups and water molecules link the layers. The hydrophobic methylene groups are adjacent to each other in the structure.
Almost all of the bond distances, bond angles, and torsion angles fall within the normal ranges indicated by a Mercury/Mogul Geometry Check (Macrae et al., Reference Macrae, Sovago, Cottrell, Galek, McCabe, Pidcock, Platings, Shields, Stevens, Towler and Wood2020). The O17–C3–C6 angle of 111.1° (average = 107.5(11)°, Z-score = 3.3) is flagged as unusual. The standard uncertainty on the average is relatively small and the population of similar angles is small; both of these inflate the Z-score. The O13–C5–C4–C3 and O14–C5–C4–C3 torsion angles are flagged as unusual. These lie on the tails of very broad distributions, and the terminal carboxyl groups can have nearly any torsion angle in citrates (Rammohan and Kaduk, Reference Rammohan and Kaduk2018). The citrate anion is in the trans,trans conformation, which is one of the two low-energy conformations of citrate anions, and is typical for salts containing larger cations (Rammohan and Kaduk, Reference Rammohan and Kaduk2018). The central portion of the molecule is in the usual planar arrangement; the O17–C3–C6–O15 torsion angle is 8.0°.
Analysis of the contributions to the total crystal energy using the Forcite module of Materials Studio (Dassault, 2020) suggests that angle distortion terms dominate the intramolecular deformation energy, but that bond and torsion terms also are significant. The intermolecular energy is dominated by electrostatic attractions, which in this force-field-based analysis include cation coordination and hydrogen bonds. The hydrogen bonds are better analyzed using the results of the DFT calculation.
The carboxylic acid O14–H21 acts as the donor in a strong hydrogen bond to the water molecule O20 (Table I). The water molecule acts as a donor in two hydrogen bonds, one to the ionized carboxylate O16 and the other to the unionized carboxylic acid O14. The hydroxyl group O17–H18 is the donor in an intermolecular hydrogen bond to the carbonyl group O13. These hydrogen bonds link the layers in a ring pattern with a graph set symbol R2,2(12) (Etter, Reference Etter1990; Bernstein et al., Reference Bernstein, Davis, Shimoni and Chang1995; Shields et al., Reference Shields, Raithby, Allen and Motherwell2000).
Hydrogen bonds (CRYSTAL09) in strontium hydrogen citrate monohydrate.

The volume enclosed by the Hirshfeld surface (Figure 9; Hirshfeld, Reference Hirshfeld1977; Turner et al., Reference Turner, McKinnon, Wolff, Grimwood, Spackman, Jayatilaka and Spackman2017) is 206.56 Å3, 94.55% of 1/8 the unit cell volume. The packing density is thus unusually high. All of the significant-close contacts (red in Figure 9) involve the hydrogen bonds and the Sr coordination. The volume/non-hydrogen atom is only 14.5 Å3, smaller than the usual rule of thumb (17–18 Å3/non-H atom), but falls within the trend for Group 1 and Group 2 citrates (Figure 10).
The Hirshfeld surface of strontium hydrogen citrate monohydrate. Intermolecular contacts longer than the sums of the van der Waals radii are colored blue, and contacts shorter than the sums of the radii are colored red. Contacts equal to the sums of radii are white.

Correlation between the cation size (measured by the bond valence r 0) and the volume/non-H atom in Group 1 and Group 2 citrates. The r 0 for Sr2+–O2− = 2.118 Å.

The Bravais–Friedel–Donnay–Harker (Bravais, Reference Bravais1866; Friedel, Reference Friedel1907; Donnay and Harker, Reference Donnay and Harker1937) method suggests that we might expect elongated morphology for strontium hydrogen citrate monohydrate, with 〈001〉 as the long axes, or platy morphology with {200} as the major faces. An second-order spherical harmonic model for the preferred orientation was incorporated into the laboratory refinement. The texture index was 1.021(2), indicating that the preferred orientation was slight in this rotated flat-plate specimen. A second-order model was included in the synchrotron refinement. The texture index was only 1.000(0), indicating that the preferred orientation was not present in that rotated capillary specimen.
In the structure of LATRAZ, the three independent Sr are 8-, 8-, and 9-coordinate. The coordination polyhedra share edges to form layers parallel to the bc-plane (Figure 11). Only van der Waals interactions seem to occur between the layers. The citrates are also in the trans,trans conformation. The high number of water molecules means that the hydrogen bonding (Table II) is very different than in Sr(HC6H5O7)(H2O). Larger numbers of strontium citrate structures will be required before more detailed conclusions about trends can be made.
The crystal structure of tristrontium dicitrate pentahydrate (LATRAZ), viewed down the c-axis.

Hydrogen bonds (CRYSTAL09) in tristrontium dicitrate pentahydrate (LATRAZ).

IV. DEPOSITED DATA
The Crystallographic Information Framework (CIF) files containing the results of the Rietveld refinements (including the raw data) and the DFT geometry optimization were deposited with the ICDD. The data can be requested at info@icdd.com.
ACKNOWLEDGEMENTS
The use of the Advanced Photon Source at Argonne National Laboratory was supported by the U.S. Department of Energy, Office of Science, Office of Basic Energy Sciences, under Contract No. DE-AC02-06CH11357. I thank Lynn Ribaud and Saul Lapidus for their assistance in the data collection. I thank an anonymous reviewer for the suggestion that the first structure was a false minimum and that the structure solution should be explored further. I thank Andrey Roachev for the use of computing resources at IIT.
CONFLICTS OF INTEREST
The author has no conflicts of interest to declare.