Implications
The experiment can be helpful for the research of genes implicated in digestion efficiency variations in broiler chickens. The experiment also supplies information on the beneficial effects of fibres on digestion efficiency in broiler chickens, which can be used in practice by feed manufacturers.
Introduction
Digestion in growing chickens fed diets based on wheat, rye or barley has been studied for a long time, since these cereals can sometimes result in reduced feed efficiency (Marquardt et al., Reference Marquardt, Boros, Guenter and Crow1994) and risk of intestinal bacterial overgrowth (Riddell and Kong, Reference Riddell and Kong1992) in chickens. These problems were mainly attributed to the high intestinal viscosity produced by water-soluble non-starch polysaccharides occurring in these cereals (Jensen et al., Reference Jensen, Fry, Allred and McGinnis1957; Murphy et al., Reference Murphy, McCracken, McCann, George and Bedford2009), resulting in negative effects on protein and lipid digestibilities (Choct and Annison, Reference Choct and Annison1992; Carré et al., Reference Carré, Idi, Maisonnier, Melcion, Oury, Gomez and Pluchard2002), and increased intestinal retention time (Danicke et al., Reference Danicke, Vahjen, Simon and Jeroch1999). Therefore, enzyme feed additives were proposed to be used for alleviating viscosity problems in growing chickens (Marquardt et al., Reference Marquardt, Boros, Guenter and Crow1994).
However, nutritional conclusions with wheat were somewhat different because the level of viscosity was much lower with wheat than with barley or rye (Marquardt et al., Reference Marquardt, Boros, Guenter and Crow1994; Carré et al., Reference Carré, Idi, Maisonnier, Melcion, Oury, Gomez and Pluchard2002), with weak negative relationships between in vitro viscosity and nutritional value of wheat (Carré et al., Reference Carré, Idi, Maisonnier, Melcion, Oury, Gomez and Pluchard2002). Negative relationships were also found between particle size or hardness of wheat and starch digestibility in growing chickens (Carré et al., Reference Carré, Idi, Maisonnier, Melcion, Oury, Gomez and Pluchard2002 and Reference Carré, Muley, Gomez, Oury, Laffitte, Guillou and Signoret2005a). Besides this negative effect of coarse particles, it was proposed that coarse particles could also be positive on digestion efficiencies in growing chickens because coarse particles might result in a larger gizzard and better control of gastric emptying with subsequent improved digestion efficiencies (Hetland et al., Reference Hetland, Choct and Svihus2004). For instance, positive relationships were observed between gizzard weight and protein or starch digestibilities in growing chickens (Maisonnier et al., Reference Maisonnier, Gomez, Chagneau and Carré2001; Péron et al., Reference Péron, Gomez, Mignon-Grasteau, Sellier, Besnard, Derouet, Juin and Carré2006; Rougière et al., Reference Rougière, Gomez, Mignon-Grasteau and Carré2009). Therefore, feeding coarse particles could result in conflicting effects on digestion efficiencies in growing chickens, depending on the nutrients and origin of feed particles. The genetic origin of birds was also shown to influence the effect of coarse particles, as reported by Rougière et al. (Reference Rougière, Gomez, Mignon-Grasteau and Carré2009) in a study using the genetic chicken lines D+ and D− selected for divergent digestion efficiency (Mignon-Grasteau et al., Reference Mignon-Grasteau, Muley, Bastianelli, Gomez, Péron, Sellier, Millet, Besnard, Hallouis and Carré2004). According to Rougière et al. (Reference Rougière, Gomez, Mignon-Grasteau and Carré2009), coarse particles resulted in improved digestions of protein and energy in bad digesters (D− birds), whereas no effect was observed in good digesters (D+ birds).
D+ and D− chicken lines were developed because it appeared that the overall variability in digestion efficiencies in growing chickens fed various wheat diets came largely from individual birds, and much less came from wheat samples (Choct et al., Reference Choct, Hughes and Bedford1999; McCracken et al., Reference McCracken, Bedford and Stewart2001; Carré et al., Reference Carré, Idi, Maisonnier, Melcion, Oury, Gomez and Pluchard2002 and Reference Carré, Mignon-Grasteau, Péron, Juin and Bastianelli2007). Therefore, genetic selection appeared to be an efficient way to improve digestion efficiency in growing chickens fed on wheat diets (Mignon-Grasteau et al., Reference Mignon-Grasteau, Muley, Bastianelli, Gomez, Péron, Sellier, Millet, Besnard, Hallouis and Carré2004; Carré et al., Reference Carré, Mignon-Grasteau, Péron, Juin and Bastianelli2007). Besides such economic interest, D+ and D− lines also represent a unique model for the study of physiological and genetic limiting factors of digestion. The latter interest is reinforced by the fact that total digestion in chickens is rather similar to ileal digestion in monogastric mammals, since digestion in the caeca and colon is very limited in chickens (Vergara et al., Reference Vergara, Ferrando, Jimenez, Fernandez and Gonalons1989a).
Major differences in gut anatomy were observed between D+ and D− lines, with D+ birds showing a larger gizzard and smaller intestine than D− birds (Péron et al., Reference Péron, Gomez, Mignon-Grasteau, Sellier, Besnard, Derouet, Juin and Carré2006; García et al., Reference García, Gomez, Mignon-Grasteau, Sellier and Carré2007; Rougière et al., Reference Rougière, Gomez, Mignon-Grasteau and Carré2009). Varying the gizzard size by giving diets with a coarse structure provided evidence that gizzard function was a key determinant in the difference between D+ and D− digestion efficiencies (Rougière et al., Reference Rougière, Gomez, Mignon-Grasteau and Carré2009). The stomach of chickens is divided into two compartments, the proventriculus or glandular part where the secretions of HCl and pepsinogen occur, and the gizzard or muscular part where the digesta are ground (Duke, Reference Duke1986). Gizzard emptying in the duodenum is controlled by the pylorus that allows particles to move to the duodenum once they reach a critical size (Ferrando et al., Reference Ferrando, Vergara, Jimenez and Gonalons1987; Vergara et al., Reference Vergara, Ferrando, Jimenez, Fernandez and Gonalons1989a).
It may be supposed that the difference in gizzard weight observed between D+ and D− lines is associated with differences in gastric emptying. The first aim of this experiment was to test this hypothesis under variable conditions regarding gizzard stimulation. This variation was obtained by using two corn diets differing in fibre addition. Corn was used instead of any other cereal in order to get similar nutritional conditions for both lines, since the difference in dietary metabolizable energy (ME) value between D+ and D− lines does not exceed 6% with a corn diet (Rougière et al., Reference Rougière, Gomez, Mignon-Grasteau and Carré2009), while this can reach 27% with a wheat diet (García et al., Reference García, Gomez, Mignon-Grasteau, Sellier and Carré2007). Retention times in digestive compartments were estimated by measuring amounts of indigestible markers in the stomach and in intestinal segments in birds under continuous feeding. Protein digestibility and ME values were also measured in order to establish relationships between retention times, gut anatomy and digestion efficiencies.
Another aim of the experiment was to examine the differences in gut anatomy between lines during their growth, as it was previously shown that the difference in feed efficiency between D+ and D− lines was a transient phenomenon disappearing at 8 weeks of age (Carré et al., Reference Carré, Mignon-Grasteau, Svihus, Péron, Bastianelli, Gomez, Besnard and Sellier2005b). Therefore, the anatomical study was performed from 0 to 63 days.
Material and methods
Experimental animals
Chickens from genetic divergent lines D+ (high digestion efficiency) and D− (low digestion efficiency) were used in this experiment. This selection was conducted from 2002 at the Avian Research Unit (INRA, Nouzilly, France), on the basis of the apparent ME value of a wheat-based diet, corrected to zero nitrogen retention (AMEn), measured at 3 weeks of age (Mignon-Grasteau et al., Reference Mignon-Grasteau, Muley, Bastianelli, Gomez, Péron, Sellier, Millet, Besnard, Hallouis and Carré2004). The wheat samples of diets used for this genetic selection were all from the Rialto cultivar characterized by a very high viscosity of its water extract and a medium hard value. Heritabilities of digestion efficiencies were observed to be rather high, in the range of 0.33 to 0.47 (Mignon-Grasteau et al., Reference Mignon-Grasteau, Muley, Bastianelli, Gomez, Péron, Sellier, Millet, Besnard, Hallouis and Carré2004). No significant genetic correlation was observed between 3-week body weight (BW) and AMEn (Mignon-Grasteau et al., Reference Mignon-Grasteau, Muley, Bastianelli, Gomez, Péron, Sellier, Millet, Besnard, Hallouis and Carré2004).
In the current experiment, chickens were obtained from the 8th generation of selection. On the 8th generation, the relative differences (P < 0.0001) in the AMEn value of the wheat-based diet and in digestibilities of starch, lipids and proteins were observed to be 32%, 29%, 42% and 10%, respectively, between lines, with 211 birds being individually tested in each line; digestion efficiencies were not significantly affected by sex effect.
For each line, 141 birds were removed from the hatcher, wing-banded and assigned at random to four groups, as follows: group 1 (25 birds from each line) was used for gut anatomy determination at day 0. Group 2 (34 from each line) was used for gut anatomy determinations at 9 days. In this group, 23 birds from each line were also used for transit time study at 9 days. Group 3 (22 from each line) was used for transit time and gut anatomy studies at 29 days. Group 4 (60 from each line) was used for feed efficiency determination from 9 days to 20 days, for digestive balance experiment from 20 days to 23 days and for gut anatomy determination at 29 days (12 birds from each line), 42 days (20 birds from each line) and 63 days (26 birds from each line). Birds were placed in metal cages at day 0 with 3 or 4 chicks per cage. At 9 days, the chicks were randomly allocated to individual cages (36 cm length × 22 cm width × 40 cm height) provided with an individual feeder and a drinking system. Environment conditions were controlled for ventilation, light (23L:1D with the dark period beginning at 0000 h) and temperature (34°C at 1 day, 33°C until 3 days, 31°C until 8 days, 29°C until 15 days, 26°C until 22 days and 24°C until 63 days). From 44 days, birds were transferred to two floor pens (7.3 m2 each), with one pen being assigned to the S diet and the other to the F diet.
Experimental diets were given ad libitum throughout the experiment, except during food deprivation periods.
All experiments were carried out with due regard to legislation governing the ethical treatment of animals, and the animal handling protocols were allowed to be conducted according to the authorization N° 007196 delivered by Indre-et-Loire Préfecture (France).
Experimental diets
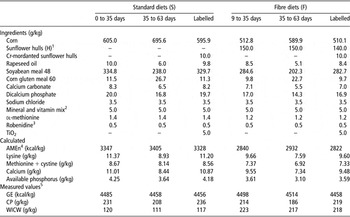
Two standard diets (S) based on corn and soyabean meal were formulated to meet the nutrient requirement of growing birds for the 0 to 35 day and 35 to 63 day periods (Table 1). Fibre diets (F) were made by diluting the S diets with 15% coarse sunflower hulls (H).
Composition of experimental diets

WICW = water-insoluble cell wall; GE = gross energy.
1H contained 83.2% WICW and 4.87% CP (dry matter basis).
2Supplied per kilogram of diet: Co, 0.6 mg; Cu, 20 mg; Fe, 58 mg; I, 2 mg; Mn, 81 mg; Se, 0.2 mg; Zn, 90 mg; vitamin A (retinyl acetate), 15 000 IU; cholecalciferol, 0.107 mg; vitamin E (dl-α tocopheryl acetate), 100 IU; thiamine, 5 mg; riboflavin, 8 mg; calcium pantothenate, 25 mg; cyanocobalamin, 0.02 mg; menadione, 5 mg; pyridoxine hydrochloride, 7 mg; folic acid, 3 mg; biotin, 0.3 mg; niacin, 100 mg; choline, 550 mg; antioxidant, 50 mg.
3Robenz, Alpharma Animal Health, Bridgewater, NJ, USA.
4Calculated values (dry matter basis), for adult cockerels, according to Carré and Brillouet (Reference Carré and Brillouet1989): AMEn = 0.9362 GE (kcal/kg) − 15.38 CP (%) − 25.16 WICW (%)1.2.
5Dry matter basis.
Labelled diets used in the transit studies were prepared by including 0.5% TiO2 and 1% Cr-mordanted H as dietary markers in diets S and F formulated for the 0 to 35 day period. The particle size of TiO2 was comprised between 80 and 200 nm. Mordanting of H with chromium was prepared as described by Uden et al. (Reference Uden, Colucci and Van Soest1980). Before mordanting, the hull particles were sieved and only particles larger than 1.6 mm were kept. Particle size measurements were conducted under wet conditions as described by Péron et al. (Reference Péron, Bastianelli, Oury, Gomez and Carré2005). The geometrical mean diameter (GMD) of H particles of F diets, before pelleting, was 1029 μm. Before diet pelleting, 90% of Cr-mordanted H particles were larger than 2 mm (GMD = 3156 μm). Measured concentrations of markers in labelled diets were 0.20% Cr2O3 and 0.57% TiO2. In the S-labelled pelleted diet, 19.7% of the total Cr2O3 was in the fraction over 0.85 mm, 16.3% in the fraction (0.6 to 0.85 mm), 32% in the fraction (0.3 to 0.6 mm) and 25.2% in the fraction under 0.15 mm. In the F-labelled pelleted diet, 30.5% of the total Cr2O3 was in the fraction over 0.85 mm, 23% in the fraction (0.6 to 0.85 mm), 25.2% in the fraction (0.3 to 0.6 mm) and 9.7% in the fraction under 0.15 mm. GMD of diets were 187 μm and 234 μm for the S and F pelleted diets (<35 days), respectively.
All diets were pelleted before feeding.
The Standard S diet containing 60.5% corn and 33.5% soyabean meal was distributed to all chicks from hatching until 9 days. Then, half birds from each group and each line continued to be fed the S diets, and the other half was fed the F diets.
Feed efficiency and digestion efficiency parameters
Individual growths and feed intakes were measured in group 4 composed of 120 birds (30 birds per treatment (2 lines (D+, D−) × 2 diets (S, F)) between 9 and 20 days of age. Then, a digestive balance experiment was conducted from 20 to 23 days, using the method of total excreta collection with food deprivation periods, as previously described by Péron et al. (Reference Péron, Bastianelli, Oury, Gomez and Carré2005), to determine the AMEn value of diets, and the total apparent protein digestibility.
Digestive organ weight
Measurements of digestive organ weight were performed at 0, 9, 29, 42 and 63 days. Birds were weighed, then euthanized by intracardiac injection (1.5 ml/kg BW) of pentobarbital (Sanofi, Marne la Coquette, France), without previous feed deprivation.
Group 1 (50 chicks (25 D+, 25 D−)) was euthanized at hatching (day 0). The digestive tract was removed and divided into three parts: proventriculus, gizzard and small intestine. The segments were subsequently weighed.
On day 9, all birds from group 2 (n = 34 birds per genotype; all birds fed with the S diet) were euthanized for anatomical dissection. On day 29, all birds from group 3 and 24 birds from group 4 (n = 17 birds per treatment (2 genotypes × 2 diets (S and F)) were euthanized. On day 42, 40 birds from group 4 were euthanized (n = 10 birds per treatment (2 genotypes × 2 diets)) compared to 52 birds from group 4 on day 63 (n = 13 birds per treatment (2 genotypes × 2 diets)). The proventriculus, gizzard, duodenum (from the pylorus to the distal portion of the duodenal loop), jejunum (from the distal portion of the duodenal loop to Meckel’s diverticulum) and ileum (from Meckel’s diverticulum to the ileocaecal junction) were isolated, emptied and weighed. The pancreas was weighed from 29 days.
All digestive organ weights were related to BW and expressed as mg/g BW.
Transit studies – mean retention time (MRT) measurements
Trial 1
At 5 days, after 8-h fasting, birds from group 2 (n = 23 chicks per line) were fed ad libitum the labelled version of the S diet until 9 days. Daily consumption was measured from 8 to 9 days to estimate the rate of intake of markers. Birds’ euthanasia for digestive content sampling started at 0900 h, that is, 8 h after the 1-h dark period (see above). At 9 days, without fasting, chicks were euthanized by intracardiac injection (1.5 ml/kg BW) of pentobarbital (Sanofi). The digestive tract was immediately removed and separated into eight segments (oesophagus + crop, proventriculus, gizzard, duodenum, jejunum, ileum, rectum + cloaca and caeca) with clamps to avoid movement of digesta during the handling of the gut. All of the digestive contents from each segment were transferred into small plastic vials and frozen at −20°C. Empty segments were also weighed (see above).
Trial 2
A second trial was performed from 26 days. After 8 h of feed deprivation, birds from group 3 (n = 11 birds per treatment) were fed the two corresponding labelled diets. Daily consumption was measured from 28 to 29 days to estimate the rate of intake of markers. Birds’ euthanasia for digestive sampling started at 0900 h, that is, 8 h after the 1-h dark period. On day 29, digestive contents were collected as described above for the first trial. Empty organs were also weighed (see above).
Thereafter, all stored digestive contents were freeze-dried, weighed and ground (grinder IKA-WERK A10) for further analyses. The contents of the proventriculus and gizzard were mixed together just as those of the duodenum and jejunum were also mixed.
Analytical methods
The gross energy (GE) value of diets and excreta, and dietary contents of water-insoluble cell wall (WICW) were measured as described by Carré et al. (Reference Carré, Idi, Maisonnier, Melcion, Oury, Gomez and Pluchard2002). Total nitrogen content was determined in diets and excreta using the Kjeldahl method. The uric acid content of excreta was measured using the method of Marquardt (Reference Marquardt1983). The protein nitrogen content of excreta was estimated by subtracting uric acid nitrogen from total nitrogen, in order to calculate total apparent protein digestibility.
The particle size distribution of pelleted diets was assessed by wet sieving as previously described (Péron et al., Reference Péron, Bastianelli, Oury, Gomez and Carré2005), using 10 sieves ranging from 75 to 3150 μm.
TiO2 concentration was determined in labelled diets and in digestive contents by a simplified method of Short et al. (Reference Short, Gorton, Wiseman and Boorman1996): 500 mg of diet or freeze-dried digesta were treated in 20 ml concentrated H2SO4 (95%) at boiling temperature in the presence of a catalyst (Kjeltabs auto, 1.5 g K2SO4 + 7.5 mg Se). After cooling, the solutions were quantitatively transferred into 25 ml volumetric flasks; the volume was adjusted to 25 ml with distilled water. Then, 1.2 ml of each sample solution was transferred into semi-micro cuvettes, and 0.4 ml distilled H2O + 0.4 ml H2O2 (30%) was added. After mixing, the absorbance was measured at 410 nm.
The chromic oxide concentrations in labelled diets and digesta were determined as described by Bolin et al. (Reference Bolin, King and Klosterman1952), with some modifications, as follows: 100 to 500 mg samples were put in previously weighed flasks. Then, they were treated at 220°C for 10 min in 5 ml of an oxidizing solution made by mixing 10 g sodium molybdate, 150 ml concentrated sulphuric acid (95%), 200 ml perchloric acid and 150 ml distilled water. After cooling, 2 ml perchloric acid was added again and solutions were heated at 240°C for 30 min. After cooling, weights of final solutions were determined by weighing flasks. A 0.5 ml aliquot of the solution was weighed and transferred into a small micro-centrifuge tube, and 0.5 ml distilled H2O was added. After a 90 min wait, centrifugation was performed (11400 tr/min, 5 min), and the supernatant was transferred into a spectrophotometer semi-micro cuvette. The absorbance was then immediately read at 440 nm against distilled water.
Calculations
Apparent ME values of diets measured in birds were corrected to zero nitrogen retention (AMEn) as described by Hill and Anderson (Reference Hill and Anderson1958). Calculated AMEn values of diets were obtained using the measured GE, CP and WICW contents of diets, according to Carré and Brillouet (Reference Carré and Brillouet1989):

The measured to calculated AMEn ratio (MCR) was calculated to assess the variations in the digestibility of available food components.
The MRTs in digestive segments were calculated from the ratio between the amount of marker measured in a segment and the daily marker intake (Van der Klis et al., Reference Van der Klis, Verstegen and De Wit1990) using the following equation assuming a steady state of digestive flow:

where 1440 = number of min/day.
Statistical analyses
Data are presented as means ± s.e.m. Analyses of variance were performed using the Statview software (SAS Institute Inc., Cary, NC, USA, 1992 to 1998, version 5.0). Two-way ANOVA analyses were performed to assess the combined effects of line, diet and the interactions between line and diet. If the F-test for treatment effects was significant, differences among treatment means were determined with the Fisher PLSD multi-comparison test. Significance was set at P < 0.05.
Results
Diet composition and particle size
As expected, F diets showed higher WICW content and lower protein contents than S diets, due to dilution by sunflower hulls (Table 1). The proportion of particles over 0.85 mm tended to be higher in the F diet (22.5%) than in the S diet (18.2%) (P = 0.065).
Effect of lines and diets on feed efficiency and digestion efficiencies
Feed efficiency
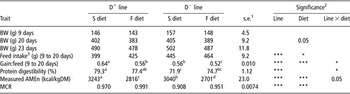
Feed intake was greater (P < 0.001) in D− birds than in D+ birds (Table 2). In both lines, feed intake was greater (P < 0.05) with the F diet than with the S diet. D+ birds showed a higher (P < 0.001) feed efficiency than D− birds. Diet dilution lowered (P < 0.001) feed efficiency by 14.3% and 7.7% in D+ and D− lines, respectively. A line × diet interaction (P < 0.05) was observed on feed efficiency, with a 12.5% difference between lines with the S diet against 7.1% with the F diet.
Protein digestibility and AMEn
D+ birds showed, on average, a 5 percentage unit higher (P < 0.001) protein digestibility than D− birds (Table 2). Although there was no significant diet effect on protein digestibility, an interaction (P < 0.05) was observed between line and diet: the difference between lines was reduced from 7.4 to 2.7 percentage units with the F diet compared to the S diet, and digestibility tended to be improved by the dilution in D− birds, whereas it tended to be decreased in D+ birds (Table 2). AMEn and MCR were, on average, 5.5% higher (P < 0.001) in D+ birds than in D− birds. AMEn was reduced (P < 0.001) with the F diet. However, the AMEn difference between lines was reduced by 36% with the F diet compared to the S diet, resulting in an interaction (P = 0.054). MCR was improved (P < 0.001) in both lines by diet dilution.
Effects of experimental diets (standard (S) v. fibres (F) diets) and genetic lines (D+ v. D−) on growth performances, feed intake, feed efficiency (9 to 20 days), protein digestibility, AMEn and (measured AMEn/calculated AMEnFootnote 4) ratio (MCR) (20 to 23 days)

a,b,c,d Means with different superscripts within a row are significantly different (P < 0.05).
1 n = 30.
2 P-values are indicated by *P < 0.05; **P < 0.01; ***P < 0.001. Blank cells indicate non-significant effect.
3 Dry matter basis.
4 Calculated AMEn = 0.9362 GE (kcal/kg) − 15.38 CP (%) − 25.16 WICW (%)1.2 (Carré and Brillouet, Reference Carré and Brillouet1989).
Effects on digestive organ weights
Comparison of organ growth between lines from 0 to 63 days (S diet)
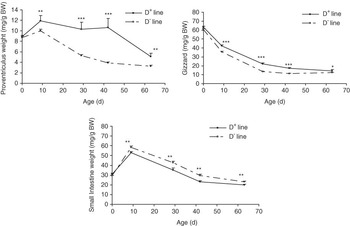
Except for the duodenum (P > 0.05), genotype had an influence on organ relative weight (RW) from 9 days onwards. No difference could be detected at hatching (Figure 1). From 9 days, D+ birds had higher proventriculus (P < 0.01) and gizzard (P < 0.05) RW, higher ((gizzard + proventriculus)/small intestine) weight ratio (GPIR) (P < 0.001), smaller ileum (P < 0.01) and intestine (P < 0.01) RW than D− birds (Figure 1; Table 3). Jejunum RW was smaller (P < 0.05) in D+ compared to D− birds from 29 days (Table 3).
Effects of divergent genetic lines (D+ v. D−) on digestive organ relative weight (mean ± s.e.) at hatching (n = 25), 9 days (n = 34), 29 days (n = 17), 42 days (n = 10) and 63 days (n = 13). Chicks were fed with the standard (S) pelleted diets. P < 0.05; **P < 0.01; ***P < 0.001.

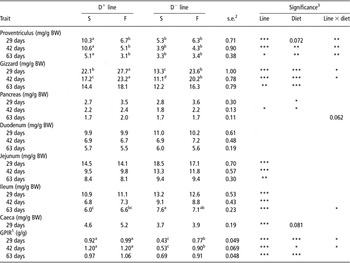
Effects of experimental diets (standard (S) v. fibres (F) diets) and genetic lines (D+ v. D−) on digestive relative organ weight (mg/g BW) from 29 to 63 days

1GPIR = ((gizzard + proventriculus)/small intestine) weight ratio.
2n = 17 at day 29, n = 10 at day 42, and n = 13 at day 63.
3P-values are indicated by *P < 0.05; **P < 0.01; ***P < 0.001. Blank cells indicate non-significant effect.
a,b,cMeans with different superscripts within a row are significantly different (P < 0.05).
From 29 days, enlarged proventriculi were observed on several D+ birds fed the S diet, resulting in high RW means and high standard errors (Figure 1).
Differences in gut anatomy between lines were considerably reduced at 63 days. RW of the gizzard was maximal at hatching and decreased with age until 63 days (Figure 1). RW of the proventriculus and of the small intestine increased from hatching until 9 days and then decreased until 63 days (Figure 1). GPIR decreased sharply from hatching to 9 days and then showed much less variation until 63 days.
Combined effects of lines and diets on digestive organ weights (29 to 63 days)
With both diets, D+ birds had greater (P < 0.05) proventriculus and gizzard RW, and a greater GPIR than D− birds. With both diets, D+ birds had smaller (P < 0.01) RW of the jejunum and ileum than D− birds (Table 3). No significant effect was observed on the duodenum, irrespective of the age of birds.
RW of the gizzard and pancreas were increased (P < 0.05) by diet dilution (Table 3). From 29 to 63 days, the RW of the gizzard was, on average, about 40% higher with the F diet than with the S diet. The increase in gizzard RW was stronger in D− birds than in D+ birds, resulting in an interaction (P < 0.05) between line and diet at 29 and 42 days (Table 3). Strong line × diet interactions (P < 0.01) were observed on proventriculus RW throughout the study: there was no diet effect in D− birds, whereas RW was reduced in D+ birds with the F diet compared to the S diet (Table 3).
There was only a slightly higher (P < 0.05) pancreas RW in D+ than in D− birds at 42 days. A positive effect of the F diet (P < 0.05) was observed on pancreas RW at 29 and 42 days in both lines, which disappeared at 63 days. Pancreas RW was increased (P < 0.05) with the F diet in both lines, at 29 and 42 days.
The RW of small intestine parts (duodenum, jejunum and ileum) were not affected by diet throughout the study (Table 3).
Caeca were observed to be bigger in D+ than in D− birds (P < 0.001; Table 3).
GPIR was, on average, 50% higher in D+ than in D− birds (P < 0.001), with the smallest difference between lines at 63 days (Table 3). The F diet resulted in higher GPIR compared to the S diet, only in D− birds. No diet effect was observed on GPIR in D+ birds (Table 3). The relative difference in GPIR of 120% between D+ and D− birds fed on the S diet was reduced to 30% with the F diet, at 29 and 42 days of age (Table 3). This line × diet interaction on GPIR was not observed any more at 63 days (Table 3).
Effects of lines and diets on digestive transit times
Comparison of digesta MRT between lines at 9 days
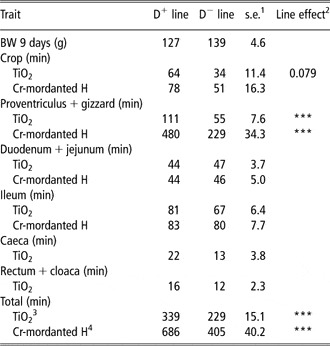
The MRT in the entire digestive tract was about 60% longer (P < 0.001) in D+ birds than in D− birds for both markers (Table 4). Total MRTs were about twice longer with Cr-mordanted H than with TiO2. MRTs in the upper digestive compartments, namely the (Proventriculus + gizzard) system (P + G), were twice longer in D+ birds than in D− birds. MRTs in the small intestine were similar (P > 0.05) for both lines with both markers.
Effects of genetic lines (D+ v. D−) on mean retention time (MRT) (min) of two dietary markers (TiO2 and Cr-mordanted H) in 9-day-old birds fed the standard labelled pelleted diet

1n = 23.
2P-values are indicated by *P < 0.05; **P < 0.01; ***P < 0.001. Blank cells indicate non-significant effect.
3From crop to cloaca.
4From crop to terminal ileum.
MRTs in P + G were much longer for Cr-Mordanted H than for TiO2, whereas they were similar in intestine segments. Shortest MRTs were observed in (Rectum + cloaca) and caeca (Table 4).
Effects of lines and diets on TiO2 MRT at 29 days
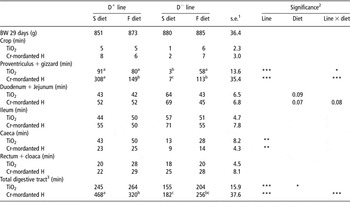
The MRT in the total digestive tract was longer (P < 0.001) in D+ than in D− birds with both diets (Table 5). The MRT in the P + G compartment was much longer (P < 0.001) in D+ birds than in D− birds with the S diet, while with the F diet, no significant difference was observed. Feeding the F diet instead of the S diet resulted in increased MRT in the P + G compartments for D− birds but not for D+ birds.
Effects of experimental diets (standard S v. fibre F labelled diets) and genetic lines (D+ v. D−) on mean retention time (min) of TiO2 and Cr-Mordanted H in segments of the gastrointestinal tract in 29 day-old chickens

1n = 11.
2P values indicated by *P < 0.05; **P < 0.01; ***P < 0.001. Blank cells indicate non-significant effect.
3From crop to cloaca.
a,b,cMeans with different superscripts within a row are significantly different (P < 0.05).
MRT in the caeca was longer (P < 0.05) in D+ birds than in D−birds. Neither line effect nor diet effect was observed on MRT in the other digestive segments (Table 5).
Effects of lines and diets on MRT of Cr-mordanted H at 29 days
Total MRT was much longer (P < 0.001) in D+ than in D− birds with the S diet, whereas this was not significantly different with the F diet (Table 5). Total MRT decreased in D+ line with the F diet, whereas it was not significantly affected in D− line. MRT values in P + G were much longer (P < 0.001) in D+ birds than in D− birds with the S diet and did not differ between lines with the F diet. MRT was decreased with the F diet in D+ birds, whereas it was increased in D− birds (Table 5).
MRT of Cr-Mordanted H tended to be longer than MRT of TiO2 in the P + G compartment, whereas they were rather similar in other compartments except in caeca that showed the highest MRT for TiO2 (Table 5).
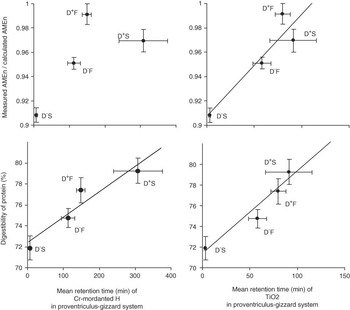
Relationships between digestion efficiencies at 3 weeks of age and MRTs in the proventriculus-gizzard system at 4 weeks in D+ and D− chickens fed on S or F diets were significant (P < 0.05) except for the relationship between MCR and mean retention time of Cr-mordanted H (Figure 2).
Relationships between digestion efficiencies (mean and s.e.; n = 30) at 3 weeks of age and mean retention times (mean and s.e.; n = 11) in the proventriculus-gizzard system at 4 weeks in chickens from D+ and D− genetic lines fed on the S or F diets. Relationships were significant (P < 0.05) except for the relationship between (measured AMEn/calculated AMEn) and mean retention time (min) of Cr-mordanted H.

Comparison of MRT between ages
For both lines, in birds fed the S diet, total MRTs obtained with TiO2 and with Cr-Mordanted H were lower (P < 0.05) at 29 days than at 9 days (Tables 4 and 5). This was especially due to a decrease in retention time in the upper digestive segments and a tendency to decrease in the ileum.
Discussion
Relationships between genes and digestive functions have been extensively studied using knockout animals (Choi et al., Reference Choi, Gibbons, Roeder, Lurken, Zhu, Wouters, Miller, Szurszewski and Farrugia2007) or polymorphism genotyping (Yeo et al., Reference Yeo, Boyd, Lumsden, Saunders, Handley, Stubbins, Knaggs, Asquith, Taylor, Bahari, Crocker, Rallan, Varsani, Montgomery, Alpers, Dukes, Purvis and Hicks2004). Very few studies have been conducted using genetic lines selected on quantitative digestive parameters. In this regard, D+ and D− divergent genetic chicken lines represent a unique model. The interest in using such genetic lines lies in that a hierarchy in genetic determinants can be proposed. This study shows that gastric retention time can be a major factor explaining individual genetic variations in chicken digestion efficiency. These results will be of great help in the proposal of candidate genes, when quantitative trait locus (QTL) analyses will be performed with these lines.
For the small intestine, no significant relationship was observed between individual retention times and relative weights of corresponding digestive compartments. In contrast, strong positive relationships (0.34 < R 2 < 0.44; P < 0.001) were observed for the gastric compartment. This is in agreement with the observation of a longer gizzard MRT (adjusted to a mean BW) associated with a larger gizzard RW in Leghorn than in broiler chickens (Shires et al., Reference Shires, Thompson, Turner, Kennedy and Goh1987). Therefore, variations in proventriculus and gizzard weights can be extended to variations in gastric retention times. Thus, the relationships between digestion efficiency and gizzard or proventriculus weights observed in current and previous studies in D+ and D− lines (Péron et al., Reference Péron, Gomez, Mignon-Grasteau, Sellier, Besnard, Derouet, Juin and Carré2006; García et al., Reference García, Gomez, Mignon-Grasteau, Sellier and Carré2007; Rougière et al., Reference Rougière, Gomez, Mignon-Grasteau and Carré2009) may be accounted for by a positive effect of gastric retention time on digestion efficiency. This is in agreement with the statement that gastric emptying is key to small intestine efficiency (Kelly, Reference Kelly1981). However, reports of relationships between gastric retention time and efficiency of the small intestine are very scarce. Fledderus et al. (Reference Fledderus, Bikker and Kluess2007) observed this relationship in piglets by varying diet composition. Kirby et al. (Reference Kirby, Howles and Hui2004) varied both pharmacological treatment and genetic origin of animals to obtain in mice such a relationship. This relationship was observed in our study (Figure 2) by combining variations coming both from diet composition and animal genetics.
Differences in gizzard and proventriculus weights between D+ and D− lines were already observed in previous studies (Péron et al., Reference Péron, Gomez, Mignon-Grasteau, Sellier, Besnard, Derouet, Juin and Carré2006; García et al., Reference García, Gomez, Mignon-Grasteau, Sellier and Carré2007; Rougière et al., Reference Rougière, Gomez, Mignon-Grasteau and Carré2009). This study shows that this difference is a transient phenomenon associated with growth, appearing during the early stage and decreasing in the last stage of growth. This was consistent with a previous study showing a similar transient difference in residual feed intake between D+ and D− lines (Carré et al., Reference Carré, Mignon-Grasteau, Svihus, Péron, Bastianelli, Gomez, Besnard and Sellier2005b).
Feed intake was observed to be higher in D− than in D+ birds, whereas gizzard and proventriculus were bigger in D+ than in D− birds. These reversed differences exclude the hypothesis that a difference in feed intake can explain differences in gizzard and proventriculus sizes between lines. However, this does not exclude the fact that feeding is an important interacting factor. The main interactive feeding factor would not concern quantity. This would concern feeding quality regarding rheologic properties of feed particles. This is supported by the fact that fibre addition in diets considerably reduced differences between lines regarding proventriculus and gizzard sizes. Fibre added in the F diet displayed bigger particle size than the remaining part of the diet. A previous study showed that feed particle size was an important interactive factor in the differences between D+ and D− lines (Rougière et al., Reference Rougière, Gomez, Mignon-Grasteau and Carré2009). However, it is probable that the coarse appearance of the fibre is not their only property that could affect gizzard growth, as it was also previously observed that feeding different sources of fibre could result in different gizzard sizes with no explanation from particle size differences (Gonzalez-Alvarado et al., Reference Gonzalez-Alvarado, Jimenez-Moreno, Valencia, Lazaro and Mateos2008). It was previously proposed that the flexibility of particles was probably an important property of particles explaining their gizzard retention time (Ferrando et al., Reference Ferrando, Vergara, Jimenez and Gonalons1987), with, probably, a subsequent consequence on gizzard growth.
From these observations, it can be deduced that feeding participated in proventriculus and gizzard growths, and that chicken sensitivity to feeding stimulations differed between D+ and D− lines.
It is noteworthy that the pattern of line × diet interactions differed between gizzard and proventriculus growth. In D+ birds, fibre addition reduced the proventriculus, whereas it increased the gizzard size. This was not observed in D− birds. Great variabilities in gizzard and proventriculus sizes were observed in D+ birds. These variabilities were abolished when the (proventriculus + gizzard) sum was considered, with no diet effect on this sum in D+ birds. Therefore, it seems that, in D+ birds, the gizzard undergrowth observed with the S diet was compensated by a proventriculus overgrowth. It is possible that, in D+ birds, stimulation by the S diet was not sufficient for reaching the potential of gizzard growth, which resulted in a small gizzard with insufficient grinding power in these birds and subsequent stay of big particles in the proventriculus-gizzard system. This was reflected by MRT values of big particles in the proventriculus and gizzard system, higher with the S diet than with the F diet in D+ birds. Therefore, for D+ birds fed the S diet, feeding stimulus was probably not sufficient for gizzard growth and grinding power, then, proventriculus completed gizzard in regard to its storage function. Feeding only small particles to chickens was already shown in the past to result in an enlarged proventriculus (O’Dell et al., Reference O’Dell, Newberne and Savage1959). Our results show that this phenomenon depends on the genetic origin of birds.
It was previously proposed that, in chickens, particles are delivered from the gizzard to the duodenum only if their size is lower than a critical value (Vergara et al., Reference Vergara, Ferrando, Jimenez, Fernandez and Gonalons1989a). According to our results, it can be hypothesized that this critical size was smaller in D+ than in D− birds, and was decreased by particle stimulation only in D− birds. This critical size would control gastric emptying and the amount of feed remaining in the proventriculus-gizzard system. Thereafter, gizzard growth and grinding power would be stimulated by particles in the gizzard. Avian gastric motility and emptying can be controlled through several pathways involving cholecystokinin (Martinez et al., Reference Martinez, Jimenez, Gonalons and Vergara1993) or avian pancreatic polypeptide (Duke et al., Reference Duke, Kimmel, Redig and Polluk1979). Future works should examine how these pathways are involved in D+ and D− birds. Neurologic approaches through examination of stretch responsive genes, such as those coding for nitric oxide synthase (Mashimo and Goyal, Reference Mashimo and Goyal1999), should also be considered. Another matter of consideration for future works should concern interstitial cells of Cajal that are involved in the neurology of the avian gizzard (Reynhout and Duke, Reference Reynhout and Duke1999).
In contrast with the gizzard, no significant effect was observed on MRT in the crop (Tables 4 and 5). Digesta were retained shortly in the crop, as found in broilers by Shires et al. (Reference Shires, Thompson, Turner, Kennedy and Goh1987). Birds were fed ad libitum, which probably resulted in continuous feeding without any meal effect, as is usually observed in chickens. Therefore, feed was probably not stored in the crop and passed directly to the gizzard, which would explain the very short MRT measured in the crop.
Duodenum weight was not affected at all by line and dietary factors, whereas other intestinal segments were affected, which was similar to results found in a previous study (Rougière et al., Reference Rougière, Gomez, Mignon-Grasteau and Carré2009). The jejunum and ileum were heavier in D− than in D+ birds, as previously found (Rougière et al., Reference Rougière, Gomez, Mignon-Grasteau and Carré2009), with line effects appearing and decreasing along growth, in the same time as the line effects observed for weight of the proventriculus-gizzard system. Therefore, growths of the small intestine and proventriculus-gizzard system were closely associated. The intestine enlargement observed in D− compared to D+ birds was probably an adaptation process trying to counteract the digestive disorders occurring in D− birds.
The digestive anatomy of white Leghorn compared to broiler chickens showed similar trends to that of D+ compared to D−, with a bigger gizzard and smaller intestine in white Leghorn than in broiler chickens (Shires et al., Reference Shires, Thompson, Turner, Kennedy and Goh1987). This suggests that, among chickens from various genotypes, there is perhaps a general negative relationship between gizzard and intestine weights.
No diet effect was observed on compartment weights of the small intestine, whereas strong diet effects were observed on the weight of the proventriculus-gizzard system. This lack of fibre effect on small intestine weight could be explained by two conflicting effects produced by fibre addition. On the one hand, the bulking effect of fibre would induce a positive effect on intestinal growth (Savory and Gentle, Reference Savory and Gentle1976). On the other, improved gizzard functions due to fibre would be negative on intestinal growth, as similarly observed in current and previous experiments (Péron et al., Reference Péron, Gomez, Mignon-Grasteau, Sellier, Besnard, Derouet, Juin and Carré2006; Rougière et al., Reference Rougière, Gomez, Mignon-Grasteau and Carré2009) for the genetic line effects. Therefore, these two opposite effects acting together would result for our experiment in no significant effect of fibre on intestinal growth.
Considering that a long time is generally required for intestinal fermentation processes, MRT observed for caeca (9 to 50 min) could seem rather low. Moreover, Vergara et al. (Reference Vergara, Ferrando, Jimenez, Fernandez and Gonalons1989a) observed a much longer retention time for the liquid phase entering the caeca. In fact, caeca MRT measured in our experiment represented a mean value taking account of all particles, including those entering the caeca and those not entering the caeca. Therefore, most of the variations in caeca MRT reported here probably reflected variations in the percentage of particles entering the caeca. In this regard, caeca MRTs were shorter for Cr-mordanted H than for TiO2, which is consistent with the fact that, in chickens, proportions of particles entering the caeca are lower for big than for small particles (Ferrando et al., Reference Ferrando, Vergara, Jimenez and Gonalons1987; Vergara et al., Reference Vergara, Ferrando, Jimenez, Fernandez and Gonalons1989a).
Caeca functions were less developed in D− than in D+ birds, as shown by lower caeca weight and MRT in D− than in D+ birds. Variability in caeca weight and functions in growing chickens was already observed in the past, according to the genetic origin of birds (Maisonnier et al., Reference Maisonnier, Gomez, Chagneau and Carré2001) or according to the quality of diets (Carré et al., Reference Carré, Flores and Gomez1995).
Effects observed on the pancreas were similar to those previously observed (Rougière et al., Reference Rougière, Gomez, Mignon-Grasteau and Carré2009). However, the great number of animals investigated in the current study could improve the significance of statistical analyses. Therefore, by combining all the individual data obtained at different ages, the covariance analysis considering the pancreas weight as a function of BW, diets and lines showed that the pancreas was biggest in D+ (+8%; P < 0.05) compared to D− birds, and in the F diet-fed birds (+12%; P < 0.001) compared to those fed on the S diet. Combining all the individual data, the pancreas weight was observed to be positively associated (R 2 = 0.16; P < 0.001) with gizzard weight (calculation performed on residual values from linear regressions giving organ weights as a function of BW), which suggests a common pathway for regulation of growths of the pancreas and gizzard. Individual pancreas weight did not show a significant relationship with other digestive organ weights (calculations performed on residual organ weights) except with the duodenum (positive relationship: R 2 = 0.07; P < 0.05).
Evolution of total MRT from 9 to 29 days of age was consistent with previous studies indicating a decrease in MRT with the growth of the chicken (Vergara et al., Reference Vergara, Jimenez, Ferrando, Fernandez and Gonalons1989b). This decrease could be explained by increased feed intake relative to BW during the first few weeks of growth, as hypothesized by Vergara et al. (Reference Vergara, Jimenez, Ferrando, Fernandez and Gonalons1989b).
In conclusion, this study showed that MRT in the proventriculus-gizzard system was a major factor associated with genotype differences between the D+ and D− genetic chicken lines selected for divergent digestion efficiency, with longer MRT found in D+ than in D− birds. Differences in digestion efficiency and proventriculus-gizzard MRTs between lines were both markedly reduced by adding coarse fibre in diets. The variation in proventriculus-gizzard MRT was positively associated with proventriculus-gizzard RW and digestion efficiencies, with variations coming either from genotypes or from diets. Therefore, proventriculus-gizzard MRT is probably a major limiting factor for digestion efficiencies in chickens.
No significant effect of line (D+ v. D−) or fibre addition was observed on MRT in compartments of the small intestine. Variations in pancreatic RW were positively associated with variations in gizzard relative weight. Differences in gut anatomy between D+ and D− lines were observed to be a transient phenomenon appearing at 9 days of age and almost disappearing at 63 days.
The current study provides useful information for the research of candidate genes involved in the divergent genetic selection of D+ and D− chicken lines. It also provides practical information about the techniques to be used for selecting improved digestion efficiency in broilers. According to our results, this could be done on the basis of the gizzard RW measured during the rapid growth period in birds fed a common industrial feed.
Acknowledgements
The authors are grateful to Inzo (Chateau-Thierry, France) and the French Research Ministry for a CIFRE financial grant, and to Mr P. Chervier (SAIPOL Lezoux, France) for providing the sunflower hulls. We thank Dr Sandrine Mignon-Grasteau (INRA Nouzilly) for helpful discussions and for her participation in the supply of D+ and D− chickens. We thank Ms Nadine Sellier and Mr J.-D. Terlot for the breeder management, Mr K. Gérard and Ms F. Favreau for helpful assistance in bird experiments, and all persons who helped collect samples for anatomical determinations.