INTRODUCTION
Biochar is pyrolyzed carbon (PyC) derived from the incomplete combustion of biomass. When incorporated into soil, biochar has the potential to provide long-term carbon sequestration that is potentially able to offset a significant fraction of anthropogenic emissions (Woolf et al. Reference Woolf, Amonette, Street-Perrott, Lehmann and Joseph2010; Wang et al. Reference Wang, Xiong and Kuzyakov2016). However, biochar includes a range of carbon compounds with variable degrees of resistance to degradation (Bird et al. Reference Bird, Ayliffe, Fifield, Cresswell and Turney1999; Kanaly and Harayama Reference Kanaly and Harayama2000; Hammes et al. Reference Hammes, Torn, Lapenas and Schmid2008; Bird et al. Reference Bird, Wynn, Saiz, Wurster and McBeath2015).
The degree to which biochar is susceptible to degradation is controlled by the temperature of pyrolysis, the nature of the material pyrolized and environmental conditions that influence the activity of microbial communities and organo-mineral interactions during degradation (e.g. soil type, temperature, moisture, pH and Ca2+ availability (Pietikäinen et al. Reference Pietikäinen, Kiikkilä and Fritze2000; Hockaday et al. Reference Hockaday, Grannas, Kim and Hatcher2007; Whittinghill and Hobbie Reference Whittinghill and Hobbie2012; Bird et al. Reference Bird, McBeath, Ascough, Levchenko, Wurster, Munksgaard, Smernik and Williams2017). Recent research has mostly emphasized the role of microbial degradation of biochar (e.g. Forbes et al. Reference Forbes, Raison and Skjemstad2006; Fang et al. Reference Fang, Singh, Singh and Krull2014; Kuzyakov et al. Reference Kuzyakov, Bogomolova and Glaser2014; Tilston et al. 2016) and these studies have directly demonstrated respiration of PyC using both 13C/12C and radiocarbon (14C) as tracers of PyC conversion into CO2, microbial biomass, and soil organic carbon. In contrast, a year-long in-vitro experiment by Zimmerman (Reference Zimmerman2010) found abiotic CO2 production rates equivalent to those of microbial oxidation in several types of biochars.
Recently Bird et al. (Reference Bird, McBeath, Ascough, Levchenko, Wurster, Munksgaard, Smernik and Williams2017) examined the controls on the degradation of biochars produced at different temperatures from radiocarbon-free wood by subjecting them to different physico-chemical treatments over three years in a humid tropical rainforest soil in NE Australia. Mass balance calculations and measurements of 14C concentration in the biochars demonstrated a strong relationship between degradation and loss of indigenous (biochar) carbon, with carbon losses offset to various degrees by the simultaneous addition of exogenous (leaf litter derived) carbon from the local environment. High net carbon loss in biochars pyrolized at 300ºC implied a relatively rapid total degradation of the material to gaseous or solubilized forms over a few decades. Substantially lower net losses of C in biochar pyrolized at 500ºC showed these biochars to be comparatively resistant to degradation. The strong relationships between loss of indigenous carbon from the degraded biochars and amount and δ13C values of CO2 efflux in incubation trials led to two main hypotheses, which remained unproven: (1) biochar degradation was predominantly microbial, and (2) high local Ca2+ concentrations immobilized degradation products in situ at high pH (see also Oades Reference Oades1988), rather than leaching and loss of degradation products at low pH.
Here we present new evidence of the role of microbial activity in the degradation of the biochar samples previously studied by Bird et al. (Reference Bird, McBeath, Ascough, Levchenko, Wurster, Munksgaard, Smernik and Williams2017). We determined the efflux rate of CO2 in in-vitro incubation experiments and measured both 14C concentration and δ13C values in the CO2 efflux with the aim of quantifying the contributions of indigenous radiocarbon-free PyC and exogeneous C sources to CO2 efflux from degrading biochar. We also tested the hypothesis that high local Ca2+ concentrations lead to the immobilization of degradation products on the biochars.
METHODS
Biochar Samples
Detailed characteristics of the initial biochar material and the field trial was reported by Bird et al. (Reference Bird, Levchenko, Ascough, Meredith, Wurster, Williams, Tilston, Snape and Apperley2014, Reference Bird, McBeath, Ascough, Levchenko, Wurster, Munksgaard, Smernik and Williams2017). In brief, a ca. eight million year old wood log obtained from a brown coal seam was pyrolyzed at 305, 414, or 512ºC using the system described by Bird et al. (Reference Bird, Wurster, de Paula Silva, Bass and de Nys2011). The radiocarbon contents of the initial biochars were negligible and the TOC content and the proportion of stable polycyclic aromatic carbon (SPAC) at high temperature increased with increasing temperature of pyrolysis (McBeath et al. Reference McBeath, Wurster and Bird2015). As temperature increases, the number of carbon rings increases, leading to the development of recalcitrant microcrystalline graphitic sheets (Preston and Smith Reference Preston and Schmidt2006; McBeath et al. Reference McBeath, Wurster and Bird2015). The biochar was used in a three-year environmental degradation trial at the James Cook University Daintree Rainforest Observatory, Cape Tribulation, Queensland (16.103ºS; 145.447ºE; 70 m asl). This site is in a hot (mean monthly temperature ranging from 22 to 28ºC) and humid (3500 mm annual rainfall) rainforest environment, where interactions between biochars and the environment can be expected to be comparatively rapid.
In the field trial, aliquots of each biochar type contained in triplicate 125 μm aperture nylon mesh bags, were pegged to the soil surface from June 2009 to August 2012 and subjected to one of the following four treatments: (i) NL—all litter removed from the surface and aliquots laid directly on the soil surface; (ii) L—as for NL but aliquots then covered with a ~5 cm thick layer of local leaf litter replenished each six months; (iii) NL-LM—as for NL but aliquots then covered with a ~5 cm thick layer of limestone chips (sieved at 2–10 mm); (iv) L-LM—as for NL but aliquots covered with a layer of limestone chips (sieved at 2–10 mm) mixed with an equal volume of periodically replenished local leaf litter each six months. The purpose of the limestone chips was to increase local pH, as alkaline conditions have been shown to be a significant determinant of PyC degradation behaviour (Braadbaart et al. Reference Braadbaart, Poole and Van Brussel2009; Huisman et al. Reference Huisman, Braadbaart, van Wijk and van Os2012).
Following three years of environmental exposure, Bird et al. (Reference Bird, McBeath, Ascough, Levchenko, Wurster, Munksgaard, Smernik and Williams2017) identified correlated increases in ash content (mineral matter after combustion at 550ºC), mass of organic carbon, radiocarbon concentration and decrease in δ13C values in the biochars. The changes were more substantial in 300ºC compared to 500ºC biochars and there were substantial changes in both biochar types according to their physicochemical treatment. The changes were most pronounced in the no-litter (NL) treatments, followed by the changes in the litter (L) treatments while both the no-litter—limestone (NL-LM) and litter—limestone (L-LM) treatments were the least changed after three years.
In Vitro Incubations and δ 13 C CO2 and 14 C CO2 Measurements
In the present study we conducted two in-vitro experiments to measure the rate and isotopic composition of CO2 efflux from the field-exposed degraded biochar samples. A small-volume experiment was initially carried out over 66 days to investigate whether there were changes in the rate of CO2 production and whether changes in C sources may be revealed through changes in the stable isotopic composition of the CO2 efflux. Subsequently we conducted a second shorter-term (14–18 days) in-vitro experiment to produce larger sample volumes necessary for the measurements of CO2 14C concentration.
In the longer-term experiment, aliquots (≈80 mg) of dried 300ºC and 500ºC biochar (each treatment in duplicate) were placed on a wet pre-combusted quartz sand bed (≈750 mg) in 12 mL capacity Exetainer vials sealed with a septum cap for incubation in the dark at 25ºC over 66 days, with no applied nutrient source. Milli-QTM grade water, filtered at 0.2 µm and UV-sterilized was added to the surface level of the combusted sand. The wet sand base provided a stable source of moisture available by capillary action without saturating the samples over the course of the experiment. Vials were filled with CO2-free air immediately after sample loading. No new microbial material was added as the purpose was to measure the response of a reinvigorated microbial population present on the biochars in relation to the labile carbon supply inferred to exist based on the radiocarbon measurements of Bird et al. (Reference Bird, McBeath, Ascough, Levchenko, Wurster, Munksgaard, Smernik and Williams2017).
Duplicate samples of the pre-exposure 300 and 500ºC biochar and two vials with wet sand only (blanks) were included in the incubation experiment. The volumetric concentration and δ13C values of the evolved CO2 were measured after 1, 4, 7, 11, 18, 30, 38, 49, and 66 days of incubation using a Wavelength-Scanned Cavity Ring-down Spectrometer (Picarro G2131-i). Vial gases were extracted and supplied to the spectrometer via a syringe penetrating the vial septum with simultaneous entry of CO2-free air through a second syringe. This procedure allowed for the maintenance of sufficient O2 to support CO2 production throughout the incubation period. The Picarro G2131-i records CO2 concentration and δ13C values at approximately 1 Hz. Integrated CO2 and δ13C values over the ≈2–5 min analysis time (dependent on CO2 concentration) were derived using an in-house Excel™ calculation template. The integration window was selected to include all data sets with CO2>40 ppm vol. Calibration of concentration values were carried out by analysis of CO2-free air and a certified CO2-in-air standard gas (1050 ppm vol) and δ13C values were calibrated to the VPDB scale by analysing CO2 evolved from two in-house carbonate standards (δ13C=–4.67‰, –24.23‰) tied to the certified reference materials NBS-18 and NBS-19. Precision of the δ13CCO2 measurement is ±1‰.
A shorter-term, up-scaled incubation experiment was used to produce larger CO2 samples for 14C analysis. A 200–1000 mg aliquot (depending on expected reactivity) of each biochar was placed on a ≈10 g pre-combusted wetted quartz sand bed in 300 mL Pyrex flasks, equipped with high vacuum greaseless stopcocks and Viton-O-ring seals, for incubation in the dark at 25ºC for 14–18 days. Flask were filled with CO2-free air immediately after sample loading. Two empty flasks were included as blanks. At the end of the incubation period 12 mL gas samples were extracted from the experimental flasks with a syringe and transferred into Exetainer vials for measurement of δ13C values as described above. The remaining volume of gas was extracted and CO2 purified and transferred into sealed quartz tubes using a cryogenic vacuum system. Carbon dioxide samples were graphitized and AMS 14C measurements carried out using the ANTARES facility at the Australian Nuclear Science and Technology Organisation (ANSTO; Fink et al. Reference Fink, Hotchkis, Hua, Jacobsen, Smith, Zoppi, Child, Mifsud, van der Gaast, Williams and Williams2004). Raw measurement results were corrected for possible contamination in graphitization stage only (Hua et al. Reference Hua, Jacobsen, Zoppi, Lawson, Williams, Smith and McCann2001). All results are reported as percent modern carbon (pMC) and precision (1σ) ranged from 0.26–0.82 pMC (see Bird et al. Reference Bird, Levchenko, Ascough, Meredith, Wurster, Williams, Tilston, Snape and Apperley2014 for further method details).
Calcium Analysis of Biochars
To assess the potential transport of calcium from soil, leaf litter and limestone into biochar samples during the three-year field trial we undertook water and acid extractions of all biochar samples. Aliquots of ≈0.5 g biochar were first extracted in 5 mL of deionized water over a 14-day period. Upon completion, all extracts were mildly to moderately acidic (pH=4.1–6.8). The extraction residues were then subjected to a further 24-hr extraction in 5 mL of 5% HNO3. Calcium concentrations were analyzed by inductively coupled plasma mass spectrometry (ICPMS). Analytical quality control included analysis of certified reference waters, replicate samples and spiked samples.
RESULTS
Short-Term Incubation Experiments
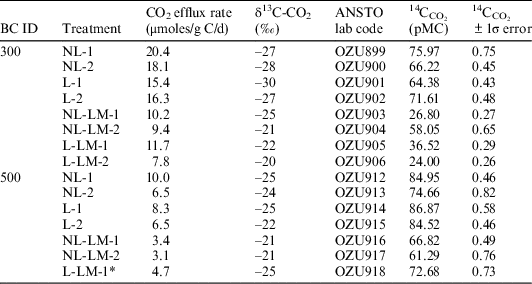
The rate of CO2 efflux was significantly (p=0.002) higher in the 300ºC (13.7±4.5 μmoles/g C/d) compared to the 500ºC biochars (6.1±2.5 μmoles/g C/d) across all treatments in the short-term (14–18 days) incubation experiment (Table 1). There was also a significant (p=0.018) difference in 14C concentration in CO2 derived from the two biochars. The lower pMC (percent modern carbon) produced from the 300ºC biochar (range 24–76, mean 53, n=8) compared to the 500ºC biochar (range 61–87, mean 76, n=7) across all treatments (Table 1) suggest that less modern C and/or more radiocarbon-dead C is available for conversion to CO2 in the 300ºC biochar compared to the 500ºC biochar.
CO2 efflux rate and δ13C values and 14C concentration in CO2 derived from the short-term (14–18 days) incubation experiment of two biochars (300ºC, 500ºC) each subjected to 4 different physico-chemical treatments during three years of environmental exposure (NL: no litter; L: litter; NL-LM: no litter; limestone; L-LM: litter, limestone; field replicates are indicated by appended number). pMC=percent modern carbon.

* Replicate sample L-LM-2 failed AMS analysis.
In contrast to CO2 efflux rate and 14CCO2 concentration there was no significant (p=0.12) difference in δ13C-CO2 values derived from the 300ºC and 500ºC biochars in the short-term incubation experiment. However, δ13C values varied substantially between treatments, with the lowest δ13C values (–27 to –30‰) recorded in the L and LM (no limestone) treatments of the 300ºC biochar while the highest δ13C values were measured in the NL-LM and L-LM (with limestone) treatments of both 300ºC and 500ºC biochars (Table 1).
The variation in CO2 efflux rate and 14CCO2 concentration in replicate field samples reflects unavoidable differences in the individual field placements including the thickness of covers, ingress of exogenous matter and water as well as rate of microbial colonization.
Calcium concentrations in the initial biochar samples before environmental exposure were <10 mg/kg (sum of water and acid extraction, see Supplementary Material File 1). After three years of environmental exposure biochars covered with limestone had gained substantially higher amounts of Ca (≈300–1200 mg/kg, n=8) than biochars without limestone cover (≈115–185 mg/kg, n=8).
Long-Term Incubation Experiments
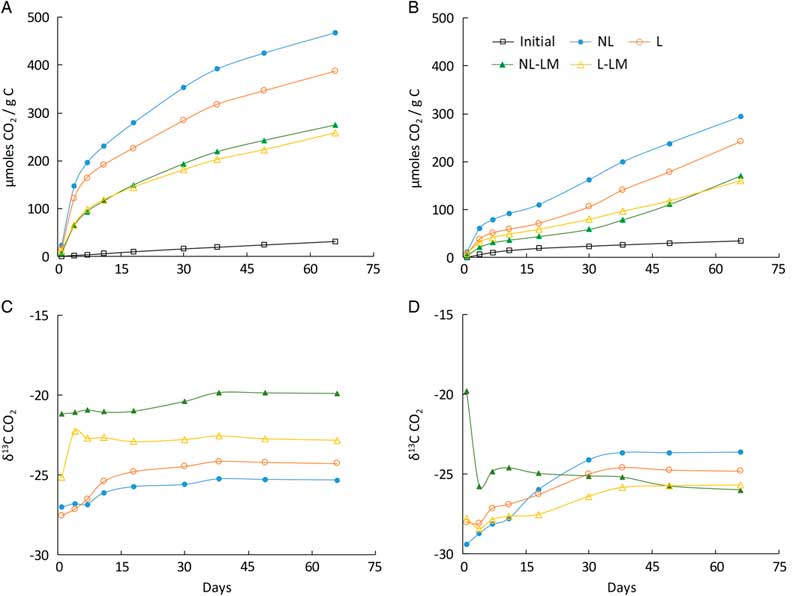
For the 300ºC biochars, the CO2 efflux rate peaked at ≈18–41 μmoles CO2/day/g C between day 1 and 4 depending on treatment but slowed to ≈1.9–2.5 μmoles CO2/day/g C by the end of the experiment (day 49–66, see Supplementary Material File 2). Efflux of CO2 was substantially higher in the two treatments without limestone (NL and L) than in the treatments with limestone (NL-LM and L-LM) (Figure 1A). Compared to the 300ºC biochars, CO2 efflux rate and cumulative CO2 efflux were lower in the 500ºC biochars (initial rate ≈6–16 μmoles CO2/day/g C, final rate ≈2.5–3.8 μmoles CO2/day/g C) but the relative differences between the treatments were similar between the two biochar types (Figure 1B). The initial biochar sample of both biochar types produced considerably lower CO2 efflux than the three-year environmentally exposed samples.
Cumulative CO2 efflux and δ13CCO2 values from 300ºC (A, C) and 500ºC (B, D) biochars in 66-day incubation experiments (mean of two replicates of each treatment). CO2 efflux from the initial samples was insufficient for isotope measurement. NL: no litter cover; L: litter cover; NL-LM: no litter but limestone cover; L-LM: litter and limestone cover.

The δ13C values of CO2 in the long-term incubation experiment varied over the course of the experiment for most treatments in both biochar types (Figure 1C, D). In both 300ºC and 500ºC biochars without limestone (NL and L) δ13C values were initially low (≈–27 to –29‰) before rising towards the end of the experiment (≈–23 to –25‰). In contrast, the δ13CCO2 values in the limestone treatments (NL-LM and L-LM) differed between the two biochar types with the 300ºC biochars stabilizing at higher values (≈–20 to –23‰) than the 500ºC biochars (≈–26‰) towards the end of the experiment. While δ13CCO2 values derived from the short-term and long-term incubations varied by 2–3‰ at equivalent incubation times the relative difference in values between limestone and no-limestone treatments were similar.
DISCUSSION
CO 2 Efflux and 14 C Concentration
Previous studies have used laboratory incubations and 14C labeling to demonstrate that microbial mineralization and respiration of CO2 are dominant processes in the degradation of biochar (e.g. Singh et al. Reference Singh, Cowie and Smernik2012; Kuzyakov et al. Reference Kuzyakov, Bogomolova and Glaser2014). However, Zimmerman (Reference Zimmerman2010) showed that abiotic oxidation may be a significant degradation process in some cases. In the present study, we use the link between 14CCO2 concentration and degradation to apportion the measured CO2 efflux to indigenous biochar C and exogenous C from other sources within the biochars after three years of environmental exposure.
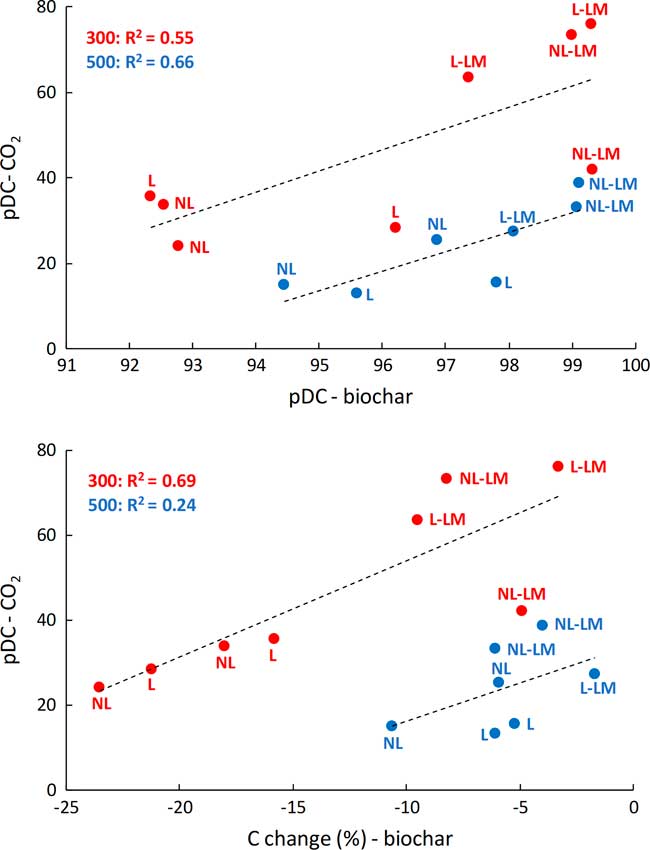
Based on our short-term incubation experiments, we found significant (p<0.05) correlations between 14C concentration in both the 300ºC and 500ºC biochars after three years of exposure (data from Bird et al. Reference Bird, McBeath, Ascough, Levchenko, Wurster, Munksgaard, Smernik and Williams2017) and the 14C concentration in CO2 obtained from the incubation experiment (Figure 2A, note that % 14C-dead C is shown (pDC=100-pMC) which represents the indigenous C component). The 14C concentration in CO2 efflux from the 300ºC biochars was also significantly (p<0.01) correlated with relative changes in C concentration in these biochars (data from Bird et al. Reference Bird, McBeath, Ascough, Levchenko, Wurster, Munksgaard, Smernik and Williams2017) which is a function of both loss of indigenous C and addition of exogeneous C (Figure 2B). However, the positive trend between 14C concentration in CO2 and changes in C concentration in the 500ºC biochars was not significant (p=0.26).
Relationship between 14C concentration in CO2 efflux from biochars (this study) and 14C concentration in biochars and change in biochar C content after environmentally exposure (data from Bird et al. Reference Bird, McBeath, Ascough, Levchenko, Wurster, Munksgaard, Smernik and Williams2017). Radiocarbon concentration is shown as percent 14C-dead carbon (pDC=100 pMC). NL: no litter cover; L: litter cover; NL-LM: no litter but limestone cover; L-LM: litter and limestone cover. All 14C analytical errors are within the size of the data points shown (maximum error is ±0.82 pDC).
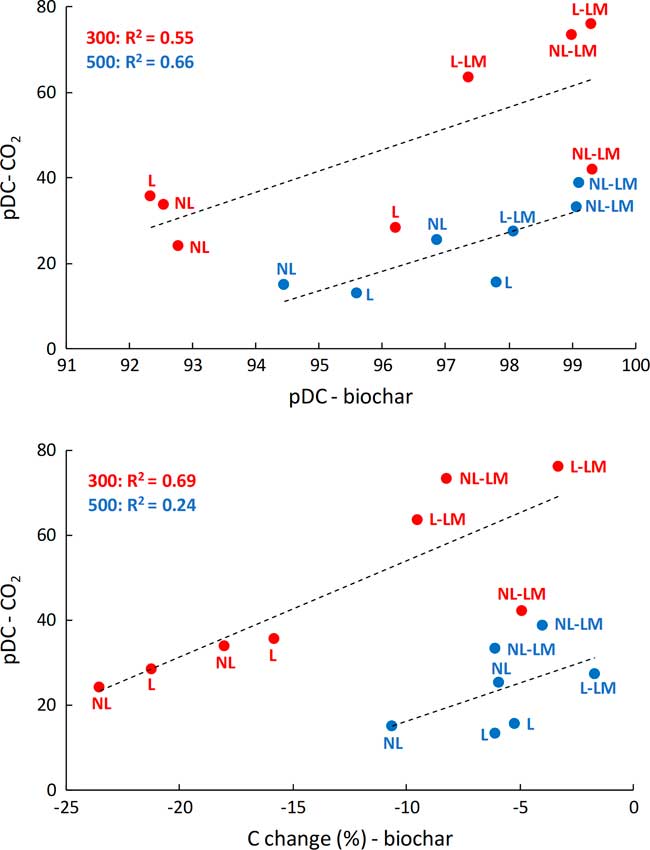
The 14C pDC values were substantially lower in CO2 than in the corresponding biochar source material in all treatments of both biochars. Furthermore, there was a higher proportion of indigenous C in CO2 from 300ºC biochars compared to CO2 from 500ºC biochars. The limestone treatments of both biochar types had the lowest 14C concentration (highest pDC) in both CO2 and the biochar source. These findings are consistent with the observations by Bird et al. (Reference Bird, McBeath, Ascough, Levchenko, Wurster, Munksgaard, Smernik and Williams2017) that 500ºC biochars are more resistant to decomposition than 300ºC biochars and that biochars treated with limestone had comparatively lower degrees of indigenous carbon loss and lower ingress of exogeneous C compared to treatments without limestone. These authors also hypothesized that restricted oxygen availability and high Ca2+ availability were two factors potentially reducing mobility of degraded biochar C and lower ingress of exogeneous carbon in the limestone treatments.
The long-term incubation experiments demonstrated a reduction of up to 20-fold in the CO2 efflux rate over the duration of the experiment (66 days). In addition, the cumulative δ13CCO2 values of most treatments varied most dramatically over the first approximately 30 days after which time the values became relatively stable. These observations mean that the 14C and δ13C data derived from the short-term in-vitro experiment represents an initial phase of rapid CO2 efflux sourced from a relatively small pool of the most labile C. The reduced efflux of CO2 in 500ºC biochars compared to 300ºC biochars and in biochars treated with limestone is consistent with an increased content of recalcitrant SPAC in high temperature biochars and an effect of limestone in reducing loss of C. Comparison of the environmentally exposed and initial biochar samples show an ≈15-fold increase in the cumulative CO2 efflux in the 300ºC biochar with no treatment after 66 days. The 500ºC biochars and biochars treated with leaf litter and limestone showed lesser, but still substantial, acceleration in CO2 efflux from degradation of C.
Biochar Degradation and CO 2 Sources
Carbon dioxide was derived from two sources of labile C contained in the three-year-old biochars: exogenous C mainly derived from leaf litter with high 14C concentration (pMC ≈106.2, Bird et al. Reference Bird, Levchenko, Ascough, Meredith, Wurster, Williams, Tilston, Snape and Apperley2014) and a semi-labile fraction of radiocarbon-dead indigenous biochar C (pMC <0.05, 3σ detection limit; Bird et al. Reference Bird, Levchenko, Ascough, Meredith, Wurster, Williams, Tilston, Snape and Apperley2014). The proportional contribution of these two sources can be directly linked to the 14C concentration measured in the CO2 efflux from the short-term incubation experiment.
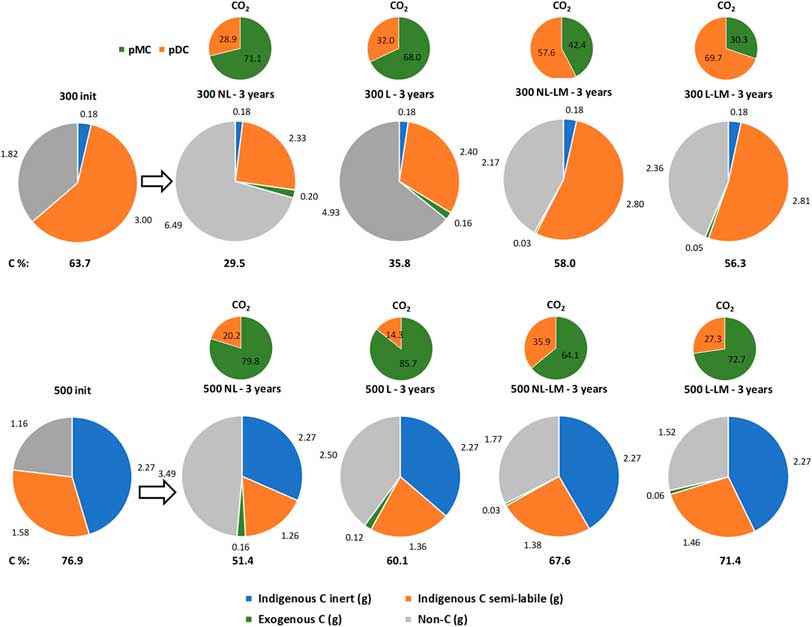
Figure 3 shows the changes in composition of biochars over three years based on mass balance calculations (based on data from Bird et al. Reference Bird, McBeath, Ascough, Levchenko, Wurster, Munksgaard, Smernik and Williams2017) and the source apportionment of the CO2 efflux data presented in this study (see Supplementary Material File 3). The mass of inert indigenous C is the measured content of SPAC (McBeath et al. Reference McBeath, Wurster and Bird2015) and is assumed to remain unchanged over the three-year period. Preservation of indigenous C (blue and orange sections in Figure 3) was highest and ingress of exogenous C (green sections) was lowest in the limestone covered biochars which suggests that biochar degradation was slowed by restricting oxygen availability and ingress by water and microbiota in these treatments. In contrast, the more degraded indigenous C and higher ingress of exogenous C in biochars exposed on the surface, or covered only by leaf litter, was likely caused by higher oxygen availability and increased access for water and microbiota.
Depiction of the distribution of carbon and non-carbon components in biochars before and after environmental exposure (large pie-charts) based on biochar mass balance data from Bird et al. (Reference Bird, McBeath, Ascough, Levchenko, Wurster, Munksgaard, Smernik and Williams2017) and CO2 efflux data from the present study. The mass (g) of each component is indicated outside each pie chart (initial biochar mass=5 g) and the C concentration (%) is shown below. The small pie-charts show % modern carbon (pMC) and 14C-dead carbon (pDC) in the CO2 efflux from exogeneous and indigenous semi-labile C, respectively. NL: no litter cover; L: litter cover; NL-LM: no litter but limestone cover; L-LM: litter and limestone cover.

The mass balance results and their link to 14CCO2 concentration demonstrate that a high to dominant proportion (≈30–71%) of the CO2 efflux was derived from the small proportion of exogeneous C (<8 % of total C) in the 300ºC biochars. For the 500ºC biochars, an even higher proportion of CO2 (≈64–86%) was derived from exogeneous C which constituted less than 5% of total C. Although high proportions of the CO2 efflux were derived from the small contents of exogeneous C in the biochars, the CO2 efflux from the incubation experiments accounted for less than 1% of exogeneous C in all samples.
The source of the remainder of the CO2 efflux in both biochar types must be the semi-labile fraction of indigenous C which amounts to ≈25–56% of the total biochar mass in the 300ºC biochar and ≈22–28% of the total biochar mass in the 500ºC biochars (depending on treatment). Depending on treatment, respiration rates of indigenous biochar carbon amounted to ≈0.7–1.4 μmoles CO2/g C/day for the 300ºC biochar and 0.5–1.3 μmoles CO2/g C/day for the 500ºC biochar at the end of the long-term incubation experiment (Supplementary Material File 4). It is interesting to note that at these respiration rates, the indigenous carbon pool would be completely degraded in ≈230–650 years assuming the measured efflux rate represents respiration from the entire indigenous carbon pool. However, turnover could be slower if a more recalcitrant carbon pool, with a lower respiration rate, is also part of the indigenous BC pool.
The CO2 efflux rates obtained for both the 300ºC and 500ºC biochars as a proportion of the semi-labile indigenous PyC component were up to twice the maximum abiotic rate of degradation of biochars reported by Zimmerman (Reference Zimmerman2010) and other studies have documented their high resistance to chemical oxidants (Forbes et al. Reference Forbes, Raison and Skjemstad2006; Wang et al. Reference Wang, Xiong and Kuzyakov2016). Since the only oxidizing agents available in our biochar incubations were the initial volume of deionized water and air, it seems improbable that abiotic oxidation and/or solubilization could be the dominant degradation processes. Consequently, we infer that most of the CO2 produced over the course of the incubations was due to microbial degradation and respiration. However, abiotic oxidation may become increasingly important in longer term incubations upon exhaustion of the most microbially available C sources.
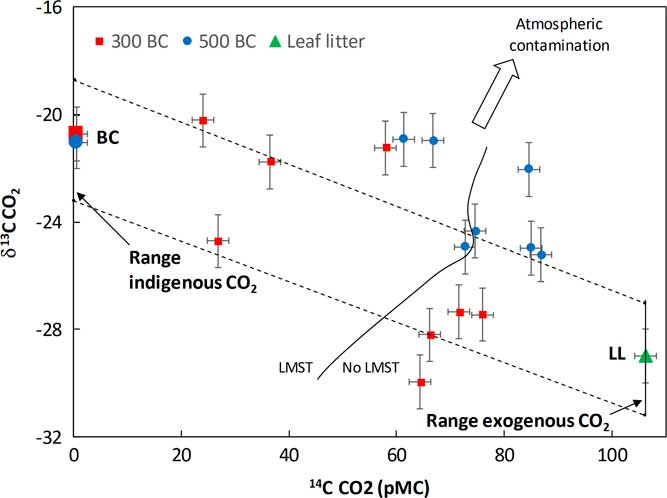
A two-component mixture of CO2 efflux from the indigenous and exogenous C sources identified can account for the distribution of both δ13C and 14C pMC values in most of biochar samples (Figure 4). Carbon dioxide derived from both indigenous C (biochar <0.05 pMC, Bird et al. Reference Bird, Levchenko, Ascough, Meredith, Wurster, Williams, Tilston, Snape and Apperley2014) and exogenous C (leaf litter=106.2 pMC, Bird et al. Reference Bird, Levchenko, Ascough, Meredith, Wurster, Williams, Tilston, Snape and Apperley2014) is likely to have a range of δ13C values close to those of the C source itself (300ºC biochar initial δ13C=–20.7‰, 500ºC biochar initial δ13C=–21.0‰, forest litter δ13C=–29.0‰, Bird et al. Reference Bird, Levchenko, Ascough, Meredith, Wurster, Williams, Tilston, Snape and Apperley2014). In a study of Australian grasslands, Šantrůčková et al. (Reference Šantrůčková, Bird and Lloyd2000) found that the δ13C value of microbial C on average was enriched by ≈2‰ compared to soil organic C, while microbially-respired CO2 on average had δ13C values depleted by ≈2.2‰ compared with microbial C. Assuming that similar isotopic fractionation effects occurred in the in-vitro respiration of our biochar samples, a δ13CCO2 value of –2.2‰ below the initial source C (both indigenous C and exogenous leaf litter C) would result from the direct respiration of these two C sources. In addition, an upper δ13CCO2 value of 2‰ above the initial source C would result from the in-vitro respiration of CO2 by microbes obtaining C from dead microbial matter contained in the biochars and which obtained C from the indigenous and/or exogenous C sources during the three-year environmental exposure of the biochar. Figure 4 demonstrates that the main influence on 14C concentration and δ13C values in CO2 efflux from the degrading biochars was the limestone treatment and not the biochar type (300ºC or 500ºC).
Relationship between δ13C values and 14C concentrations (pMC) in CO2 efflux from environmentally exposed biochars in short-term (14–18 day) incubation experiments. The range of likely values in CO2 respired from the initial indigenous (biochar “BC”) and exogenous (leaf litter “LL”) sources are based on data from Bird et al. (Reference Bird, Levchenko, Ascough, Meredith, Wurster, Williams, Tilston, Snape and Apperley2014) and Šantrůčková et al. (Reference Šantrůčková, Bird and Lloyd2000). The broken lines represent mixing between indigenous and exogenous C sources. The full line distinguishes limestone treatments (LMST). The wide arrow indicates displacement of samples due to possible air contamination during sample preparation.

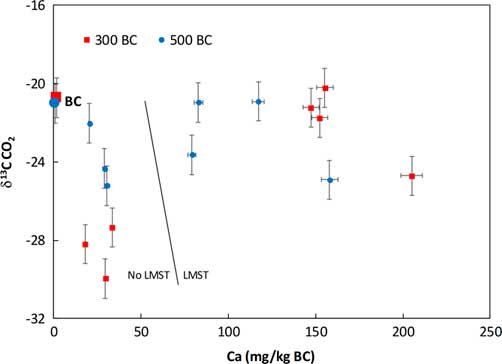
The δ13CCO2 values of four samples were approximately 2–3‰ higher than expected from mixing of the indigenous and exogenous CO2 sources. We considered the possibility that three of these higher δ13C values (samples with limestone treatment) could be due to incorporation of carbonate fragments. However, the acidic nature of the biochars (pH=4.5 to 5.6; Bird et al. Reference Bird, McBeath, Ascough, Levchenko, Wurster, Munksgaard, Smernik and Williams2017) would tend to rapidly dissolve carbonates. In addition, we found no association between δ13CCO2 values and Ca concentrations in water extracts of the 300ºC or 500ºC biochars (Figure 5). This suggests that there was no limestone present in the biochar samples that could contribute CO2 with high δ13C values. Therefore, the elevated Ca concentrations in biochars covered with limestone must indicate that Ca2+ ions were derived by dissolution of the overlying limestone and immobilized within the biochars. The small increase in Ca content in biochars without limestone treatment relative to the initial biochar content likely indicates a lesser influx of Ca from local surface soils (exchangeable Ca ≈1600 mg/kg, unpublished data). As we have not identified any other source of CO2 with high δ13C values within the biochar samples it seems likely that the four samples with δ13C values above the upper mixing line in Figure 4 were contaminated with atmospheric air (δ13C ≈–7.5‰), possibly due to incomplete flushing of the incubation flasks with CO2 free air, a scenario considered likely given the small sample sizes (average 47 μg C). An isotopic mass balance calculation shows that a maximum of 12% of atmospheric air would account for the displacement of all samples above the upper mixing line in Figure 4.
Relationship between δ13CCO2 values and Ca concentrations in water extractions of environmentally exposed biochars. The full line distinguishes limestone treatments (LMST) and “BC” indicates the likely values in CO2 respired from the initial biochar samples (data from Bird et al. Reference Bird, Levchenko, Ascough, Meredith, Wurster, Williams, Tilston, Snape and Apperley2014).

Influence of Ca 2+ Availability on Biochar Degradation
The observation that CO2 respired from the limestone-treated biochars contained substantially more radiocarbon-dead indigenous C (lower pMC values), and that those incubations contained more Ca, compared to biochars without limestone treatment, supports the hypothesis by Bird et al. (Reference Bird, McBeath, Ascough, Levchenko, Wurster, Munksgaard, Smernik and Williams2017) that the availability of Ca2+ ions reduces the mobility of degraded indigenous biochar. In addition, the limestone covers restricted access by oxygen, water and microbiota. Table 2 shows the calculated losses of indigenous C respired as CO2 as a percentage of the total indigenous C loss over the three-year field trial. The calculations are based on the respiration rates measured during the final 17 days of the 66-day incubation trial (see Supplementary Material File 4). Irrespective of whether these rates accurately reflect field conditions during environmental exposure the data illustrates the effect of limestone treatment in reducing the field mobility of degraded indigenous C in biochars. Limestone treated 300ºC biochars had a 5–6-fold higher percentage indigenous C loss respired as CO2 compared to treatments without limestone. In the 500ºC biochars the increase was 2–3 fold. The lower percentages in the 300ºC compared to the 500ºC biochars are due to the larger pool of semi-labile indigenous C available for respiration in the 300ºC biochars (94% of total indigenous C) compared to the 500ºC biochars (41% of total indigenous C). The results here suggest higher Ca2+ availability led to the binding and immobilization in situ, of degradation products to the char surfaces, or minerals associated with the char surfaces (Oades Reference Oades1988; Varcoe et al. Reference Varcoe, van Leeuwen, Chittleborough, Cox, Smernik and Heitz2010; Wittinghall and Hobbie Reference Whittinghill and Hobbie2012).
Calculated indigenous C respired as CO2 as a percentage of the total indigenous C loss during the three-year field trial

The difference in respired loss of indigenous C between limestone and no limestone treatments indicates the amount of additional loss by solubilizations and leaching of indigenous C in biochars without limestone treatment. While all biochars, regardless of treatment type, were degraded during the period of environmental exposure, a significant portion of the resulting labile C was not leached from the biochars treated with limestone. Hence a larger pool of indigenous carbon was available for respiration in the laboratory incubations as shown in Figure 3.
The finding that Ca2+ availability has an impact on the immobilization of degradation products on biochars has implications for the radiocarbon dating of ancient biochars. Biochars from alkaline environments appear more degraded than samples from non-alkaline environments (Alon et al. Reference Alon, Mintz, Cohen, Weiner and Boaretto2002; Rebollo et al. Reference Rebollo, Cohen-Ofri, Popovitz-Biro, Bar-Yosef, Meignen, Goldberg and Boaretto2008). The results presented here suggest that biochars from alkaline environments are not intrinsically more susceptible to degradation than biochars from non-alkaline environments, they simply retain degradation products in situ through Ca2+ immobilization processes—products that have been lost by leaching and/or respiration from chars in non-alkaline environments. Thus, the often-large alkali-soluble component of ancient biochars from Ca-rich environments such as limestone caves may be of mostly indigenous origin. As such the alkali-soluble component may potentially be able to provide a robust radiocarbon age determination if the solubilized indigenous component can be isolated from actual exogenous contamination.
CONCLUSIONS
We have reported 14C concentration and δ13C values of the CO2 efflux from incubated biochars previously degraded during three years of environmental exposure in a humid tropical environment. The radiocarbon results show that one degradation pathway, likely mediated by microbial activity, lead to the respiration of indigenous biochar carbon in significant amounts as CO2 along with a component of exogenous carbon closely associated with the biochars but derived from the local environment. In addition, correlations observed between 14C concentration, δ13C values and Ca abundance indicate that high Ca2+ availability reduces loss of indigenous C during biochar degradation by immobilizing degradation products in-situ.
ACKNOWLEDGMENTS
The authors acknowledge the ANSTO CAS radiocarbon chemistry team for the processing of the sample carbon dioxide break seals into graphite accelerator targets. This project was supported by an Australian Research Council Laureate Fellowship (FL140100044) to MIB and ANSTO Portal Grant PE10105 to MIB and VAL. VAL and AW acknowledge the financial support from the Australian Government for the Centre for Accelerator Science at ANSTO, where the 14C measurements were done, through the National Collaborative Research Infrastructure Strategy.
Supplementary material
To view supplementary material for this article, please visit https://doi.org/10.1017/RDC.2018.128