INTRODUCTION
The accelerator mass spectrometry (AMS) center at the Horia Hulubei National Institute for R&D in Physics and Nuclear Engineering Magurele-Bucharest, is based on a 1 MV Tandetron accelerator, manufactured by HVEE (Stan-Sion et al. Reference Stan-Sion, Enăchescu, Petre, Simion, Călinescu and Ghiță2015). The grant for the entire laboratory infrastructure was assured by the Romanian Government thorough the “Capacități Mari” investment program.
At the moment of the laboratory’s foundation, Romania had no other AMS radiocarbon dating laboratory, thus making the AMS center at the Horia Hulubei National Institute for R&D in Physics and Nuclear Engineering, the first Romanian laboratory in this field. The AMS system was installed and commissioned during the year 2012, while the entire laboratory became fully operational in 2013. The multi-isotopic character of our AMS system has allowed us to determine various long lived nuclear species, i.e. 14 C, 10 Be, 26 Al, 129 I, (Stan-Sion and Enăchescu Reference Stan-Sion and Enăchescu2017), and recently 239 Pu and 240 Pu, with good uncertainty values. During the installation and commissioning of the AMS machine, the sample preparation laboratory started to test and establish pretreatment protocols for different types of 14C reference materials and to shape a general routine for the sample CO2 conversion to the necessary AMS graphite.
Here, we present our adopted general methods for sample preparation and graphitization, together with the instrumentation we currently use for laboratory activities concerning radiocarbon dating via AMS. The samples we refer to in this paper are subject to the SIRI exercise (Scott et al. Reference Scott, Naysmith and Cook2017), which had assessed the 14C dating results from almost 50 AMS radiocarbon dating laboratories. Therefore, our 14C AMS results are shown and will demonstrate the reliability and accuracy of our radiocarbon determinations in various material types covering a dynamic range from modern to radiocarbon blank ages.
SAMPLE PRETREATMENT PROTOCOLS
Organic Materials (Charcoals, Plant Remains, Peat, etc.)
For organic materials, we use the standard acid-base-acid (ABA) method, following the protocols described in e.g. Jull et al. (Reference Jull, Burr, Beck, Hodgins, Biddulph, Gann, Hatheway, Lange and Lifton2006). The pretreatment starts with an acid leaching of the bulk sample (3.7% HCl, T=80ºC, 20 min), ultrapure water washing (MilliQ®, Millipore, USA), alkali treatment (0.8% NaOH, T=80ºC, 20 min), ultrapure water washing, acid treatment (3.7% HCl, T=80ºC, 1 hr), followed by ultrapure water washing to neutral pH. At the end of this protocol, the samples are dried. Humic and fulvic acids are soluble in alkali and acid, respectively, and extraneous carbonates can also be removed by an acid-pretreatment step. The insoluble humin fraction is removed during ultrapure water rinses. For samples from works of art, including textiles, we can apply a Soxhlet extraction as described in Hajdas et al. (Reference Hajdas, Cristi, Bonani and Maurer2014). In this case, to remove the most customary contaminants, the samples are cleaned in a sequence of hexane, acetone and ethanol solvents.
Wood
The α-cellulose extraction method used is based on the procedures applied at ETH Zurich in Switzerland. Therefore, the standard ABA pretreatment was modified by adding two other steps. The first step is the addition of a supplementary step of alkali treatment (4% NaOH) at the beginning of the procedure. This is done for better removal of the alcoholic, phenolic, and carboxylic groups of the main wood components, which are more dissociated at high pH (Nĕmec et al. Reference Němec, Wacker, Hajdas and Gäggeler2010). The second difference consists in introducing a bleaching step at the end of the ABA pretreatment using sodium chlorite (10% NaClO2) in a slightly acidic solution to prevent the adsorption of the atmospheric CO2. The α-cellulose is then washed and carefully dried.
Bones
The standard collagen extraction follows the acid-acid (AA) ultrafiltration method. At the beginning of the pretreatment the sample is visually inspected under the optic microscope to observe and mechanically remove any possible contaminants. The first cleaning is done using a rotary brush; for strongly adherent contaminants, sand-blasting is employed for their removal. The sample is then subsequently washed three times in the ultrasonic bath with ultrapure water, each washing of 15-min duration, changing the water after each washing step. After drying the sample to a constant mass, the sample is again inspected under the microscope for any contaminants that are still adhered to the sample or might have been introduced during the cleaning process.
The first step of bone fragmentation takes place in an agate mortar. Some harder bones may require the use of an electric ball mill to break up the material. If this is necessary, the milling process continues to the point where the granularity of the powder is between 1–2 mm. Careful attention is necessary to avoid over crushing to a very fine powder, which would lead to a possible degradation of the collagen by destroying the protein chain, rendering a collagen-diluted final solution (Fülöp et al. Reference Fülöp, Heinze, John and Rethemeyer2013).
Prior to collagen extraction we include a prescreening step using an elemental analyzer (Vario MicroCube, Elementar, Germany), since a good indication of the collagen presence into the bone is given by an atomic C/N ratio between 2.9 and 3.6 (De Niro Reference DeNiro1985). The samples that deviate from these ratios are deemed unsuitable for dating.
If the prescreening shows the presence of enough collagen in the sample, this is subject to an AA+ ultrafiltration pretreatment. The sample is demineralized with 3.7% HCl at room temperature for 30 min, and then gelatin is obtained by dissolution with 3.7% HCl at 80°C, for 12 hr. For a reliable separation, the collagen is filtered on a 0.2 µm Surfactant-Free Cellulose Acetate (SFCA) Corning filter and then ultrafiltered on 30kDa Amicon ultrafilter, which isolates the collagen fractions (Brown et al. Reference Brown, Nelson, Vogel and Southon1988). By skipping the alkali step, the yield of collagen is increased, which might be an important feature for poorly preserved bones. This method is adapted from the current bone pretreatment protocol used at the ETH Zurich Laboratory, Switzerland (Hajdas et al. Reference Hajdas, Michczyński, Bonani, Wacker and Furrer2009), which is a modified version of the Longin collagen extraction method (Longin Reference Longin1971). At the end of these steps, the extracted collagen is frozen and the next day is subjected to a freeze-drying process.
Carbonates
The pretreatment method for inorganic carbonates samples involves a preliminary surface cleaning with solutions of 10% H2O2 and/or low concentration HCl, followed by a rinse with ultrapure water. Afterwards, if necessary, the ultrasonic bath is used. The samples are then dried in a vacuum oven at 45ºC for 4 hr and then roughly crushed in an agate mortar.
For the conversion of carbonate samples into graphite, the crushed carbonate is placed into small glass vials within the Carbonate Handling System (CHS) (Wacker et al. Reference Wacker, Fülöp, Hajdas, Molnar and Rethemeyer2013), an installation of automated digestion produced by IonPlus, Switzerland. Prior to their insertion into the CHS, the samples of 10–12 mg are weighed out into 12 mL vials and closed with screw caps containing a butyl septum (Exetainer® vials, Labco, UK). The air inside is removed by a stream of helium carrier gas of 70 mL/min using a double-wall needle (Thermo, Germany); this procedure takes 5 min for each sample. After this step, 1 mL of phosphoric acid (H3PO4, 85%) previously heated to 70ºC, is added with a gas-tight syringe. The reaction proceeds until the entire CO2 content of the sample material is liberated. The extracted CO2 is flushed with the helium flow for 2 min into the Automated Graphitization Equipment (AGE III), IonPlus, Switzerland (Wacker et al. Reference Wacker, Němec and Bourquin2010a). Any traces of water are retained on a phosphorus pent-oxide trap (Merck Sicapent®). From the insertion of the samples into the glass vials up to the removal of the graphite, the entire procedure is automated and requires minimal manual intervention during the process.
STANDARD MATERIALS AND GRAPHITIZATION
We use several types of materials for blank correction. For organic samples we use a sample of “braunköhle” (a fossil brown coal from Reichewalde, Germany, supplied by B. Kromer ) and Merk® synthetic graphite (Carbon graphite powder, 99.9% purity) for graphitization and machine blanks. For inorganic materials we use IAEA-C1 marble (RS IAEA-C1 to IAEA-C9 Rev.01). For routine measurements all the samples are normalized to modern radiocarbon level using NIST SRM 4990C, Oxalic Acid II (NIST SRM 4990C).
The AGE III graphitization device receives the CO2 from either the EA or the CHS systems. When using the EA, the pretreated, dried samples are weighed into tin boats (Elementar, Germany) and combusted at 900°C. For carbonates, the cycle follows the steps described in previous discussion on carbonate samples. In all of the cases, the CO2 is converted into graphite using an iron catalyst (Alfa Aesar − 325 mesh iron, 99% purity) under a hydrogen flux and temperatures of ~580°C. In a single automated graphitization cycle, which takes around 8 hr, the AGE III is able to produce a batch of seven samples of high-quality graphite. One interesting element of this installation is the zeolite trap which operates as a temporary gas storage device, being able to hold and release the sample CO2 by heating. More information about AGE III principle of operation and constructive details are found in Wacker et al. (Reference Wacker, Němec and Bourquin2010a). The amount of carbon in the processed sample is about 1 mg, which represents around 15–20% from the total cathode material, with the rest formed by iron powder.
THE AMS SYSTEM
The 1 MV Tandetron AMS machine produced by the HVEE is already installed in several laboratories around the world (Klein et al. Reference Klein, van Staveren, Mous and Gottdang2007). The Bucharest AMS system is based on this type of accelerator, which has a Cockcroft−Walton high-voltage system and is supplied by two multi-cathode sputtering ion sources with independent injection beamlines separated at 120°. The ion sources are of the SO110/50 type, each of them hosting a 50 sample carousel.
The negative ion beam is injected from one of the ion sources through the low-energy electrostatic analyzer (ESA) towards the 90° bouncer system which can rapidly switch ions of different masses into the accelerator tank. The fast switching inside the bouncer is created by a high-voltage potential differentially applied on the insulated magnetic chamber function of the injected ion mass. The bouncer timing is correlated either with the Faraday cup signal or detector counts readout. The low-energy accelerator tube is equipped with a patented Q-Snout type lens, while the high-energy tube takes advantage of a Q-pole triplet lens placed at the exit of the tank (Klein et al. 2006). The accelerated beam is analyzed in a double filtering system consisting of an achromatic 90° dipole magnet and a 120° high energy ESA, to perform momentum and energy selections of the beam. The rare isotope beam is detected and identified in a double anode gas ionization detector provided with 8×8 mm2 silicon nitride window of 75 nm thickness. The AMS system settings used for the present analysis are described later.
RESULTS
SIRI Samples
The Sixth International Radiocarbon Inter-comparison follows the previous inter-comparison exercises, as the TIRI, FIRI, and VIRI (Scott Reference Scott2003; Scott et al. Reference Scott, Cook and Naysmith2010) and provides the latest set of samples for laboratories to check their procedures, compare the results and have an overall quality assurance.
RoAMS laboratory did not officially participate in the SIRI exercise, but only demonstrated its capability on the SIRI samples as a proficiency test and good practice proof. For a new laboratory, this is a great opportunity to assess the entire activity and compare it with other radiocarbon dating laboratories, although they may work in different conditions and use different laboratory protocols.
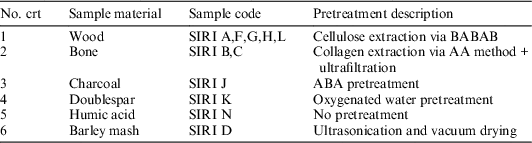
The SIRI objectives were focused on one hand, to the quantification of the sources of variation in the results, and on the other hand, to discuss the laboratory off-sets and error multipliers concerning the choice of material (Scott et al. Reference Scott, Naysmith and Cook2017). The submitted samples are shown in Table 1, which also briefly presents the pretreatment protocol we chose for each sample.
RoAMS pretreatment protocols for SIRI samples.

Note: The SIRI sample E was not investigated in the present study.
The organizers of SIRI exercise paid a special attention to the blank materials organizing them on different categories, i.e. wood (sample A, L), bone (sample C), and carbonate (sample K), such that a given laboratory would be able to assess its contamination introduced for different materials during different preparation cycles, an important aspect in laboratory activity.
AMS Measurement and Measurement Results
All SIRI samples were measured on our AMS machine in a single batch, using 1 MV terminal voltage and typical electrical beam currents of 20–25 µA of 12C– in the focal point of the spectrometer. The ion source extraction voltage was set to 35 kV. The lithium interferences in the gas ionization chamber (GIC) were solved by paying careful attention during machine tuning and by using relatively tight slits distance (±2.5 mm) at bouncer and analyzing dipole. During the fast sequential injection measurement, the high voltage on bouncer magnet oscillated on three values: –2450 V (100 µs, mass 12), 0V (100 µs, mass 13) + 2870 V (9.75 ms, mass 14) thus making possible “quasi-simultaneous” measurement of carbon isotopes. The measurement time per sample was divided into 11 cycles, each of them of 300 sec, from which the first cycle was discarded for all the samples due to inherent instabilities at the beginning of the measurement. The total analysis time and conditions were set to collect around 200,000 net counts for a single cathode modern sample. In this terms, the overall measurement uncertainty was <3.2‰ considering normalization, background subtraction, and counting statistics. Therefore, the results of this measurement with uncertainty units of 1σ are listed in Table 2.
SIRI consensus values in comparison with RoAMS measurements. Uncertainties represent 1σ.

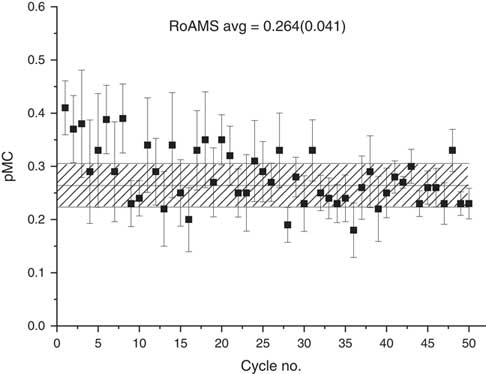
The material used for blank correction was synthetic graphite (Merck carbon graphite powder, 99.9% purity), thus it follows the sample from the graphitization step forwards. During this measurement, the radiocarbon values obtained on Merck synthetic graphite, for five cathodes during this analysis, yielded a pMC of 0.264±0.041 as shown in Figure 1. The measured pMC for all the samples were corrected for the isotopic fractionation introduced during sample preparation and spectrometer measurement using normalized δ13C (VPDB), while the Merck graphite average value was subtracted from all the non-blank samples. The reported pMC are calculated as described by Stuiver and Polach (Reference Stuiver and Polach1977). The data analysis was performed using the BATS software tool (Wacker et al. Reference Wacker, Christl and Synal2010b).
Graphitization blank (Merck carbon graphite powder 99.9% purity) using 5 graphite cathodes, each for 10 cycles. The error bars correspond to ±1σ approximation. The horizontal hashed area represents the weighted average value (±1σ confidence).

Wood and Other Organic Samples
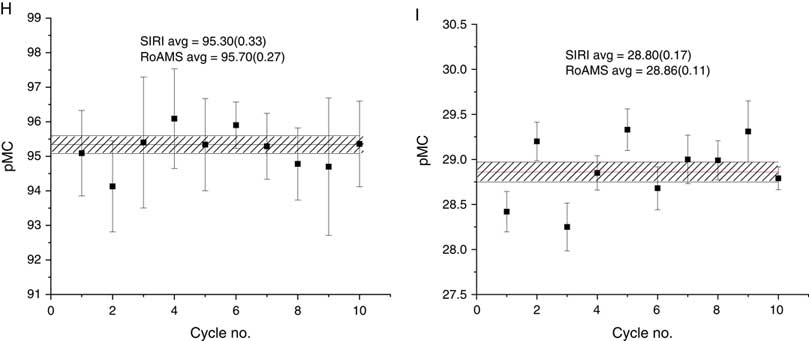
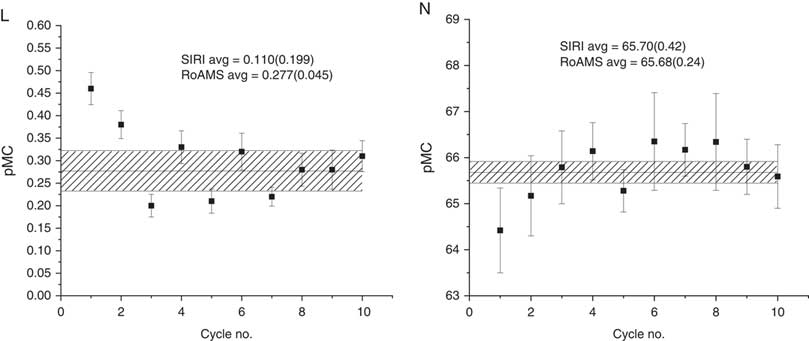
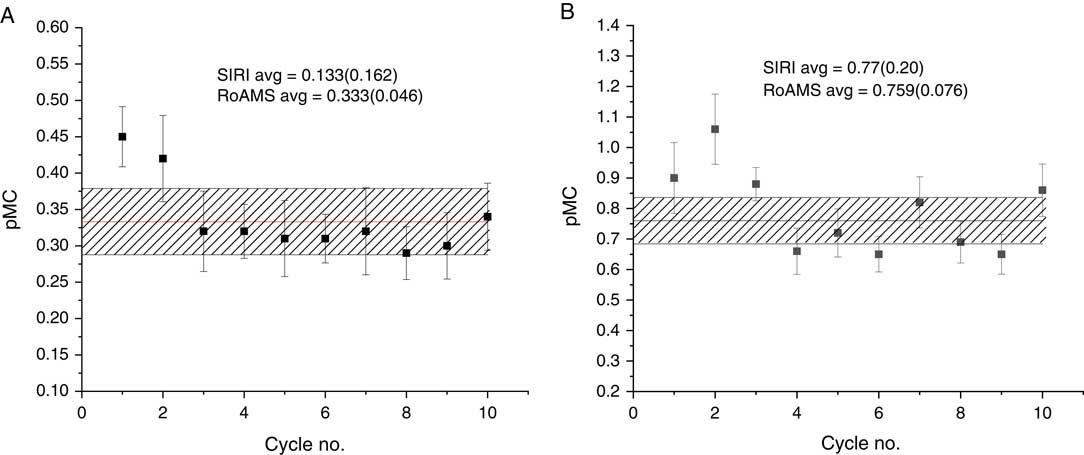
Wood samples were well represented within the SIRI pack (A, E, F, G, H, I, L). For unknown reasons the wood sample E was not present among the other SIRI samples. The dynamic range of the measured ages covered an interval from the blank ages (sample A, Figure 2; sample L, Figure 7), through Mesolithic period (sample I, Figure 5) up to medieval times (sample F, Figure 4; sample G, Figure 4; sample H, Figure 5). The blank sample L showed a lower 14C content than the similar blank sample A, and the contamination with modern carbon introduced during the pretreatment and graphitization are within the limits of the official SIRI results, where the limits of background (LoB) were 0.381 pMC for sample A and 0.468 pMC for sample L.
SIRI wood sample A (blank) and Pleistocene bone sample B in ±1σ approximation. The horizontal hashed area represents the weighted average value (±1σ confidence).
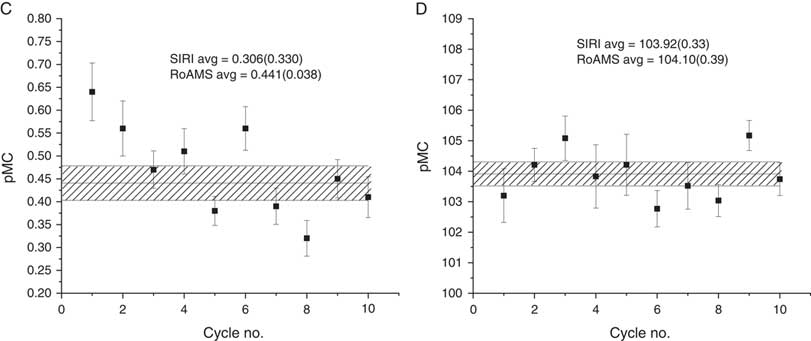
SIRI bone sample C (blank) and modern barley mash sample D in ±1σ approximation. The horizontal hashed area represents the weighted average value (±1σ confidence).

SIRI Medieval Period samples F and G in ±1σ approximation. The horizontal hashed area represents the weighted average value (±1σ confidence).

SIRI Medieval period sample H and beginning of Holocene sample I in ±1σ approximation. The horizontal hashed area represents the weighted average value (±1σ confidence).

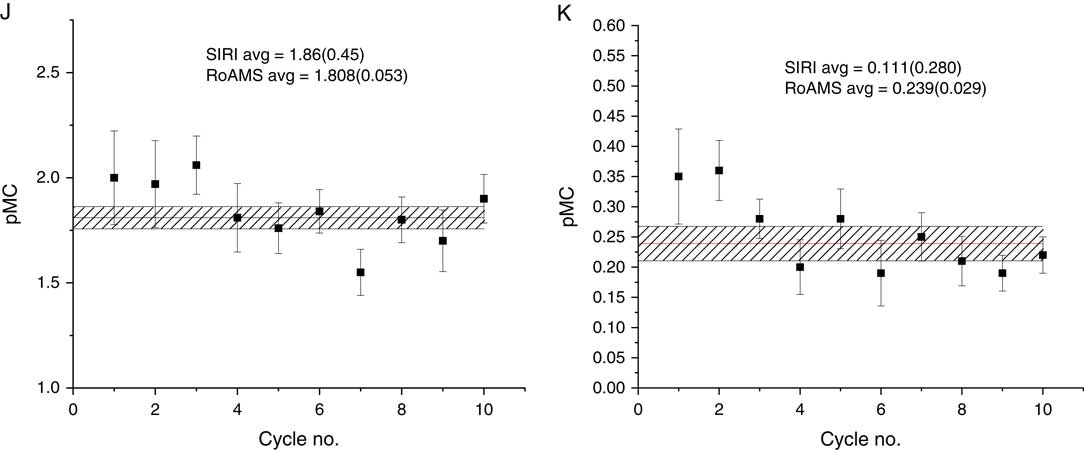
SIRI charcoal sample J (Paleolithic) and doublespar carbonate sample K (blank) in ±1σ approximation. The horizontal hashed area represents the weighted average value (±1σ confidence).

SIRI wood sample L (blank) and humic acid sample N in ±1σ approximation. The horizontal hashed area represents the weighted average value (±1σ confidence).

The other organic materials represented by samples D, Figure 3 (barley mash), J, Figure 6 (charcoal) and N, Figure 7 (humic acid) were pretreated according to Table 1. All the 14C levels of these samples were found in excellent agreement with the SIRI consensus values, as observed in Table 2.
Bone/Collagen Samples
The bone blank (C), Figure 3, showed a slightly higher 14C level (0.441±0.038 pMC) than the wood blanks (i.e. sample A, 0.333±0.046 pMC). This tends to support anecdotal reports that bone background samples display higher pMC values compared to wood or even carbonate background samples. The reported LoB of sample C is 0.895 pMC. The bone sample B, Figure 2, which was almost a background sample, presented a value in very good agreement with the consensus value.
Carbonate Samples
The average value for the SIRI K is 0.239±0.029 pMC, Figure 6, and agrees the regular values reported for this sample with a LoB of 0.465 pMC. This blank results showed that the level of modern carbon contamination in the carbonates circuit of the RoAMS laboratory is within the normal limits.
SUMMARY AND CONCLUSIONS
In August 2015, the radiocarbon dating center in Bucharest successfully dated 12 out of 13 SIRI samples provided to AMS laboratories, and obtained results in very good agreement with the SIRI consensus values. Wood, charcoal, bone, humic acid, carbonate, and barley mash materials were dated following specific procedures for purification. All the samples were pretreated, graphitized, and measured in our laboratory. The background samples prepared and measured in our laboratory are in line with the general values obtained by the participants. Following the SIRI report, the international laboratory code for the Bucharest AMS radiocarbon dating center was established as RoAMS. Since the official installation (April 2013), more than 3500 unknown samples were measured, obtaining an average of around 700 samples/year, excluding the reference materials. A higher number of measurements is mostly limited by the sample pretreatment procedures, which can be further automated.
The SIRI proficiency test at RoAMS laboratory offered us the opportunity to present our adopted sample pretreatment protocols, which were the prerequisites for the reliable and consistent results we obtained during this test. We anticipate the new equipment to have many applications in environmental studies, as well as in cultural heritage and archaeology.
ACKNOWLEDGMENTS
The work was financed by the Romanian Government through the program “Instalații și Obiective de Interes Național.” We thank Marian Scott (University of Glasgow) for providing the SIRI samples, Timothy Jull (University of Arizona) for guidance during this proficiency test, and two anonymous reviewers for their constructive comments.