The disproportionate morbidity and mortality associated with chemical weapons led to the development of the Geneva Protocol (1925) for the prohibition of the use in war of asphyxiating, poisonous, or other gases and the Chemical Weapons Convention (1997), banning the stockpiling and use of these weapons. Reference Szinicz1,Reference Brooks, Erickson, Kayden, Ruiz, Wilkinson and Burkle2 Despite international support to ban the stockpiling and proliferation of chemical weapons, recent history has demonstrated their continued use, particularly in Syria and Iraq. Reference Brooks, Erickson, Kayden, Ruiz, Wilkinson and Burkle2-Reference Schmitt5 A study from 2018 found that from March 2011 to April 2017, at least 1206 individuals in nongovernment-controlled areas of Syria died in chemical weapons attacks, with 97.6% of those killed identified as civilians. Reference Rodriguez-Llanes, Guha-Sapir, Schlüter and Hicks6 While chemical attacks account for a small portion of the total global casualties attributed to terrorism, the use of chemical agents has unique and long-term physical and mental health consequences among victims and health care workers. Reference Rodriguez-Llanes, Guha-Sapir, Schlüter and Hicks6-Reference Roshan, Rahnama and Ghazanfari9 Additionally, clinicians practicing in conflict zones frequently encounter ethical and medical challenges in managing individuals who may be exposed to chemical weapons. Reference Footer, Clouse, Rayes, Sahloul and Rubenstein10 Chemical weapons preparedness has clear relevance for individuals practicing in conflict zones, as well as among emergency responders. Additionally, isolated chemical attacks perpetuated by state agents are a growing concern, as highlighted by recent nerve agent attacks in Kuala Lumpur and Salisbury, UK. Reference Chai, Hayes, Erickson and Boyer11,Reference Chai, Boyer, Al-Nahhas and Erickson12
There are limited data analyses to inform the prioritization of chemical weapons preparedness resources by policy-makers, clinicians, and first responders. In the setting of declining federal funding for chemical and other nonconventional weapons preparedness, there is a growing need to better understand the agents now being used, the targets, and routes of exposure to direct funding, training, and pre-deployment of proper equipment. Reference Watson, Watson, Gastfriend and Sell13 Understanding the trends in chemical terror attacks may be useful to inform the specification of medical education curricula and continuing training for first responders, clinicians, and hospitals to prepare for potentially devastating chemical terror attacks.
Our objective was to describe the epidemiology of global chemical terror events over the past 5 decades with an emphasis on recent global conflict settings to inform future priorities for training of civilian public safety professionals in the management of exposure to chemical weapons.
METHODS
We conducted a descriptive retrospective review of chemical agent terror attacks to understand historical trends in agents, targets, and routes of exposure utilizing The Global Terrorism Database (GTD), which is maintained by the National Consortium for the Study of Terrorism and Responses to Terrorism (START). 14 START is a “university-based research and education center comprised of an international network of scholars committed to the scientific study of the causes and human consequences of terrorism in the United States and around the world,” housed at the University of Maryland. 15
The GTD is an open-source database funded by various US federal government departments that contains over 180,000 global terror incidents spanning from 1970 to 2017. 14 It utilizes public media reports to generate quantitative and qualitative data that comprise the database. The database contains up to 120 possible details for a terror attack, including time and location of incidents, injuries, deaths, weapons used, and details about the responsible parties (Table 1). START makes the GTD publicly available on its website. 14,16
Select variables coded for terror incidents in the Global Terrorism Database

Variables used in this analysis are bolded.
The GTD uses the following definition of terrorism to inform data inclusion: “the threatened or actual use of illegal force and violence by a non-state actor to attain a political, economic, religious, or social goal through fear, coercion, or intimidation.” 17 To be considered for the GTD, a terror incident must meet all of the following criteria: (1) “The incident must be intentional—the result of a conscious calculation on the part of a perpetrator,” (2) “The incident must entail some level of violence or immediate threat of violence—including property violence, as well as violence against people,” and (3) “The perpetrators of the incidents must be sub-national actors. The database does not include acts of state terrorism.” 17
Furthermore, the incident must meet 2 of the 3 additional criteria: (1) “The act must be aimed at attaining a political, economic, religious, or social goal …,” (2) “There must be evidence of an intention to coerce, intimidate, or convey some other message to a larger audience (or audiences) than the immediate victims …,” or (3) “The action must be outside the context of legitimate warfare activities. That is, the act must be outside the parameters permitted by international humanitarian law …” 17 .
We downloaded the full dataset from GTD ranging from 1970-2017. 16 Next, we included only events where a chemical weapon was used. We utilized the GTD definition of a chemical weapon, “A weapon produced from toxic chemicals that is contained in a delivery system and dispersed as a liquid, vapor, or aerosol,” in order to be inclusive of all potential events that were collated and classified within GTD. 17 We additionally included chemicals that were delivered via an explosive device, for example, a shell or warhead containing a chemical weapon. A final raw dataset was compiled on a Microsoft Excel spreadsheet, and was then reviewed with the study team for completeness. We had 2 researchers independently query the database and compare results, then we used a third investigator to reconcile discrepancies.
Next, we stratified incidents by target type (eg, victim of the terror incident) and region. The GTD identifies 22 possible target types for each attack, such as police or educational institutions. If an incident included multiple types of targets, each target was counted only as its own incident in the analysis of target type. Incidents were examined by numbers of injuries and deaths, attack type (involved explosions or bombings), and by region of the world defined using the regions defined by the GTD (refer to the Supplementary Material, available online).
We studied and categorized the weapon detail category for each event. When the description clearly listed a known agent, this specific agent was denoted. If there were multiple known agents, the specific agent was described as “multiple.” If a specific agent was not named in the database, the agent was listed as “unknown.” The attacks were classified by route of exposure (dermal-mucosal, inhalational, enteral, parenteral) and traditional chemical weapon categories (choking, blister, blood, nerve, or riot control agents). 18 Important presuppositions regarding this categorization included the following: pepper spray and tear gas are listed as riot control agents acquired through the dermal-mucosal route; mustard is listed as a vesicant with action through the dermal-mucosal route; and chlorine is listed as a choking agent with an inhalational route. Additionally, all acids were assumed to have dermal-mucosal routes unless otherwise described. The agents in some incidents were simply described as an unknown “gas.” Gas that was not otherwise specified was assumed to be an inhalational agent. The final categorizations of weapon detail and agents used were reviewed by the study team, where 2 researchers independently queried the database and compared results, then a third investigator reconciled discrepancies.
Finally, we conducted an analysis grouping chemical terror attacks by year. We calculated the average number of attacks per year over various time periods. We chose 2001 as a dividing point in the data, as we hypothesized that after the terror attacks on the New York City World Trade Center and Pentagon in 2001, increased armed conflict across the world and the rise of transnational terror networks would potentially result in an increase in the number of terror events involving chemical weapons and change the characteristics of those events. We used 2011 as an additional dividing point in the data, as we theorized a change in the epidemiology of chemical attacks with the widespread armed conflict in Syria and Iraq beginning at this time.
RESULTS
The GTD contained 181,691 global terror events from 1970 to 2017. 16 Data were stratified by weapon type. We included only attacks involving chemical weapons and yielded 383 such attacks (Figure 1). A specific agent was named in 154 incidents. Of the 383 chemical terror events, a route of exposure could be identified in 242 attacks, while 124 incidents were classified into traditional chemical weapons categories (eg, vesicant, choking agents). We categorized data into pre- and post-2001.
Data selection and classification of attacks

From 1970 to the early 2000s, the number of chemical terror incidents was relatively constant, ranging from 1 to 14 attacks per year. There was an increase in the number of chemical attacks from 2011 to 2017, particularly associated with armed conflict in Afghanistan, Syria, and Iraq (Figure 2). The average number of global chemical terror attacks per year increased from 6 between the years of 1970 and 2011 to 24.9 between 2011 and 2017 (Table 2).
Chemical terror attacks over time, 1970-2017

Average number of chemical terror attacks per year for specified time ranges

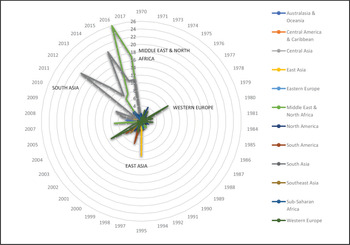
Several “eras” of chemical terror attacks can be seen from 1970 to 2017 (Figure 3). The spike in events in East Asia in the 1990s is predominately due to the Aum Shinrikyo attacks in Japan. Reference Szinicz1 Attacks in Afghanistan (South Asia) account for the increase in terror events in 2012 and 2015, while incidents in Syria and Iraq (Middle East and North Africa) account for the surge in 2016.
Number of chemical weapon terror events by region, 1970-2017. Years are plotted around the circle, with number of attacks represented by rings extending from the center. Geotemporal surges in chemical incidents are evident, particularly in South Asia and the Middle East and North Africa since 2011

The most common targets for chemical terror attacks were private citizens and their property (25.6%), with police units and educational facilities accounting for 12.8% and 12%, respectively (Figure 4). Attacks against military (10.3%) and government targets (9.3%) accounted for the next most targeted facilities, while businesses and their patrons were victims in 7.1% of incidents (Figure 4).
Targets of chemical terror attacks, 1970-2017

We were able to determine the route of exposure in 63.2% (N = 242) of cases. The most common routes of exposure were dermal-mucosal and inhalational (Figure 5). Caustic agents (eg, acids, alkali) were used in 57.5% of the attacks with a dermal-mucosal route or 25.2% of all attacks where the route of exposure could be identified. Agents could be classified into traditional chemical weapons categories in 32% of attacks. Choking and riot-control agents each accounted for approximately one-third of attacks where the agent could be classified, while nerve agents accounted for 4% (Figure 6).
Routes of exposure in chemical terror attacks, 1970-2017 (when route could be identified)

Classification of agents used in chemical terror attacks, 1970-2017 (when agent could be classified)

We were able to identify the agent used in 40% of cases. There were 7 terror incidents where multiple agents were identified in the same attacks. Among attacks where a specific agent could be identified, the top 3 most commonly utilized chemicals from 1970 to 2017 were chlorine (26%), tear gas (21%), and cyanide (16%) (Figure 7). Of note, 21% of all these attacks involved bombings or explosions as a means of delivering the involved chemical.
Most commonly used agents in chemical terror attacks as a percentage of all attacks where agent was identified, 1970-2017. Note: Only agents accounting for 1% or more of attacks are included

We examined differences in chemical agent use before and after 2001. As previously noted in Table 2, the average attacks per year increased from 5.1 between 1970 and 2001 to 15.6 between 2001 and 2017. There was an increase in use of chlorine, from 1.6% of attacks where the agent could be identified before 2001 to 41.9% after 2001 (Figure 8). Mustard (1.6% to 5.4%) and pepper spray (0 to 4.3%) saw increases in use after 2001. Cyanide use fell from 23% of identifiable agents before 2001 to 10.8% after 2001. Tear gas decreased from 32.8% to 12.9%. According to this database, sarin was not identified as an agent in chemical terror attacks after 2001, while it accounted for 3.3% of events where an agent could be identified prior to 2001. Of note, while diphenylamine chloroarsine accounted for 7.5% of attacks after 2001, it was used in a series of mail attacks with no known injuries. Sodium fluoroacetate was documented in 3.2% of attacks after 2001.
Most common agents identified as a percentage of all attacks where an agent was identified, pre- vs post-2001. Excludes agents that accounted for less than 3% of attacks in either cohort

Where the agent could be classified, blood agent (eg, cyanogenic) incidents declined from 32.6% of attacks before 2001 to 13.6% after 2001 (Figure 9). Nerve agent attacks declined from 9.3% to 1.2% over the same period. In contrast, across this period, choking (namely chlorine) and vesicant agent (mustard) use increased from 7% to 48.1% and from 2.3% to 6.2% of attacks, respectively. Riot-control agents also became less predominant over this period.
Classification of chemical agents where available, pre- and post-2001

From 1970 to 2017, 14,027 injuries and 1,019 deaths occurred during terror attacks where chemical weapons were used. From 1970 to 2001, there were 7,407 wounded and 539 killed in attacks. A total of 1017 injuries and 415 deaths occurred during attacks with unknown agents. Among attacks prior to 2001 where the agent could be identified (n = 117), 65.8% of fatalities occurred in attacks involving tear gas, while sarin and cyanide use was implicated in 17.1% and 14.5% of deaths. Of note, a single attack in Colombia in 1999, in which tear gas was utilized along with conventional weapons, accounted for the majority of deaths associated with tear gas use.
Total wounded and killed by chemical agents (when agent known) for attacks after 2001. Includes only agents accounting for 1% or more of injuries or deaths. Excludes “unknown” agents

For chemical terror events after 2001, there were a total of 6620 wounded in those attacks (Figure 10). Of these, 4133 injuries were attributable to attacks where the agent used was unknown. Of the remaining attacks, mustard and chlorine accounted for the vast majority of injuries, 1527 and 807, respectively. There were 480 deaths associated with chemical weapons terror attacks after 2001. Of these, 273 were attributed to attacks involving unknown agents, while 174 were associated with chlorine attacks. In contrast, before 2001 there were 60 wounded and 1 death due to chlorine and no casualties from mustard agents. Consistent with other data presented here, cyanide accounted for 55 injuries and 17 deaths prior to 2001, while from 2001 to 2017 there were 6 wounded and 5 killed in attacks using cyanide.
DISCUSSION
This investigation demonstrates that there has been an increasing frequency of chemical weapons use in terror attacks globally from 1970 to 2017. Of note, binary changes were noted and analyzed pre- and post-2001 (heralded by the September 11 attacks on the United States) and pre- and post-2011 (marked by the start of the war in Syria and continued armed conflicts in Iraq and Afghanistan). We found that private citizens and educational facilities are among the most common targets of attacks and that explosive devices are frequently deployed alongside or as a vector for chemical agents. Our study demonstrates that chlorine and, to a lesser extent, mustard agents have become the predominant chemical terror agent since 2001, with blood (cyanide) and nerve agents falling out of use. These data are important because they describes a gradual pivot since 2001 toward the use of easy-to-manufacture incapacitating agents that rapidly tax the resources of hospitals, thereby causing significant morbidity and mortality. Reference Rodriguez-Llanes, Guha-Sapir, Schlüter and Hicks6,Reference Ganesan, Raza and Vijayaraghavan19 We advocate for strengthening preparedness at vulnerable targets such as educational institutions, increasing blast injury awareness, and focusing medical training and prioritizing preparedness resources on choking agents, vesicants, and caustics.
Our data highlight the growth in terror attacks utilizing chemical weapons from 2001 to 2017 and most dramatically after 2011. These increases coincide with armed conflict in South Asia (Afghanistan) and the Middle East and North Africa (Syria and Iraq), and they occur within the context of declining funding for chemical weapons preparedness. Reference Watson, Watson, Gastfriend and Sell13 Our findings indicate that there is a need to develop chemical weapons preparedness programs in these regions of the world most at risk, in addition to training medical, nongovernmental, diplomatic, and military personnel deployed in these areas. These types of multifront and multiagent wars often have support of state agents with increased access to state arsenals and chemicals.
With growing integration of mobile technologies into health care, there is also an opportunity to develop innovative chemical weapons telemedicine consultation services to help direct management of these complex poisonings. Our investigation demonstrates the vulnerability of “soft-targets,” in particular private citizens and education facilities, which were the targets in 25% and 12% of attacks, respectively. Development of training programs specific to community centers, educators, and administrators for large scale decontamination, antidotes, and respiratory support on site at these locations should be a priority. As previously identified by Santos et al, almost one-quarter of attacks utilized explosive devices, highlighting the importance of blast injury training. Reference Santos, El Zahran, Weiland, Anwar and Schier20 Chemical weapons training of first responders should include training in high explosive and blast injuries. Reference Mathews and Koyfman21 Basic hemorrhage control techniques can be taught to lay persons to address concomitant exsanguinating injury. Reference Marcus, Pontasch and Duff22,Reference Ross, Redman and Mapp23
Our data suggest that preparedness and training should prioritize inhalational and dermatologic routes of exposure and blister and choking agents. Since 2001, the character of chemical terror attacks has changed. Blood (cyanide) and nerve (weaponized organophosphate) agents have given way to choking agents, namely chlorine, which increased from 1.6% of attacks where the agent could be identified before 2001 to 41.9% after 2001. This pattern is reminiscent of the first chemical weapons used in modern warfare during the first World War. Reference Szinicz1,Reference Fitzgerald24 Chlorine and mustard are readily accessible and easy to deploy, particularly when compared to a weaponized organophosphate or cyanide. Reference Rodriguez-Llanes, Guha-Sapir, Schlüter and Hicks6,Reference Ganesan, Raza and Vijayaraghavan19,Reference Jones, Wills and Kang25 While the GTD includes attacks by non-state actors (ie, terror organizations) only, our data are consistent with separate analyses done on the conflict in Syria demonstrating that chlorine is the predominant agent used by the Syrian state as well. 3,4,26-Reference Schneider and Lutkefend28 It should be noted that while tear gas use remains common, its incidence is decreasing and accounts for little morbidity and mortality since 2001.
Current medical training tends to focus on antidotal therapy for chemical weapon exposures, namely surrounding weaponized nerve agents. Instead, preparedness and medical training should emphasize supportive airway care, decontamination, and personal protection, given the dominance of asphyxiating and vesicant agents such as chlorine and mustard gas. 29-32 Stockpiling respirators, gloves, and impermeable gowns for health care workers and public safety professionals may help alleviate collateral injury after civilian or military exposure to these agents. There is no directed antidote to most asphyxiants or vesicants. We therefore suggest measures to pre-deploy or stockpile decontamination equipment, nebulizers, oxygen tanks, and ventilators as a potential countermeasure to the rising tide of these chemical exposures globally.
Acids and other caustics represented nearly one-quarter of attacks when the route of exposure was known. Based on incident descriptions, these acid and caustic attacks frequently targeted women and students, particularly in South Asia. Acid and caustic burns can benefit from immediate decontamination to limit the penetration of the agent used and to decrease the area of burn. Reference Gnaneswaran, Perera, Perera and Sawhney33,Reference Das, Olga, Peck, Morselli and Salek34 Deploying decontamination equipment at schools within South Asia may limit the morbidity associated with acid and caustic terror attacks.
LIMITATIONS
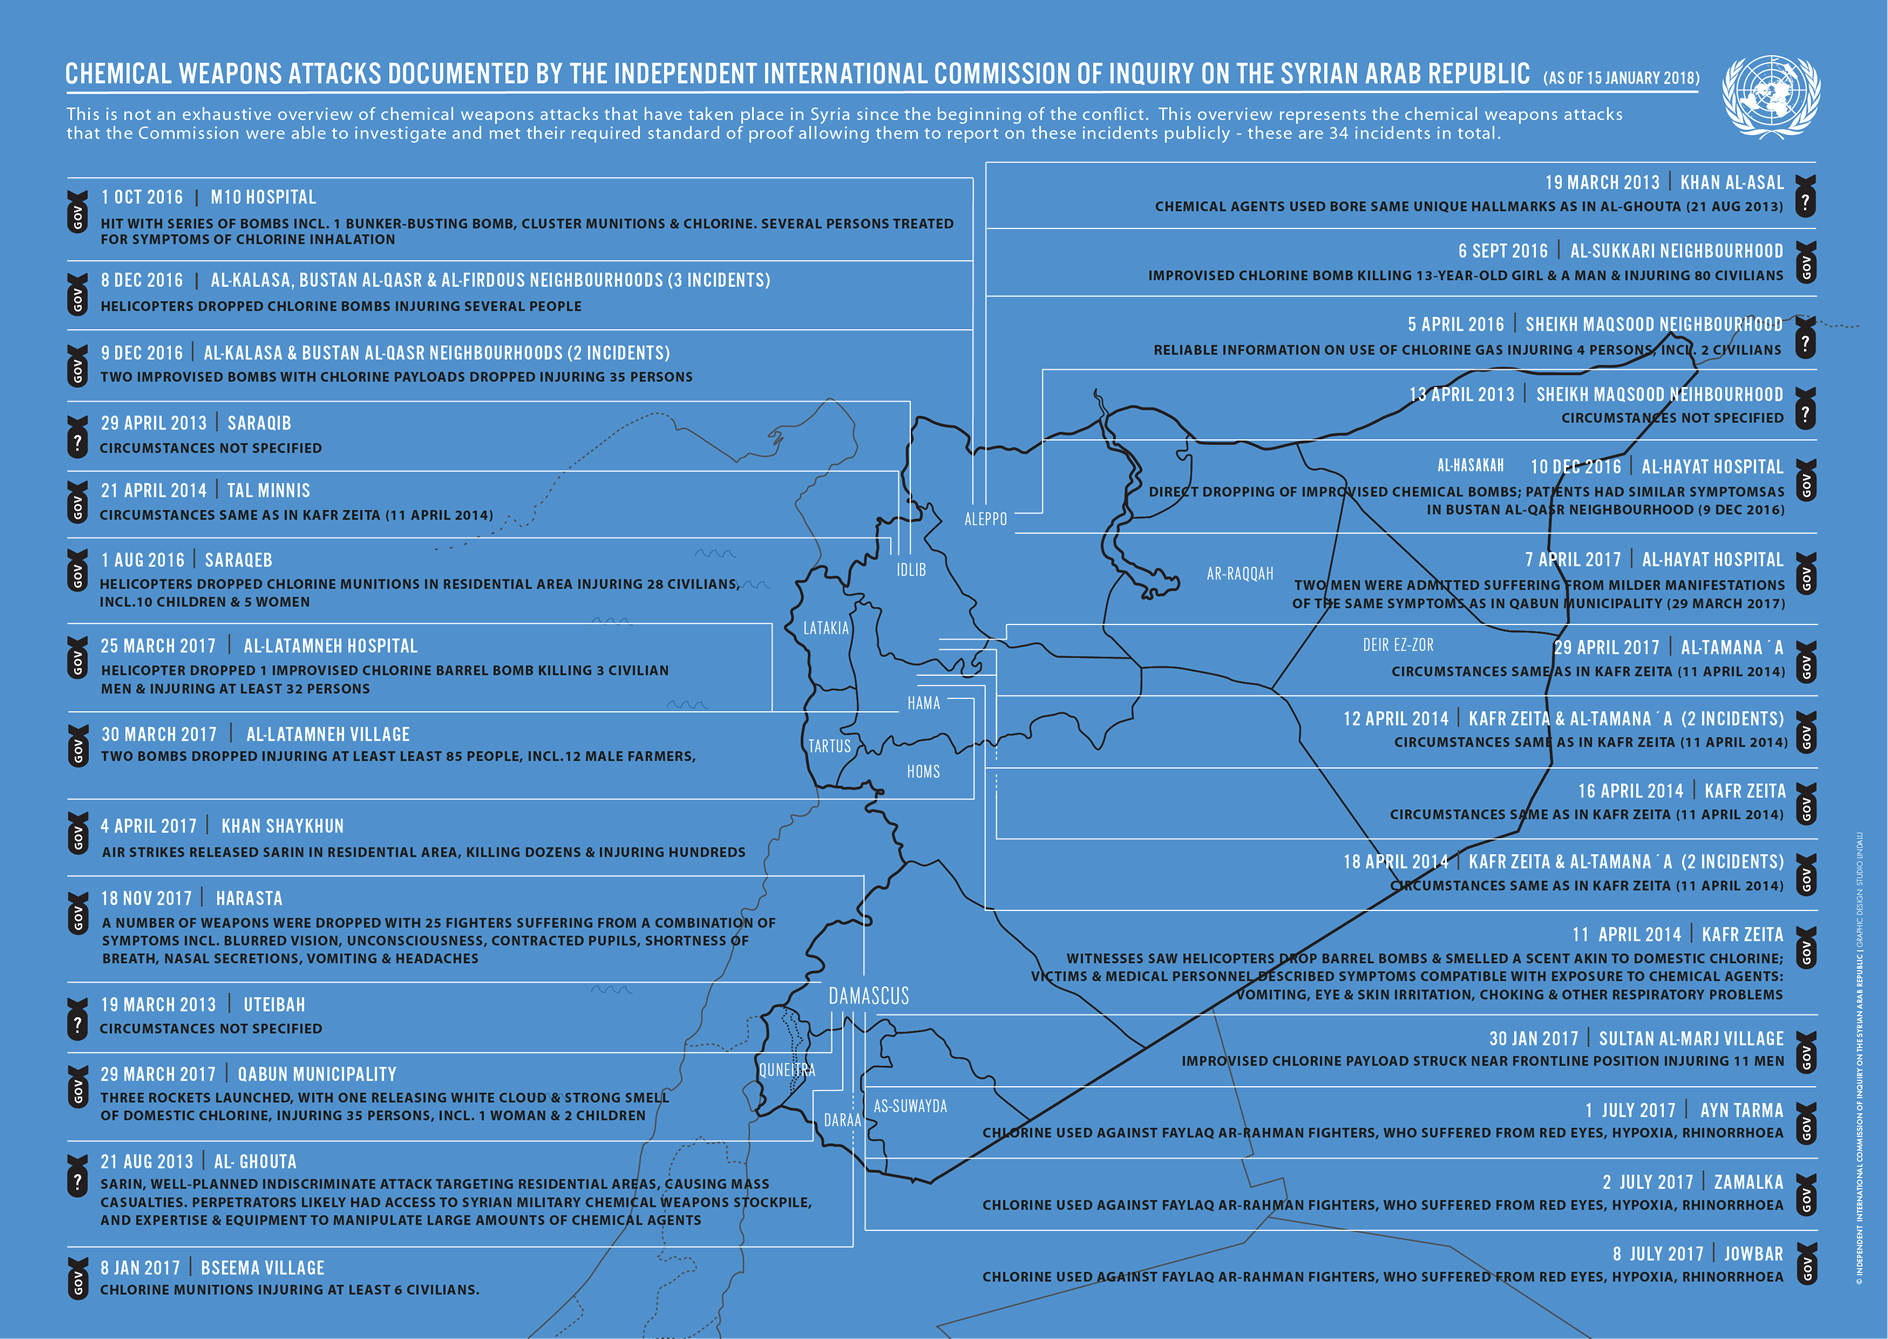
There are several limitations to this investigation. First, GTD inclusion criteria require a “sub-national actor” as the perpetrator to be included in the database. 17 This includes groups such as Aum Shinrikyo and Al-Qaeda, but excludes state actors such as a national government. This represents a limitation in the data most significantly in the case of Syria, where the vast majority of suspected state-sponsored chemical weapons attacks have recently occurred. Open source estimates of attacks by the Syrian state vary widely. In 2018, the United Nations Human Rights Council’s Report of the Independent International Commission of Inquiry on the Syrian Arab Republic found credible evidence to report 34 incidents of chemical weapon use in Syria during the conflict, with 28 attributed to the Syrian regime. 3,26 Estimates from nongovernmental organizations range from 50 to over 300 chemical attacks by the Syrian regime, which are not included in this database. 4,Reference Schneider and Lutkefend28
The details regarding specific events are in some cases limited, with variable quality of data. For the majority of attacks and casualties, the specific agent could not be identified. “Gas” or “poison” were occasionally the most specific the description of the event could be. The route of exposure could not be identified for approximately one-third of the attacks. Only about one-third of attacks could be classified into classical chemical weapons categories. These data represent worldwide terror events, with most events taking place in the Middle East and South Asia. Therefore, these findings may not be directly applicable to other regions of the world. Of note, this dataset does not stratify by age or gender, nor are specific treatment data available. Additionally, there may be bias toward more recent attacks, which tend to be more well documented and have a digital information trail. Given the relative paucity of chemical weapon terror attacks, a handful of large-scale events, such as the Aum Shinrikyo sarin attacks, have the potential to skew data. Furthermore, it is important to note that injuries and fatalities from events may come from non-chemical aspects of the attack, such as blast or firearm injuries. The data described here do not show which deaths were directly related to the chemical agent itself.
CONCLUSIONS
This descriptive retrospective review from the GTD over a nearly 50-year period demonstrates an increasing number of chemical weapons attacks globally over the last 2 decades. Chemical weapon terrorism has transitioned from agents of high mortality, such as cyanide and sarin gas, to high morbidity agents, namely chlorine gas coinciding with recent large-scale wars and conflicts. Future preparedness initiatives should focus on vulnerable targets such as private citizens and educational institutions. Increasing blast injury awareness is essential, as these devices are being used more frequently to deliver chemical agents, with prioritized training that focuses on choking agents, vesicants, and caustics. These findings can help prioritization of chemical weapons preparedness in conflict zones and inform public safety professional and military training regarding management of chemical agent exposures.
Funding Statement
PRC is funded by NIH K23DA044874 and R01DA047236, The Hans and Mavis Lopater Psychosocial Fund. EG has grant support from the Gillian Reny Stepping Strong Center for Trauma Innovation.
Data Availability Statement
The datasets analyzed during the current study are available in the Global Terrorism Database, https://www.start.umd.edu/gtd/.
Conflict of Interest Statement
The authors have no conflicts of interest to declare.
Author contributions
MAD conceived the study, collected data and completed the initial analysis. PRC and TBE reviewed initial analysis. MAD drafted the manuscript with technical assistance from PRC and TBE. EG provided key edits to the manuscript and aided in final data analysis. All authors made substantial edits to the manuscript and approve the final manuscript.
List of Abbreviations
- GTD
Global Terrorism Database
- START
National Consortium for the Study of Terrorism and Responses to Terrorism
Supplementary material
To view supplementary material for this article, please visit https://doi.org/10.1017/dmp.2020.176