




No CrossRef data available.
Article contents
Growth in stature and head circumference in high-functioning autism and Asperger disorder during the first 3 years of life
Published online by Cambridge University Press: 28 March 2006
Abstract
Little effort has been made to characterize the developmental anatomic phenotype of autism; although there is evidence of an increased head circumference and brain size, few other physical characteristics have been studied. The head circumference, body length/height, and weight measurements of infants, who were later diagnosed with high-functioning autism (HFA, n = 16) and Asperger disorder (AsD, n = 12), were extracted from health records over the first 3 years of life and compared to the measurements of a matched normal control group (n = 19). Using linear mixed-effects models, no differences were found in the average growth rate for head circumference, stature, or weight between the children with HFA and AsD. However, a significantly higher growth rate in body length/height and weight was found for the combined group of children with HFA and AsD compared to the normal control group. A trend toward higher growth rate in head circumference was also found among the former group. The results indicate that growth dysregulation in autism is not specific to the brain but also involves growth in stature.
We acknowledge the assistance of Dr. Chenyang Wang and Ms. Chelsea Cornell in data collection and collation for this study. We also thank the parents for giving us permission to obtain participants Maternal and Child Health (MCH) records, from which the data were derived, and the MCH nurses for assisting us in accessing these records.
Information
- Type
- REGULAR ARTICLE
- Information
- Copyright
- 2006 Cambridge University Press
Autism spectrum disorders are a group of pervasive developmental anomalies characterized by impairments in verbal and nonverbal communication and social interaction, and a restricted repertoire of activities and interests combined with repetitive behavior and stereotypies. Autistic disorder (classical autism) involves profound deficits in all these areas, and is associated with a wide range of cognitive functioning (Tager-Flusberg, Joseph, & Folstein, 2001). According to latest estimates, it affects 1 in 1,000 individuals in the general population with the majority (4:1) being males (Fombonne, 2003). The reliance on behavioral features in identification means that the diagnosis of autism rarely occurs prior to 3 years of age, and is even later in children without associated intellectual disability. Thus, research efforts have aimed at pinpointing biological markers to facilitate early diagnosis and intervention. Identification of such markers also help to better understand the pathomechanisms leading to these developmental anomalies.
Neuropathologic and neuroimaging studies in autistic disorder have reported developmental changes in specific regions of the brain, including the cerebellum, mesial temporal structures, brainstem, basal ganglia, frontal and parietal regions, amygdala, and the corpus callosum, although these findings have not been replicated in all studies (see Acosta & Pearl, 2003; Gillberg & Coleman, 2001, for a review). One of the most consistent anatomical findings, which consolidates evidence for the biological basis of autism, is an enlarged head circumference, found across all age groups (e.g., Bailey et al., 1995; Courchesne, Carper, & Akshoomoff, 2003; Deutsch & Joseph, 2003; Fombonne, Roge, Claverie, Courty, & Fremolle, 1999; Lainhart, 2003; Lainhart et al., 1997; Woodhouse et al., 1996). Courchesne et al. (2003) used preexisting medical records of children with autism to chart growth in head circumference between birth and 14 months in comparison to infants from two normative databases. In keeping with the data from earlier cross sectional studies, they found that 59% of the target infants showed accelerated growth trajectories in comparison to only 6% of healthy infants from a longitudinal sample. Indeed, it has recently been shown that infantile macrocephaly (i.e., head circumference >97th percentile) is associated with an increased risk of developing an autism spectrum disorder (Bolton, Roobol, Allsopp, & Pickles, 2001). The frequency of enlarged head circumference is also increased in first-degree relatives, providing evidence that this characteristic may be a familial subclinical marker of autism (Fidler, Bailey, & Smalley, 2000).
The findings of an enlarged head circumference in autism are consistent with findings of increased brain size, using magnetic resonance imaging images (Aylward, Minshew, Field, Sparks, & Singh, 2002; Courchesne et al., 2001; Piven, Ardnt, Bailey, Havercamp, & Andreasen, 1996; Sparks et al., 2002). However, although a larger head circumference has been found across the life span, the increased brain size seems to only characterize young children with autism. Courchesne et al. (2001) found that children aged 2–4 years had larger brains than matched normal controls, whereas those aged between 5 and 16 years had slightly smaller brain volumes than the control children, suggesting that the early phases of excessive growth fail to be sustained. Aylward et al. (2002) found that although children with autism aged between 8 and 12 years had larger brains, there were no differences in brain size between the adolescents and adults with autism and the age matched controls. Despite some inconsistency in the data, it appears that autism is associated with acceleration in brain growth during early childhood. These changes clearly happen after birth, as head circumference at the time of birth is either within normal limits (Courchesne et al., 2001; Lainhart et al., 1997; Ostavik, Strmme, Ek, Torvik, & Skjeldal, 1997; Stevensen, Schroer, Skinner, Fender, & Simensen, 1997), or slightly smaller (Courchesne et al., 2003).
The larger head circumference and brain size in autism have been attributed to an excess of neurons, and/or reduced synaptic pruning (Keller & Persico, 2003). The finding that increased brain volumes in young children with autism was associated with hyperplasia in cerebral grey matter, and cerebral and cerebellar white matter (Courchesne et al., 2001), has led to the suggestion that a p27 gene, known to play a role in white matter development (Casaccia-Bonnefil et al., 1997), may be involved. At the biochemical level, the enlarged brain volume has been linked to the increased levels of neurotrophins (brain-derived neurotrophic factor, neurotrophin-4, and neuropeptides: vasoactive intestinal polypeptide [VIP], calcitonin gene-related protein [CGRP]; Akshoomoff, Pierce, & Courchesne, 2002; Courchesne et al., 2001). These were found in the neonatal blood spots of infants who later received a diagnosis of autism (Nelson et al., 2001). These factors have been known to increase neuronal survival (Lewin & Barde, 1996), and to play an important role in central synapse formation and maturation (Vicario-Abejon, Owens, McKay, & Segal, 2002).
There is evidence, however, that the neurotrophic factors noted above also play an important role in immunomodulation (Nassenstein et al., 2003), angiogenesis (Kraemer & Hempstead, 2003), and body metabolism (Chaldakov, Fiore, Hristove, & Aloe, 2003). Evidence for the significant role of neurotrophins and neuropeptides (CGRP and VIP) in bone metabolism and growth (Garcia-Castellano, Diaz-Herrera, & Morcuende, 2000) suggests that the increased levels of these factors in autism may affect both brain development and linear growth. However, to date, there has been no systematic study of physical growth in individuals with an autism spectrum disorder.
Three studies to date have reported data on stature in autism. In their study of 101 males and females with autism aged 2–7 years and of mixed intellectual ability, Campbell et al. (1980) found that the participants were shorter (and heavier) than their siblings and normally developing peers. Courchesne et al. (2003) compared body length (and weight) between birth and 14 months in male and female infants with an autism spectrum disorder and healthy infants, and found no differences between the groups. The third study (Davidovitch, Patterson, & Gartside, 1996) found that enlarged head circumference was strongly related to increased height (and weight) in a mixed ability, mixed gender group of young children with autism.
The aim in the present study was to explore the possibility of generalized growth dysregulation in autism by investigating growth in stature and head circumference between birth to 3 years of age, the period during which the behavioral features that characterize autism are becoming evident. We accessed repeated head circumference, length/height, and weight measurements from early health records of infants who later received a diagnosis of high-functioning autism (HFA; i.e., autism without intellectual delay) and Asperger disorder (AsD), and compared these to the records of a matched group of healthy infants. With one exception (i.e., Courchesne et al., 2003), the majority of studies of head circumference and brain volume have used cross sectional data. However, longitudinal data are essential for a full characterization of the developmental changes that occur in an individual.
AsD represents a milder form of autism spectrum disorder, with no delay in verbal communication, and it is only one-fourth as common as autistic disorder (Fombonne, 2003). The only study of head circumference in children with this disorder showed that these individuals were more likely to have an enlarged head circumference at birth and later in development than a group of lower functioning participants with autism and a group of children with attention-deficit/hyperactivity disorder (Gillberg & de Souza, 2002). Given the behavioral similarities between individuals with autistic disorder and AsD (DSM-IV, American Psychiatric Association, 1994; International Classification of Disorders—10, World Health Organisation [WHO], 1993; see review by Macintosh & Dissanayake, 2004), and the debate regarding the diagnostic distinctions between these conditions (Bishop, 1989; Gillberg, 1989; Klin, Volkmar, & Sparrow, 2000; Wing 1991), it was of interest in this study to investigate whether children with HFA and AsD are also similar in terms of their early growth patterns.
Growth in stature and head circumference were analyzed using the linear mixed-effects model (Laird & Ware, 1982). The growth parameters estimated in the two groups of children with HFA and AsD were compared with each other and with those from matched normal controls. If the results show accelerated growth in stature as well as in head size in the children with HFA and AsD relative to the normal controls, they will suggest that growth dysregulation in these clinical conditions is not limited to the brain. Although our primary interest was to chart skeletal growth, weight data were also examined. If similarities are found in the growth parameters for the children with HFA and AsD, this will lend additional support to the view that these conditions are not distinct diagnostic entities.
Method
The sample and data collection
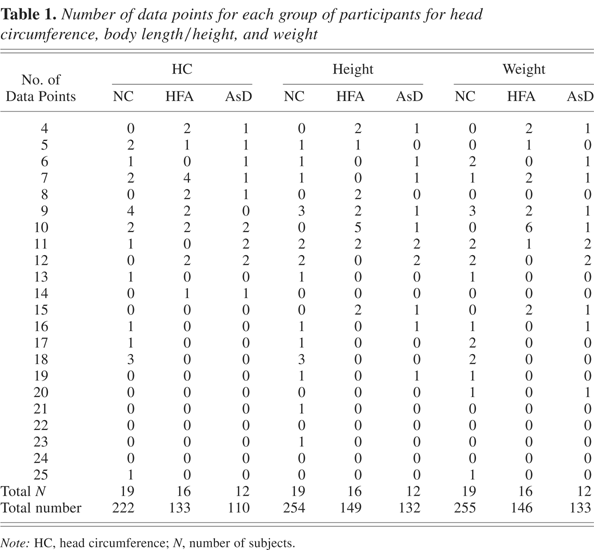
The health records of 16 children with HFA, 12 children with AsD, and 19 normally developing children (NC) were obtained from the relevant Maternal and Child Health (MCH) Centers following parental consent. None of the children had been premature at birth, and all were male and physically healthy.
Head circumference and body length/height and weight had been repeatedly measured and recorded in each participant's health charts by trained MCH nurses at routine developmental checkups between birth and 3 years of age. These measurements are taken in a standard fashion, using a measuring tape for head circumference, standard scales for weight, and a reclining measuring board for body length. Height measurements from 2 years of age were taken using a free-standing anthropometer.1
In accessing retrospective data, which was collected prior to the children being diagnosed, the possibility of bias in taking the physical measurements was eliminated. Moreover, as the measurements were taken by different nurses, the possibility of any systematic error in measurement is also unlikely. Thus, there are clear advantages in the use of such data (Courchesne et al., 2003).
Number of data points for each group of participants for head circumference, body length/height, and weight

The children in each group had participated in another study at the Child Development Unit at La Trobe University on social understanding and social responsiveness (Dissanayake & Macintosh, 2003), at which time they were aged between 4 and 11 years. The children had been recruited via advertisements placed in the publications of various autism-related organizations. All families who participated in the original study (HFA = 20, AsD = 19, NC = 20) consented to the release of their children's MCH records. Unfortunately, only a subset of records was available for use in the current study. Some records could not be located and others could not be accessed as a result of some infants being born interstate or in another country. Data were extracted from all available records, with the exception of the data from one normal child who was premature.
The children in the clinical groups had been diagnosed by experienced clinical psychologists/psychiatrists using DSM-IV (American Psychiatric Association, 1994) criteria. Clinical records and developmental histories were examined closely to confirm the diagnoses. All participants had a full-scale IQ above 70 (assessed with the short form of the Stanford–Binet Intelligence Scales, 4th edition; Thorndike, Hagen, & Sattler, 1986) at the time of their participation in the social abilities study, so that none met criteria for an intellectual disability. No participant had any known comorbid conditions.
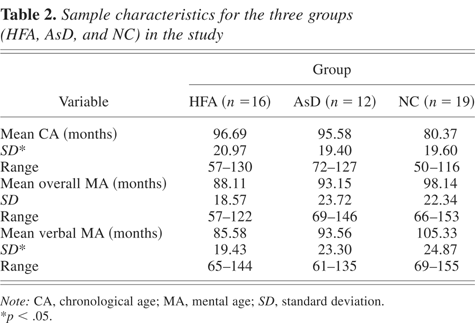
Sample characteristics at the time of the original study are presented in Table 2. The three groups were matched on overall mental age, F (2, 46) = 0.947, p = 0.395, but not on chronological age, F (2, 46) = 3.552, p = 0.037, or verbal mental age, F (2, 46) = 3.339, p = .045. Post hoc analyses indicated that the NC children were significantly younger than the children with HFA (p = 0.021) and AsD (p = 0.045) and had a higher verbal mental age than those with HFA (p = 0.014). The remaining pairwise comparisons were not significant (p > 0.1). The two clinical groups were matched on each of the developmental variables.
Sample characteristics for the three groups (HFA, AsD, and NC) in the study

Growth models
Longitudinal designs are the most appropriate for describing physical growth patterns and the variety of factors likely to influence this growth. In the balanced longitudinal design, the repeated measurements are recorded at fixed time points, and an equal number of measurements are observed for all individuals. However, incomplete and irregularly spaced observations are a common feature of growth data, usually due to early withdrawal or failure to meet scheduled appointments. Statistical methods such as repeated-measures analysis of variance or multivariate regression are unsuitable for this type of data. The linear mixed-effects model of Laird and Ware (1982) used in the current study takes advantage of the fact that the mean function of longitudinal data can often be approximated by linear or nonlinear functions, and is therefore flexible to accommodate unbalanced longitudinal data. The model consists of an overall fixed effects component and a random effects component. The fixed effects component contains population-specific parameters describing average profiles, whereas the random effects component contains subject-specific parameters, describing how the individual subject's profile deviates from the average profiles.
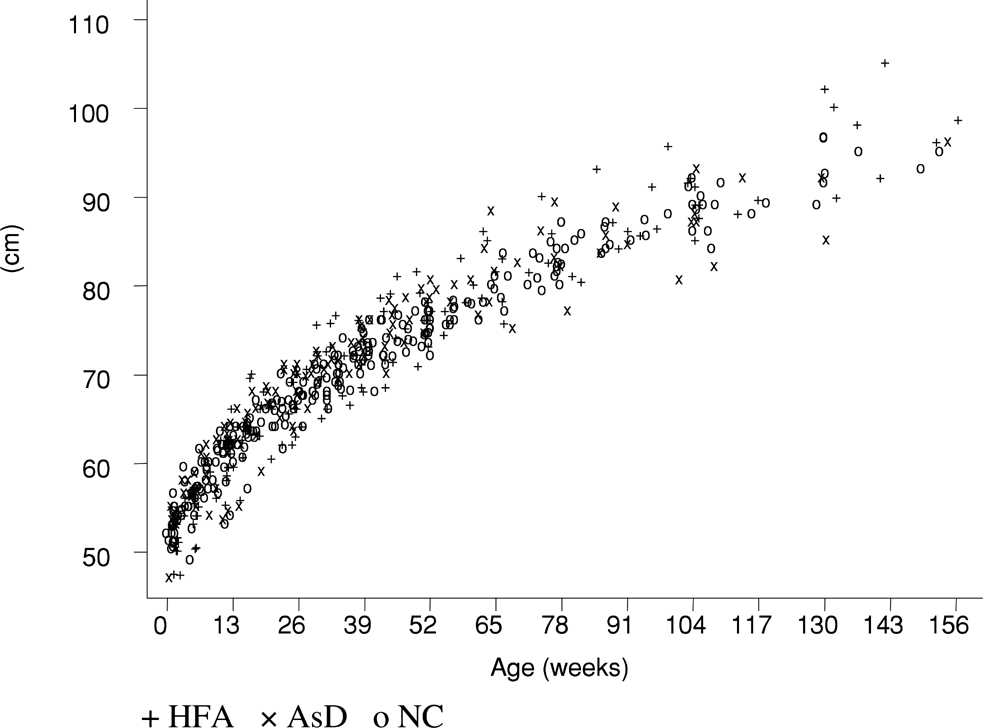
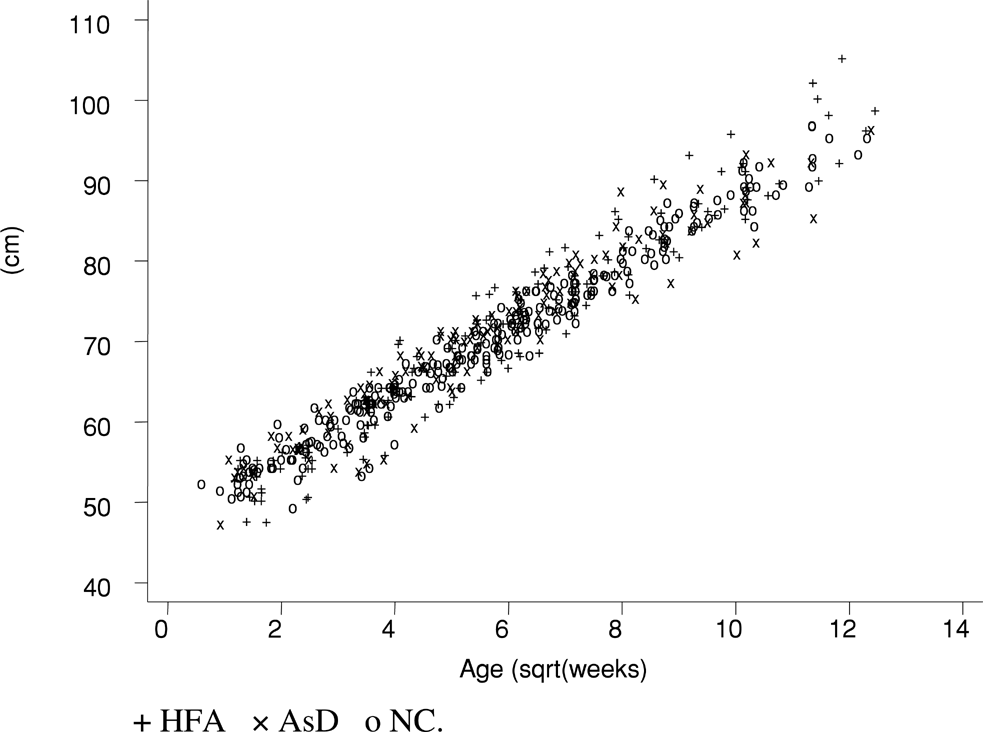
The growth of infants less than 3 years of age is typified by a high initial growth rate, which then continuously decreases. This pattern is apparent in the scatterplot in Figure 1, where body height (cm) is plotted against age (weeks) for the three groups of infants. This relationship can be conveniently simplified by applying square root transformation of age, which yields an approximate linear relationship between the variables as shown in Figure 2. This enables us to apply a simple linear model of the form

where the intercept parameter α is the measurements of infants at age 0, β is the growth rate,2
For untransformed covariate the growth rate would initially equal λβ, then would decrease proportionally to 1/ageλ−1 as age increases, and would be equal to λβ/ageλ−1 at a specific age.

A plot of the body length/height versus age for all infants (nontransformed data).

A plot of the body length/height versus the square root of age for all infants.
After group factor and random effects are incorporated, the linear mixed-effects model may be expressed as

Alternatively, this may be written as
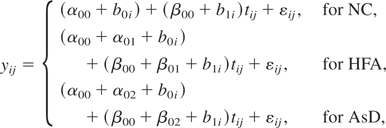
where AUi and ASi are binary indicator variables with the value of 1 if the participant belongs to the HFA group or the AsD group, respectively, and zero otherwise. In this parsimonious model, the parameters have a ready interpretation. The intercept parameter α00 is the average height, head circumference, or weight for the typical infant at age 0, whereas the parameters α01 and α02 are the average difference in the intercept between the NC children and the children in the HFA and AsD groups, respectively. The parameter b0i describes deviation of intercept of ith subject from the average intercept. The slope parameter β00 is the average age effects for the normal group, whereas β01 and β02 are the average differences in the slope between the NC group and the HFA and AsD groups, respectively. The parameter b1i describes deviation of slope of ith subject from the average slope. Comparison of average growth between all three groups, was conducted by comparing the average slopes for the respective groups.
Model 1 presented in matrix form is described in Equation A.1 in Appendix A. The assumptions of random effects and within-subject error are also described in the appendix. Equation A.2 in Appendix A describes a general functional form for within-subject error εij. Figures were plotted using the statistical package STATA (STATA Statistical Software, 1997). The extended linear mixed-effects Model 1 was fitted to the data using restricted maximum likelihood (REML) estimation method in the lme function in S-Plus software (S-Plus, 2001).
Results
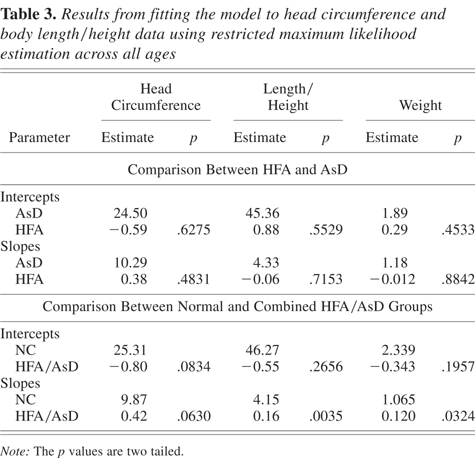
The results for the fixed effects component from fitting the extended model to the data on head circumference, body length/height, and weight across all ages for the HFA and AsD groups are presented in Table 3. Because there were no differences between these two groups on the intercept or slope estimates for either of the measures, the groups were combined for comparison with the NC group.3
The results reported below for the combined group are consistent with the results for each clinical group compared separately with the control group.
Results from fitting the model to head circumference and body length/height data using restricted maximum likelihood estimation across all ages
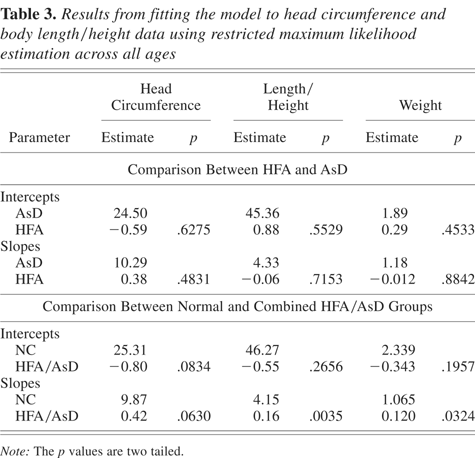
The average fitted values of head circumference for the NC and the combined HFA/AsD groups plotted against age over the first 3 years of life are presented in Figure 3a. The results of fitting the model to the data for these groups (using REML estimation) are presented in Table 3. It is apparent from Figure 3a and Table 3 that there is a trend (p = .08, two-tailed test) for the children in the combined HFA/AsD group to have a smaller head circumference initially in comparison to the NC children. Considering the previous findings of enlarged head circumference in young individuals with an autism spectrum disorder, we tested the hypothesis that head circumference growth rates are elevated using a one-tailed test. There was an average higher growth rate across the 3-year period in the HFA/AsD group than in the NC group; this is most evident between 2 and 3 years of age (p = .031; see Figure 3c), where the two curves separate at approximately 52 weeks (see Figure 3b).
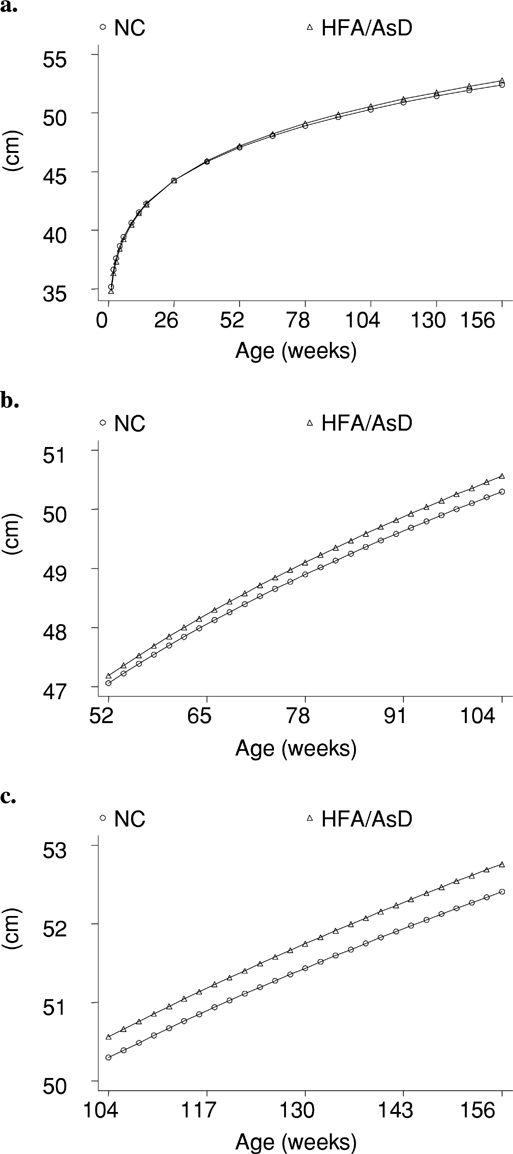
A plot of the average fitted values of the head circumference for normal and combined high-functioning autism/Asperger disorder groups versus age (weeks) using a fixed effects component for periods of (a) 0–156, (b) 52–104, and (c) 104–156 weeks.
The results for body length/height across the 3-year period in the combined HFA/AsD sample and in the NC sample, and the comparison between these two samples are shown in Figure 4a and Table 3, respectively. The increase in growth in the HFA/AsD group relative to the NC group is, again, most evident between 2 to 3 years of age (Figure 4c), with the curves beginning to separate at 52 weeks (Figure 4b). This increase is significant, with the p value (two-tailed test) for the difference between the HFA/AsD and NC slopes across all ages equal to .0035 (Table 3). The difference in growth rates in body length/height was also significant when each of the clinical groups (HFA and AsD) was individually compared to the NC group (HFA/NC: p = .002; AsD/NC: p = .025). There was no difference between the combined HFA/AsD group and the NC group in the estimated intercept values. The results for weight mirror those obtained for height, although the difference is less striking than for height (see Table 3). This may be attributed to the fact that, in infants, weight is highly volatile, as it is subject to alterations in feeding patterns as a result of illness and other anomalies, resulting in greater variability.

A plot of the average fitted values of body length/height for normal and for combined high-functioning autism/Asperger disorder groups versus age (weeks) using fixed effects component for period of (a) 0–156, (b) 52–104, and (c) 104–156 weeks.
Discussion
The study aim was to investigate growth in stature as well as in head circumference in children with HFA and AsD, and to compare it with a matched group of healthy infants. The growth curves for head circumference and body length/height (and weight) did not differ between the groups of children with HFA and AsD. When these groups were combined, a trend toward increased growth rates was evident in head circumference, across the 3-year period, in comparison to the normal control group. Growth in stature (as well as weight) was significantly increased in the children with an autism spectrum disorder relative to the normal control group, and this difference was most evident after 52 weeks of age. These findings indicate that during the first 3 years of life, growth dysregulation in autism (and AsD) may not be specific to the brain but may also involve linear growth.
The accelerated growth in the head circumference of the children with HFA (and AsD) in their first 3 years accords with the earlier findings on head circumference (Courchesne et al., 2003) and brain size (Courchesne et al., 2001). The somewhat lower value of the intercept is also consistent with Courchesne et al.'s (2003) finding of smaller head circumferences at birth in infants who were later diagnosed with autism. It is worth noting here that although Courchesne et al. found increases in head circumference between 3 and 5 months of age, the increased growth in the current study was most marked during the second and third years of life. However, direct comparison between these studies is difficult given the differences in the composition of the samples, and the different methods of data collection and analysis. Nonetheless, our data, together with that of Courchesne et al. support their hypothesis of abnormal brain growth regulation in autism (Akshoomoff et al., 2002; Courchesne et al., 2001). These data are also consistent with reports from other studies on head circumference, which used cross-sectional data from older children and adults (Bailey et al., 1995; Courchesne et al., 2003; Deutsch & Joseph, 2003; Fombonne et al., 1999; Lainhart, 2003; Lainhart et al., 1997; Woodhouse et al., 1996). However, our results clearly show that abnormal growth may not be restricted to neural growth patterns but rather indicate a global anomaly in early growth regulation in both HFA and AsD. It is now important to confirm the current findings with larger groups of infants, given the low power available to detect differences in growth rates in a small sample, such as used here.4
A study published recently, following submission of this manuscript, by Torrey, Dhavale, Lawlor, and Yolken (2004) has reported similar results in a mixed ability sample of 15 autistic children.
One possibility is the role of the increased levels of neurotrophins and neuropeptides (Nelson et al., 2001), which may account for the abnormality in brain development, as well as growth in stature (Garcia-Castellano et al., 2000). An alternative (or additional) mechanism to determine overall growth dysregulation may be related to defective synaptic pruning in autism (Keller & Persico, 2003), causing hypothalamic dysfunction and leading to abnormalities in the timing and rate of hormonal releases (Ruf, 1982). Growth hormone studies have revealed hypothalamic dysfunction in a subgroup of children with autism (Deutsch et al., 1986).
Hypothalamic dysfunction was postulated as a cause of peripubertal growth anomaly in another developmental disorder, fragile X syndrome,5
Fragile X syndrome is caused by a progressive increase in size of a trinucleotide (CGG) repeat in the X-linked fragile X mental retardation 1 (FMR1) gene (Verkerk et al., 1991). The FMR1 gene, which normally contains a repeat of 6–45 CGG trinucleotides, produces a protein (fragile X mental retardation protein) critical for brain development by ensuring normal neuronal maturation and synaptic pruning (Comery et al., 1997). If the size of CGG repeat expands into the “full mutation” range (>200 repeats), this usually leads to switching the gene off and a gross deficit of fragile X mental retardation protein, causing developmental delay.
There have indeed been reports suggesting common neurobiological mechanisms in some developmental aspects of both fragile X and non-fragile X autism. Apart from autistic-like behavioral features occurring in approximately 20% individuals with fragile X syndrome (Hagerman, 2002), there are other similarities between fragile X syndrome and autistic disorder, both at the anatomical and biochemical levels. A smaller posterior cerebellar vermis has been reported in both these conditions (Carper & Courchesne, 2000; Kaufmann et al., 2003; Reiss, Eliez, Schmitt, Patwardhan, & Haberecht, 2000), as well as defective pruning (Comery et al., 1997; Keller & Persico, 2003). Moreover, elevated daytime melatonin levels were reported in individuals with autistic disorder (Nir et al., 1995), and a similar finding was reported in children with fragile X syndrome (Gould et al., 2000). These findings, together with those of abnormal growth in both groups, indicate a necessity to undertake a study of physical growth during the peripubertal period in individuals with an autism spectrum disorder to further confirm the hypothesis of a generalized growth dysregulation, and to provide more direction regarding the specific pathomechanisms, be they biochemical and/or genetic, associated with this condition.
The similarities in the growth estimates of head circumference, body length/height, and weight in the young children with HFA and AsD in our data complements the increasing evidence for similarities in behavior between these conditions (Frith, 2004; Howlin, 2003; Macintosh & Dissanayake, 2004). A fundamental question is whether AsD should be considered as a discrete diagnostic entity separate from autistic disorder, or rather as a less severe variant in a spectrum of autistic syndromes. The finding of similar patterns of physical growth during infancy and toddlerhood in both groups, together with other findings in the literature, lends strong support to the latter hypothesis.
A better understanding of a physical phenotype of autism and associated conditions may also facilitate the development of animal models, which will be crucial for validating claims of suspected causes or the effectiveness of treatments. This is because neuropsychological and behavioral features of autism are not easily amenable to animal modelling, whereas physical anomalies are (Courchesne et al., 2001). At the clinical level, findings of generalized growth dysregulation during infancy, as indicated here, may provide a phenotypic measure to be used, together with other behavioral measures, to aid in the early diagnosis of autism. This will allow for intensive early behavioral intervention, which has been found to minimize deleterious development and behavioral sequelae in this disorder.
Appendix A
Linear mixed-effects model
Letting yi be the ni-dimensional vector of measurements for the ith subject, that is, yi = (yi1, yi2, … yni)t, the linear mixed-effects model proposed by Laird and Ware (1982) takes the form:

where β is the p-dimensional vector of fixed effects, bi is the q-dimensional vector of random effects, Xi is the (ni × p) matrix of known fixed-effects, Zi is the (ni × q) matrix of known random-effects, and εi is the ni-dimensional within-subject errors. In Model A.1 we assume bi = (b0i, b1i)t ∼ N(0, Ψ) and εi ∼ N(0, σ2Λi), where Ψ is a general (q × q) covariance matrix and assumed to be positive definite, and Λi is a (ni × ni) covariance matrix parametrized by a fixed set of parameters, and depend on i only through its dimension ni. The random effects vector and within-subject vector are assumed to be independent of each other within each subject and to be independent between different subjects.
Covariance structure for within-subject error
Initially we assumed within-subject errors in the linear mixed-effects model are independent, normally distributed random variables with mean zero and constant variance, that is, Λi = Ini. This assumption may not be realistic for growth data, where repeated measurements within subjects are often correlated, and the within-group errors have unequal variances. The extended linear mixed-effects model relaxes this assumption by allowing heteroscedactic and correlated within-group errors. Following Pinheiro and Bates (2000), the matrices Λi can decompose into two simpler matrices: one contains the variance and the other contains the correlation, that is, Λi = Vi Ci Vi, where Vi is a diagonal matrix and describes the variance structure, Ci is a positive-definite matrix with all diagonal elements equal to one and describes the correlation structure. The general variance function structure of Vi can be computed approximately by

, where

, where xij and zij denote the jth rows of Xi and Zi, vij is a vector of variance covariates, δ is a vector of variance parameters, and g(.) is the variance function and assume continuous in δ. The general correlation structure of Ci is expressed as cor(εij,ρik) = [Ci]jk = [h(|tij − tik|, ρ)] for j < k, where ρ is a vector of correlation parameters, and h(.) is a correlation function taking values between −1 and 1. The function h(.) is usually a decreasing function such that h(0, ρ) = 1 and that correlation between εij and εik depends only on the time interval between yij and yik and decreases as the length of this interval increases.
Initially, we fitted the simple linear mixed-effects model, using S-Plus software (S-Plus, 2001), where observations on the same individual were assumed independent. Next, we fitted the extended linear mixed-effects with various covariance and correlation functions. Here, the observations are no longer assumed to be independent. Several models for covariance and correlation were then considered. The final model was chosen based on smallest value of Akaike information criterion (Akaike, 1973) and the Bayesian information criterion (Schwarz, 1978), was found with variance function taking the exponential form var(εij) = σ2exp(2δSij tij) where δSij are the variance parameters with different variances per group, and correlation function cor(εij,εik) = ρij|tij−tik| for j < k, the continuous time AR(1) correlation function (Jones & Boadi-Boateng, 1991).
References
REFERENCES
Acosta, M. T., &
Pearl, P. L.
(2003).
The neurobiology of autism: New pieces of the puzzle.
Current Neurology and Neuroscience Reports,
3,
149–156.CrossRefGoogle Scholar
Akaike, H.
(1973).
Information theory and an extension of the maximum likelihood
principle. In
B. N. Petrov &
F. Csaki (Eds.),
Proceedings of the 2nd International Symposium on Information
Theory (pp.
267–281).
Budapest:
Akademiai Kiado.
Akshoomoff, N.,
Pierce, K., &
Courchesne, E.
(2002).
The neurobiological basis of autism from a developmental
perspective.
Development and Psychopathology,
14,
613–634.Google Scholar
American Psychiatric Association.
(1994).
Diagnostic and statistical manual of mental disorders
(4th ed.).
Washington, DC:
Author.
Aylward, E. H.,
Minshew, N.,
Field, K.,
Sparks, B. F., &
Singh, N.
(2002).
Effects of age on brain volume and head circumference in
autism.
Neurology,
59,
175–183.CrossRefGoogle Scholar
Bailey, A.,
Le Couteur, A.,
Gottesman, I.,
Bolton, P.,
Simonoff, E.,
Yuzda, E.,
et al.
(1995).
Autism as a strongly genetic disorder: Evidence from a British twin
study.
Psychological Medicine,
25,
63–78.CrossRefGoogle Scholar
Bishop, D. V. M.
(1989).
Autism, Asperger's syndrome and semantic–pragmatic
disorder: Where are the boundaries?
British Journal of Disorders of Communication,
24,
107–121.Google Scholar
Bolton, P. F.,
Roobol, M.,
Allsopp, L., &
Pickles, A.
(2001).
Association between idiopathic infantile macrocephaly and autism
spectrum disorders.
Lancet,
358,
726–727.CrossRefGoogle Scholar
Campbell, M.,
Petti, T. A.,
Green, W. H.,
Cohen, I. L.,
Genieser, N. B., &
David, R.
(1980).
Some physical parameters of young autistic children.
Journal of the American Academy of Child and Adolescent
Psychiatry,
19,
193–212.CrossRefGoogle Scholar
Carper, R. A., &
Courchesne, E.
(2000).
Inverse correlation between frontal lobe and cerebellum in children
with autism.
Brain,
123,
836–844.CrossRefGoogle Scholar
Casaccia-Bonnefil, P.,
Tikoo, R.,
Kiyokawa, H.,
Friedrich, J.,
Chao, M., &
Koff, A.
(1997).
Ogliodendrocite precursor differentiation is perturbed in the
absence of the clyclin-dependent kinase inhibitor p27.
Genes and Development,
11,
2335–2346.CrossRefGoogle Scholar
Chaldakov, G. N.,
Fiore, M.,
Hristove, M. G., &
Aloe, L.
(2003).
Metabotrophic potential of neurotrophins: Implications in obesity
and related diseases?
Medical Science Monitor,
9,
19–21.Google Scholar
Comery, T. A.,
Harris, J. B.,
Willems, P. J.,
Oostra, B. A.,
Irwin, S. A.,
Weiler, I. J.,
et al.
(1997).
Abnormal dendritic spines in fragile X knockout mouse: Maturation
and pruning deficits.
Proceedings of the National Academy of Science, USA,
94,
5401–5404.CrossRefGoogle Scholar
Courchesne, E.,
Carper, R., &
Akshoomoff, N.
(2003).
Evidence of brain overgrowth in the first year of life in
autism.
Journal of the American Medical Association,
290,
337–344.CrossRefGoogle Scholar
Courchesne, E.,
Karns, C. M.,
Davis, H. R.,
Ziccardi, R.,
Carper, R. A.,
Tigue, Z. D.,
et al.
(2001).
Unusual brain growth patterns in early life in patients with
autistic disorder: An MRI study.
Neurology,
57,
245–254.CrossRefGoogle Scholar
Davidovitch, M.,
Patterson, B., &
Gartside, P.
(1996).
Head circumference measurements in children with autism.
Journal of Child Neurology,
11,
389–393.CrossRefGoogle Scholar
Deutsch, C. K., &
Joseph, R. M.
(2003).
Brief report: Cognitive correlates of enlarged head circumference in
children with autism.
Journal of Autism and Developmental Disorders,
33,
209–215.CrossRefGoogle Scholar
Deutsch, S. I.,
Campbell, M.,
Perry, R.,
Green, W. H.,
Poland, R. E., &
Rubin, R. T.
(1986).
Plasma growth hormone response to insulin-induced hypoglycemia in
infantile autism: A pilot study.
Journal of Autism and Developmental Disorders,
16,
59–86.CrossRefGoogle Scholar
Dissanayake, C., &
Macintosh, K.
(2003).
Mind reading and social functioning in children with high
functioning autism and Asperger's disorder. In
B. Rapacholi &
V. Slaughter (Eds.),
Individual differences in theory of mind: Implications for typical
and atypical development (pp.
213–239).
New York:
Psychology Press.
Fidler, D. J.,
Bailey, J. N., &
Smalley, S.
(2000).
Macrocephaly in autism and other pervasive developmental
disorders.
Developmental Medicine and Child Neurology,
42,
737–740.CrossRefGoogle Scholar
Fombonne, E.
(2003).
Epidemiological surveys of autism and other pervasive developmental
disorders: An update.
Journal of Autism and Developmental Disorders,
33,
365–382.CrossRefGoogle Scholar
Fombonne, E.,
Roge, B.,
Claverie, J.,
Courty, S., &
Fremolle, J.
(1999).
Microcephaly and macrocephaly in autism.
Journal of Autism and Developmental Disorders,
29,
113–119.CrossRefGoogle Scholar
Frith, U.
(2004).
Emanuel Miller Lecture: Confusions and controversies about
Asperger's syndrome.
Journal of Child Psychology and Psychiatry,
45,
672–666.CrossRefGoogle Scholar
Garcia-Castellano, J. M.,
Diaz-Herrera, P., &
Morcuende, J. A.
(2000).
Is bone a target-tissue for the nervous system? New advances in the
understanding of their interactions.
The Iowa Orthopaedic Journal,
20,
49–58.Google Scholar
Gillberg, C.
(1989).
Asperger syndrome in 23 Swedish children.
Developmental Medicine and Child Neurology,
31,
529–531.CrossRefGoogle Scholar
Gillberg, C., &
Coleman, M.
(2001).
The biology of autistic syndromes.
London:
MacKeith Press.
Gillberg, C., &
de Souza, L.
(2002).
Head circumference in autism, Asperger's syndrome, and ADHD: A
comparative study.
Developmental Medicine and Child Neurology,
44,
296–300.Google Scholar
Gould, E.,
Loesch, D. Z.,
Martin, M. J.,
Hagerman, R. J.,
Armstrong, S. M., &
Huggins, R. M.
(2000).
Melatonin profiles and sleep characteristics in boys with fragile X
syndrome: A preliminary study.
American Journal of Medical Genetics,
95,
307–315.3.0.CO;2-3>CrossRefGoogle Scholar
Hagerman, R. J.
(2002).
The physical and behavioural phenotype. In
R. J. Hagerman &
P. J. Hagerman (Eds.),
Fragile X syndrome: Diagnosis, treatment and research (pp.
3–109).
Baltimore, MD:
Johns Hopkins.
Howlin, P.
(2003).
Outcome in high-functioning adults with autism with and without
early language delays: Implications for the differentiation between autism
and Asperger's syndrome.
Journal of Autism and Developmental Disorders,
33,
3–13.CrossRefGoogle Scholar
Jones, R. H., &
Boadi-Boateng, F.
(1991).
Unequal spaced longitudinal data with R(1) serial
correlation.
Biometrics,
47,
161–175.CrossRefGoogle Scholar
Kaufmann, W. E.,
Cooper, K. L.,
Mostofsky, S. H.,
Capone, G. T.,
Kates, W. R.,
Newschaffer,
et al.
(2003).
Specificity of cerebellar vermian abnormalities in autism: A
quantitative magnetic resonance imaging study.
Journal of Child Neurology,
18,
463–470.CrossRefGoogle Scholar
Keller, F., &
Persico, A. M.
(2003).
The neurobiological context of autism.
Molecular Neurobiology,
28,
1–222.CrossRefGoogle Scholar
Klin, A.,
Volkmar, F. R., &
Sparrow, S. S.
(2000).
Introduction. In
A. Klin,
F. R. Volkmar, &
S. S. Sparrow (Eds.),
Asperger syndrome (pp.
1–21).
New York:
Guilford Press.
Kraemer, R., &
Hempstead, B.
(2003).
Neurotrophins: Novel mediators of angiogenesis.
Frontiers in Bioscience,
8,
1181–1186.Google Scholar
Lainhart, J. E.
(2003).
Increased rate of head growth during infancy in autism.
Journal of the American Medical Association,
290,
393–394.CrossRefGoogle Scholar
Lainhart, J. E.,
Oiven, J.,
Wzorek, M.,
Landa, R.,
Santegelo, S.,
Coon, H.,
et al.
(1997).
Macrocephaly in children and adults with autism.
Journal of the American Academy of Child and Adolescent
Psychiatry,
36,
282–290.CrossRefGoogle Scholar
Laird, N. M., &
Ware, J. H.
(1982).
Random effects models for longitudinal data.
Biometrics,
38,
963–974.CrossRefGoogle Scholar
Lewin, G. R., &
Barde, Y. A.
(1996).
The physiology of neurotrophins.
Annual Review of Neuroscience,
19,
289–317.CrossRefGoogle Scholar
Loesch, D. Z.,
Huggins, R. M., &
Hoang, N. H.
(1995).
Growth in stature in fragile X families.
American Journal of Medical Genetics,
58,
249–256.CrossRefGoogle Scholar
Macintosh, K., &
Dissanayake, C.
(2004).
Annotation. The similarities and differences between Autistic
disorder and Asperger's disorder: A review of the empirical
evidence.
Journal of Child Psychology and Psychiatry,
45,
421–434Google Scholar
Nassenstein, C.,
Braun, A.,
Erpenbeck, V. J.,
Lommatzsch, M.,
Schmidt, S.,
Krug, N.,
et al.
(2003).
The neurotrophins nerve growth factor, brain-derived neurotrophic
factor, neurotrophin-3, and neurotrophin-4 are survival and activation
factors for eosinophils in patients with allergic bronchial asthma.
Journal of Experiemntal Medicine,
198,
455–467.CrossRefGoogle Scholar
Nelson, K. B.,
Grether, J. K.,
Croen, L. A.,
Dambrosia, J. M.,
Dickens, B. F.,
Jellife, L. I.,
et al.
(2001).
Neuropeptides and neurotrophins in neonatal blood of children with
autism or mental retardation.
Annals of Neurology,
49,
597–606.CrossRefGoogle Scholar
Nir, I.,
Meir, D.,
Zilber, N.,
Knobler, H.,
Hadjez, J., &
Lerner, Y.
(1995).
Brief report: Circadian melatonin, thyroid stimulating hormone,
prolactin and cortisol levels in serum in young adults with autism.
Journal of Autism and Developmental Disorders,
25,
641–654.CrossRefGoogle Scholar
Ostavik, K. H.,
Strmme, P.,
Ek, J.,
Torvik, A., &
Skjeldal, O. J.
(1997).
Macrocephaly, epilepsy, autism, dysmorphic features and mental
retardation in two sisters. A new autosomal recessive syndrome?
Journal of Medical Genetics,
34,
849–851.Google Scholar
Pinheiro, J. C., &
Bates, D. M.
(2000).
Mixed-effects models in S and S-Plus.
New York:
Springer–Verlag.CrossRef
Piven, J.,
Ardnt, S.,
Bailey, J.,
Havercamp, S., &
Andreasen, N.
(1996).
An MRI study of brain size in autism.
American Journal of Psychiatry,
152,
1145–1149.Google Scholar
Reiss, A. L.,
Eliez, S. J.,
Schmitt, E.,
Patwardhan, A., &
Haberecht, M.
(2000).
Brain imaging in neurogenetic conditions: Realizing the potential of
behavioural neurogenetics research.
Mental Retardation and Developmental Disability Research
Reviews,
6,
186–197.3.0.CO;2-9>CrossRefGoogle Scholar
Ruf, K. B.
(1982).
Synaptogenesis and puberty.
Frontiers of Hormone Research,
10,
65–72.CrossRefGoogle Scholar
Schwarz, G.
(1978).
Estimating the dimension of a model.
Annals of Statistics,
6,
461–464.CrossRefGoogle Scholar
Sparks, B. F.,
Friedman, S. D.,
Shaw, D. W.,
Aylward, E. H.,
Echelard, D.,
Artru, A. A.,
et al.
(2002).
Brain structural abnormalities in young children with autism
spectrum disorder.
Neurology,
59,
184–192.CrossRefGoogle Scholar
S-Plus.
(2001).
S-Plus 6 for windows guide to statistics
(Vol. 1).
Seattle, WA:
Insightful Corporation.
STATA.
(1997).
Statistical software. Release 5.0.
College Station, TX:
Stata Corp.
Stevensen, R. E.,
Schroer, R. J.,
Skinner, C.,
Fender, D., &
Simensen, R. J.
(1997).
Autism and macrocephaly.
Lancet,
349,
1744–1745.CrossRefGoogle Scholar
Tager-Flusberg, H.,
Joseph, R., &
Folstein, S.
(2001).
Current directions in research on autism.
Mental Retardation and Developmental Disabilities Research
Reviews,
7,
21–29.3.0.CO;2-3>CrossRefGoogle Scholar
Thorndike, R. L.,
Hagen, E. P., &
Sattler, J. M.
(1986).
The Stanford Binet Intelligence Scale
(4th ed.).
Chicago:
Riverside Publishing.
Torrey, E. F.,
Dhavale, D.,
Lawlor, J. P., &
Yolken, R. H.
(2004).
Autism and head circumference in the first year of life.
Biological Psychiatry,
56,
892–894.CrossRefGoogle Scholar
Verkerk, A. J.,
Pieretti, M.,
Sutcliffe, J. S.,
Fu, Y. H.,
Kuhl, D. P., &
Pizzuti, A.,
et al.
(1991).
Identification of a gene (FMR-I) containing a CGC repeat
coincident with a breakpoint cluster region exhibiting length variation in
fragile X syndrome.
Cell,
65,
905–914.CrossRefGoogle Scholar
Vicario-Abejon, C.,
Owens, D.,
McKay, R., &
Segal, M.
(2002).
Role of neurotrophins in central synapse formation and
stabilization.
Nature Reviews of Neuroscience,
3,
965–974.CrossRefGoogle Scholar
Wing, L.
(1991).
The relationship between Asperger's syndrome and Kanner's
autism. In
U. Frith (Ed.),
Autism and Asperger syndrome (pp.
93–121).
Cambridge:
Cambridge University Press.
Woodhouse, W.,
Bailey, A.,
Rutter, M.,
Bolton, P.,
Baird, G., &
Le Couteur, A.
(1996).
Head circumference in autism and other pervasive developmental
disorders.
Journal of Child Psychology and Psychiatry,
37,
665–671.CrossRefGoogle Scholar
World Health Organisation.
(1993).
International Classification of Diseases
(10th ed.).
Geneva:
Author.
Number of data points for each group of participants for head circumference, body length/height, and weight
Sample characteristics for the three groups (HFA, AsD, and NC) in the study
A plot of the body length/height versus age for all infants (nontransformed data).
A plot of the body length/height versus the square root of age for all infants.
Results from fitting the model to head circumference and body length/height data using restricted maximum likelihood estimation across all ages
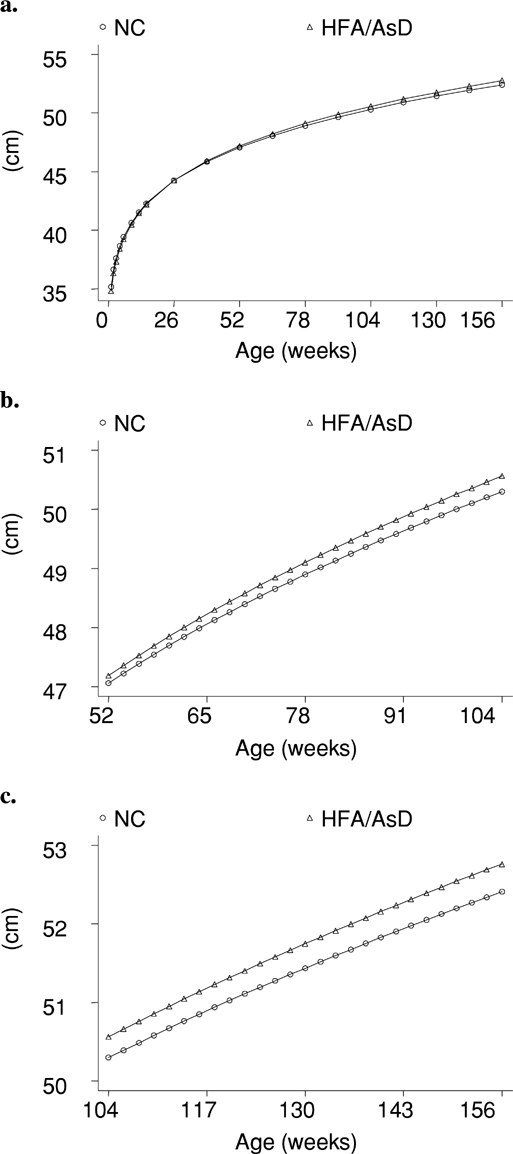
A plot of the average fitted values of the head circumference for normal and combined high-functioning autism/Asperger disorder groups versus age (weeks) using a fixed effects component for periods of (a) 0–156, (b) 52–104, and (c) 104–156 weeks.
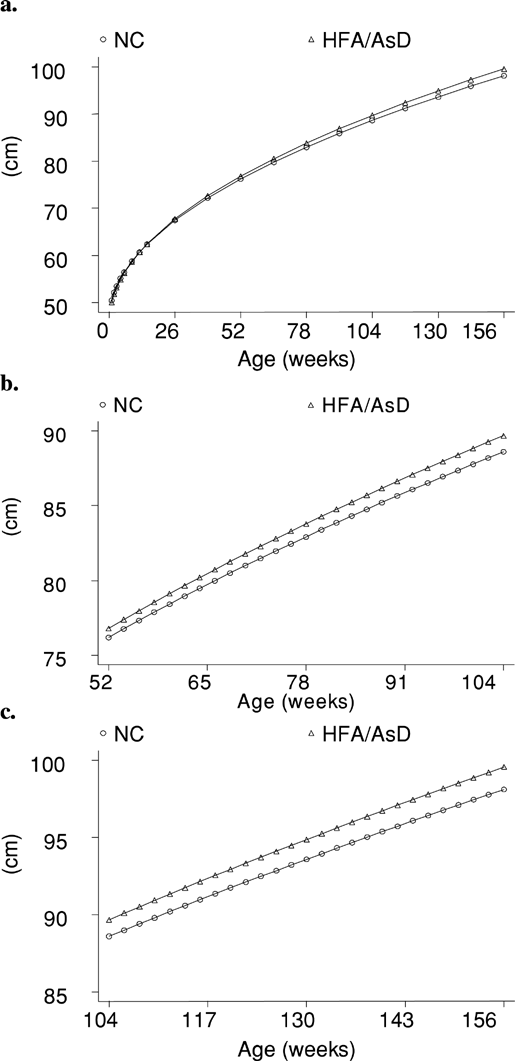
A plot of the average fitted values of body length/height for normal and for combined high-functioning autism/Asperger disorder groups versus age (weeks) using fixed effects component for period of (a) 0–156, (b) 52–104, and (c) 104–156 weeks.
 You have
Access
- 72
- Cited by