Mild Cognitive Impairment [MCI] is a syndrome or nosological and diagnostic category considered to precede certain neurodegenerative diseases even years before they appear, although it is not necessarily a precursor of them. It is a field of scientific interest in which there have been enormous changes, both theoretical and methodological, in the past 15 years and it has been the object of debate since Petersen and his group first defined it in 1999 in the Mayo Clinic of Rochester. They subsequently expanded and redefined it in 2004. Diagnostic and even conceptual advances have made such changes necessary up to the present time, because the techniques and our deeper understanding of neurodegenerative diseases have also advanced (Petersen, Reference Petersen2004; Petersen & Negash Reference Petersen and Negash2008; Petersen et al., Reference Petersen, Smith, Waring, Ivnik, Tangalos and Kokmen1999; Petersen et al., Reference Petersen, Roberts, Knopman, Geda, Cha, Pankratz and Rocca2010). The last important change is the re-conceptualization in the DSM 5 (American Psychiatric Association, 2013) of the diagnostic criteria, in which MCI is now regarded as MND (Mild Neurocognitive Disorder).
Among the major conceptual changes, we note the classification into subtypes based on the affected cognitive domains, because we have gone from a single profile or type of MCI, the amnestic (along the lines of the Mayo Clinic), to the current description of 4 types (amnestic mono-domain, amnestic multi-domain, non-amnestic multi-domain, and non-amnestic mono-domain), in which memory may or may not be involved in the deterioration. We also underwent a period— which includes our work— in which three types were described. Another conceptual change refers to another type of classification, not according to the affected cognitive domain but depending on the underlying etiology, which in turn is associated with a certain pathology and various presentation forms. Finally, the evolutionary course of MCI offers three possibilities, not contemplated until recent periods: the evolutionary, the stable, and the reversible, according to which, MCI evolves either toward a neurodegenerative disease, is stabilized, or even reverts to normal (Ganguli et al., Reference Ganguli, Snitz, Saxton, Chang, Lee, Vander Bilt and Petersen2011).
In addition, from the viewpoint of diagnostic techniques, much progress has been made in biomarkers, together with expert clinical judgment and cognitive or neuropsychological assessments. This allows obtaining genetic tests, structural magnetic resonance (MRI) and fMRI tests, and psychophysiological tests, although this cannot be done routinely, but generally only in research settings, among other reasons, due to their cost and availability (Caffarra, Ghetti, Concari, & Venneri, Reference Caffara, Ghetti, Concari and Venneri2008; Cespón, Galdo-Álvarez, & Díaz, Reference Cespón, Galdo-Álvarez and Díaz2013; Cespón, Galdo-Álvarez, Pereiro, & Díaz, Reference Cespón, Galdo-Álvarez, Pereiro and Díaz2014).
For some investigators, MCI is a condition rather than a syndrome, given its varied etiology and heterogeneous nature as an intermediate stage in the aging process between cognitive health and disease. Other researchers consider it as the precursor to Alzheimer’s disease, while for a third group of investigators, it is a confusing and poorly defined concept of little heuristic or operational value. Consequently, it has been the target of various redefinitions (Artero, Petersen, Touchon, & Ritchie, Reference Artero, Petersen, Touchon and Ritchie2006; Ritchie, Reference Ritchie2004; Ritchie, Artero, & Touchon, Reference Ritchie, Artero and Touchon2001). In the social care context, this nosological classification has become increasingly important because of its impact in the area of dependence.
Currently, we know that Alzheimer’s Disease [AD] is not the only form of dementia that can manifest early on in the form of cognitive decline. Indeed, there are other nosological entities, some yet to be clearly defined, that can be confused with prodromal AD (Dubois et al., Reference Dubois, Feldman, Jacova, Cummings, Dekosky, Barberger-Gateau and de Souza2010). These syndromes may be characterized by certain cognitive deficits, which do not evolve into a more severe form of dementia but, rather, stop and remain stable. Moreover, if some treatment [not necessarily pharmacological] or adequate approach is applied, they may even revert to normality (Comijs, Dik, Deeg, & Jonker, Reference Comijs, Dik, Deeg and Jonker2004; Díaz & Peraita, Reference Díaz and Peraita2008; Mulet et al., Reference Mulet, Sánchez-Casas, Arrufat, Figuera, Labad and Rosich2005; Nordlund et al., Reference Nordlund, Rolstad, Klang, Edman, Hansen and Wallin2010; Petersen et al., Reference Petersen, Smith, Waring, Ivnik, Tangalos and Kokmen1999). Moreover, individuals with MCI without any intervention or approach, may revert to normal, with the highest proportion of those individuals from the non-clinical samples of clinical samples (Ganguli et al., Reference Ganguli, Snitz, Saxton, Chang, Lee, Vander Bilt and Petersen2011; Saxton et al., Reference Saxton, Snitz, López, Ives, Dunn, Fitzpatrick and DeKosky2009).
In general, when MCI is detected by means of the current neuropsychological tests in addition to established clinical criteria, subjects are classified into three profiles or subprofiles, as a function of the cognitive functions or processes observed to be impaired: 1] the amnestic profile, in which memory is the single impaired cognitive process; 2] the non-amnestic profile, in which memory is not affected at all, but some other cognitive processes [such as language, executive function, or praxis] are; and 3] the multidomain profile, in which both memory and some other cognitive processes are altered (Busse, Hensel, Gühne, Angermeyer, & Riedel-Heller, Reference Busse, Hensel, Gühne, Angermeyer and Riedel-Heller2006; Migliacci, Scharovsky, & Gonorazky, Reference Migliacci, Scharovsky and Gonorazky2009). Given this logic, clinical criteria alone are seldom used, and psychometric data always play a fundamental role in diagnosis, since the results obtained on neuropsychological tests can be compared to the normative data for the reference population in those or comparable existing tests. The typical criterion for classification used in these cases consists of assigning one of three MCI profiles to the individual who performs 1.5 SDs below the mean [though sometimes only 1.0 SD is required] on one or more of the tests that assess various cognitive processes [i.e., memory, executive function, language, visuo-spatial perception, or praxis]. According to the psychometric results obtained in our research, people are considered to have: amnestic MCI [aMCI] if they only fail on two tests of [Test Aprendizaje Verbal España Complutense] TAVEC memory; non-amnestic MCI [naMCI] if they do not fail on memory tests but do fail in at least two other cognitive domains, or mixed or multidomain MCI [mdMCI], if they fail both on one memory test and other test (Alladi, Arnold, Mitchell, Nestor, & Hodges, Reference Alladi, Arnold, Mitchell, Nestor and Hodges2006; Brandt et al., Reference Brandt, Aretouli, Neijstrom, Samek, Manning, Albert and Bandeen-Roche2009; Díaz & Peraita, Reference Díaz and Peraita2008; Migliacci et al., Reference Migliacci, Scharovsky and Gonorazky2009; Petersen & Negash, Reference Petersen and Negash2008; Petersen et al., Reference Petersen, Doody, Kurz, Mohs, Morris, Rabins and Winblad2001).
It is clear that, from either a conceptual or an operational point of view, this classification has its problems. Thus, diagnosis will largely depend on the number and type of tests selected for the neuropsychological assessment, and on the availability of norms for the target population, on the ascertainment method and the criteria used to select participants, on the goals of the assessment, and on other methodological factors (Alladi et al., Reference Alladi, Arnold, Mitchell, Nestor and Hodges2006; Migliacci et al., Reference Migliacci, Scharovsky and Gonorazky2009; Peña-Casanova et al., Reference Peña-Casanova, Blesa, Aguilar, Gramunt-Fombuena, Gómez-Ansón, Oliva and Sol2009; Petersen et al., Reference Petersen, Doody, Kurz, Mohs, Morris, Rabins and Winblad2001). Additional considerations affecting the assessment have to do with whether cognitive processes are assessed exhaustively or not, whether each cognitive function is evaluated by a single test or by several, whether participants are selected from a clinical or a community setting, and whether they are recruited into a clinical study or within a research setting. Of all these issues, the most important one may be the lack of adequate norms for many tests in the age ranges involved in these studies, derived from the advanced age of the participants or from the minimal educational level achieved by very old people in many Western countries (Ganguli et al., Reference Ganguli, Snitz, Lee, Vanderbilt, Saxton and Chang2010).
There is an additional difficulty when studies of this type are of a longitudinal nature, as participants would have to be classified at each assessment point, and each MCI profile would have to be crossed with a new description of itself, as a function of its temporal evolution (Loewenstein et al., Reference Loewenstein, Acevedo, Small, Agron, Croco and Duara2009). According to the aforementioned classificatory scheme of MCI, and in relation to the temporal stability or instability of the syndrome, one can find profiles of healthy people who are stable or unstable over time, as well as profiles of MCI patients that remain unchanged over time or not (Allegret, et al., Reference Allegret, Cubera-Borrós, Vinyes-Junqué, Espinosa, Valero, Hernández and Boada2012; Díaz, García, & Peraita, Reference Díaz, García and Peraita2010; Espinosa et al., Reference Espinosa, Alegret, Valero, Vinyes-Junqué, Hernández, Mauleón and Boada2013; Loewenstein et al., Reference Loewenstein, Acevedo, Small, Agron, Croco and Duara2009; Peraita, García-Herranz, & Díaz-Mardomingo, 2012).
The previous discussion makes MCI classifications based on neuropsychological profiles rather problematic, even though such classificatory schemes remain useful. In fact, some studies address MCI with a single description (Clément & Belleville, Reference Clément and Belleville2010; Mungas et al., Reference Mungas, Beckett, Harvey, Tomaszewski, Reed, Carmichael and DeCarli2010; Nordlund et al., Reference Nordlund, Rolstad, Klang, Edman, Hansen and Wallin2010) and ignore the existing profiles, a strategy that significantly impoverishes both the health context and the therapeutic approach.
Within this context, we have previously classified a cohort of older people into subprofiles and subsequently compared the results obtained using two distinct statistical methodologies: the already mentioned psychometric approach and a K-means cluster analysis. Since outcomes of the two approaches were not consistent enough, we proposed that additional converging evidence for the profiles was timely (Díaz & Peraita, Reference Díaz and Peraita2008).
In order to solve the problems associated with earlier analyses, here we chose to use Latent Class Analysis [LCA], as it has been shown to be extremely useful to define distinct subgroups or categories of individuals (Collins & Lanza, Reference Collins and Lanza2010).
In LCA is useful to differentiate between latent variable and indicators. On one hand, the latent variable, comprised of a set of latent classes, is categorical. So, the latent variable is defined as that in which qualitative differences exist between groups of people or objects (Ruscio & Ruscio, Reference Ruscio and Ruscio2008). Applied to our data, each class must correspond to a different profile under the MCI diagnose. On the other hand, LCA model assumes that indicators are observed variables which are caused by the latent variable; so latent classes are inferred from the responses to a set of indicators. This is because LCA is considered a person-oriented approach (Bergman & Magnusson, Reference Bergman and Magnusson1997), as it involves studying individuals on the basis of their patterns of individual characteristics.
LCA includes several features of interest not included in other procedures [e.g., K-means clustering], such as: i] potential use of categorical variables, ii] computation of various diagnostic indices [i.e., BIC statistics] to determine the number of clusters, and [iii] the fact that it classifies subjects into clusters using model-based subsequent membership probabilities estimated by maximum likelihood methods, among others.
Method
Participants
Participants were 223 adult volunteers between 58 and 90 years of age. Of those, 57 (25.56%) were men, and the mean age was 72.28 years [SD: 6.41], with 9.55 [SD: 5.77] years of formal studies on average.
For participants, the main motivation for recruitment was to find out about their cognitive health status. In all, a total of 550 assessments were performed, of which 3 were eliminated because they were incomplete: 223 participants had one assessment, 179 had two assessments, and 145 had three yearly assessments, since the study was longitudinal. The sample was selected from cultural and educational centers for the elderly in two municipalities of the Region of Madrid.
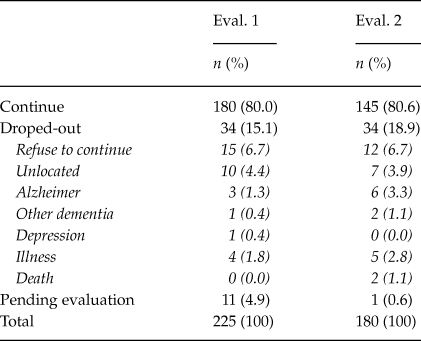
Selection criteria for eligibility in the study were as follows: individuals between the age of 58 and 90, residing in the municipalities of Las Rozas or Pozuelo de Alarcón [Region of Madrid, Spain], who were interested in participating in the study and undergoing a formal assessment of memory function, whether out of personal interest or because they had subjective memory complaints. Potential participants were told that they would be informed of their cognitive status at the end of the study. Exclusion criteria were: i] to be diagnosed with a neurodegenerative disease; ii] to have an MCI formal diagnosis by a neurologist; iii] to suffer from a disabling chronic disease; iv] to have a psychiatric diagnosis; v] to demonstrate a significant cognitive impairment, such as aphasia, agraphia, alexia and/or apraxia; and vi] to have a severe sensory or perceptual deficit (Díaz & Peraita, Reference Díaz and Peraita2008). Given the type of sample, high attrition rates were expected due to death, lack of interest, change of address, illness, and the like. In our study, the initial number of persons assessed in the first year, 223, decreased to 145 by the third assessment; in other words, we were able to retain 65% of the sample over the three-year period [table 1]. We would like to emphasize the significance of retaining such high number of participants over time in a study of this nature, given the difficulty of recruiting older volunteers in non-clinical or non-hospital settings, due to our interest in following up their cognitive status. Drop-outs data were not imputed due, primarily, to the exploratory nature of this study, but also because any imputation will artificially bias the results by increasing the stability for the estimated classes. Furthermore, from evaluation 1 to 2, only nine participants were dropped-out for reasons related to physical or psychological illness (which constitutes only 4% of the total sample). This percentage rises to 7.2% from evaluation 2 to 3 (8.3% of the participants in evaluation 2 if we include drop-out by death).
Permanency and attrition for subjects from one evaluation to the next

Subjects were classified into three profiles of MCI, as a function of the cognitive functions impaired. According to the psychometric results obtained, people are considered to have: amnestic MCI [aMCI], if they only fail on tests of memory; non-amnestic MCI [naMCI], if they do not fail on memory tests but do in other cognitive domains; or mixed or multidomain MCI [mdMCI], if they fail on both memory tests and other cognitive domains.
Measures
The battery was chosen based on of several criteria, such as test validity and reliability, frequency of use within the scientific community, and availability of Spanish norms, when possible. The neuropsychological tests included assessed the following cognitive processes: language [verbal and semantic fluency], visual and verbal learning, episodic memory, attention and executive function, praxis, assessed by the following tests: semantic and phonemic fluency (Peña-Casanova, Reference Peña-Casanova1991; Peraita, González-Labra, Sánchez-Bernardos, & Galeote, Reference Peraita, González-Labra, Sánchez-Bernardos and Galeote2000); Test Aprendizaje Verbal España Complutense TAVEC (Benedet & Alejandre, Reference Benedet and Alejandre1998), Rey Complex Figure-Recall (Rey, Reference Rey2003); Trail Making Test, Forms A and B (Reitan & Wolfson, Reference Reitan and Wolfson1993); Figure Copy from the Test Barcelona (Peña-Casanova, Reference Peña-Casanova1991), and copy of drawings and ideomotor praxis from the Test Barcelona, and Rey Complex Figure. In addition, we administered a depression scale [Geriatric Depression Scale] (Yesavage et al., Reference Yesavage, Brink, Rose, Lum, Huang, Adey and Leirer1983), a test of general cognitive functioning [Mini Examen Cognoscitivo, MEC] (Lobo et al., Reference Lobo, Ezquerra, Gómez, Sala and Seva1979), and a dementia scale [Blessed Dementia Scale] (Blessed, Tomlinson, & Roth, Reference Blessed, Tomlinson and Roth1968). The goals were: to establish subjects’ cognitive profiles, to determine whether they were cognitively intact or with MCI, depending on their test performance, and to classify them as aMCI, naMCI, or mdMCI.
Procedure
The neuropsychological assessments were carried out by a team of psychologists at municipal centers belonging to the City Halls of Las Rozas and Pozuelo de Alarcón [Madrid]. Except for a few instances where assessments were carried out at the participant’s home and at the Faculty of Psychology of the Universidad Nacional de Educación a Distancia [UNED]. The assessment lasted approximately 1 hour and 45 minutes. Before the neuropsychological test battery was applied, participants were informed about the general purpose of the study and of their involvement therein and signed informed consent forms and were interviewed on their personal, socio-demographic, and clinical histories. They then underwent the test battery. The study was approved by the Bioethics Committee of the UNED.
Statistical analysis
Data were analyzed using Latent Class Analysis [LCA], a statistical method used to identify underlying unobserved categorical variables by means of which a population is divided into a set of exhaustive and mutually exclusive ‘latent classes’ (Collins & Lanza, Reference Collins and Lanza2010; Lanza & Rhoades, Reference Lanza and Rhoades2013). Latent classes are inferred from the responses to a set of measured items, with no information about an individual’s class membership. The following equation expresses the probability of observing a particular vector of responses y as a function of the probabilities of membership in each latent class [γc] and the probabilities of finding each response rj to an item j conditioned to latent class, c, membership [ρj,rj|c]:
 $$P({\bf{Y}} = {\bf{y}}) = \sum\limits_{c = 1}^C {{\gamma _c}\prod\limits_{j = 1}^J {\prod\limits_{{r_j} = 1}^{{R_j}} {\rho _{j,{r_j}\left| c \right.}^{I({y_j} = {r_j})}} } }$$
where I[yj = rj] represents an indicator function that equals 1 if the response to item j is rj, and 0 otherwise (Collins & Lanza, Reference Collins and Lanza2010). The goal of LCA is to estimate the γ and ρ parameters through maximum likelihood procedures. In the present study, the test scores included in the analysis were: MEC; Trail Making A; Trail Making B; Rey Complex Figure, Time; Phonemic Fluency; Semantic Fluency; Ideomotor Praxis; Constructive Praxis; Alternating Graphs and Loops; Quality Time; TAVEC: immediate free recall [lists A and B], short-delay free recall; short delay cued recall; long delay free recall; long delay cued recall; and recognition.
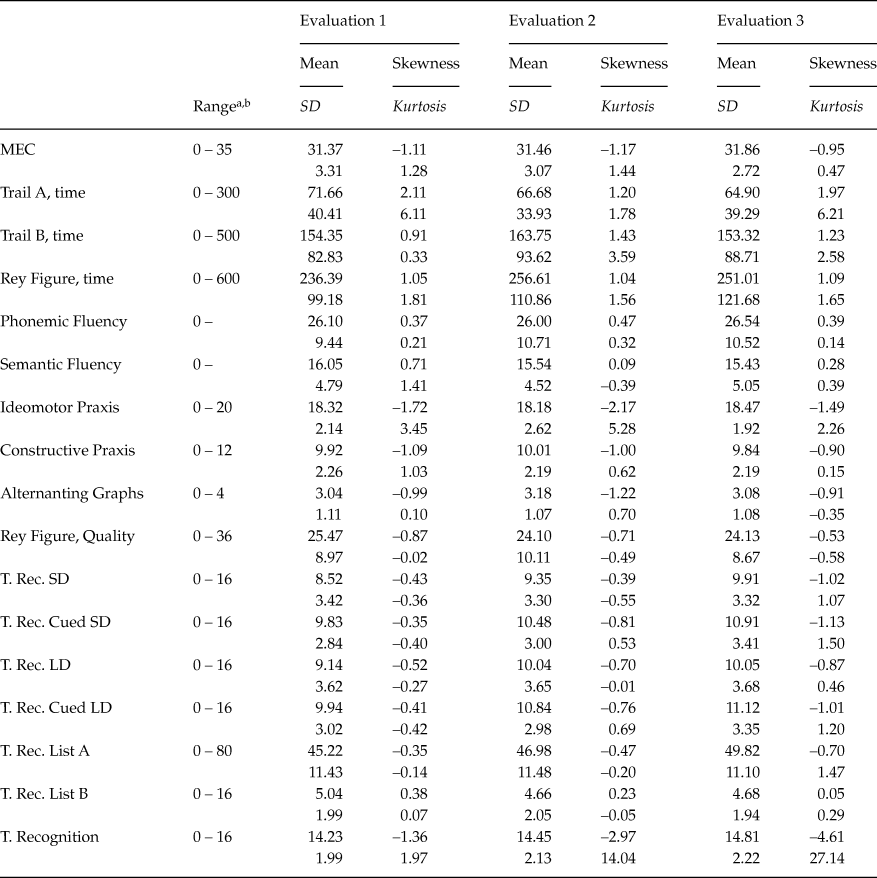
Before carrying out the LCA, initial descriptive analyses showed low frequency of missing data [1.12%, 1.25%, and 0.96% for each of the three consecutive years, respectively], but a closer analysis indicated that missing data were not missing at random, because independent t-tests for mean comparisons between subgroups [with vs. without missing data] yielded statistically significant differences for more than half of the tests. So we performed missing data multiple imputation [five values per missing data] through the SPSS 19 multiple imputation procedure in order to retain the information about the relevant participants in multivariate procedures. We used the 17 variables previously mentioned as predictors, plus some other demographic [age, educational level] and health-related [depression, stroke, mood changes, hypertension] variables. Moreover, results from two screening tests were included [Yesavage and Blessed Scales]. In addition, exploratory analysis showed that variable distributions were far from normal, as descriptive statistics often showed high values for skewness and kurtosis [see Table 2], a result we anticipated, as it is usual for some participants in this age range to show various deficits. Thus, around 12 out of 17 variables yielded extreme values.
Descriptive statistics for the variables included in the study for each of the three annual evaluations

Note: MEC = Mini Examen Cognoscitivo; T = TAVEC; Rec= Recall; SD= Short delay; LD = Long delay
a Tests measuring time (Trail A, Trail B, Rey Figure time) show upper limits allowed (no subjects reached them in this study).
b Phonemic Fluency test and Semantic Fluency test have no upper limit, as they count the number of words emitted by the participants.
We proceeded to dichotomize the variables of the study so that they would allow us to describe participants’ performance in one of two categories: adequate or low/poor. Unfortunately, one of the main problems is the lack of standardized criteria for some of the tests for this segment of the population, and for different educational levels. So, an alternative is the use of the mean and standard deviation, but the results of the exploratory analysis, in particular the skewed frequencies, on the one hand, and the need to retain the information contained in the extreme values, on the other, made it unwise to use cut-off points based on the mean and standard deviation [see results in Table 2].
We, therefore, chose to use percentiles and settled for the 40thpercentile, mainly for two reasons: first, percentiles avoid dependences on asymmetry distortions [see Table 2] and, secondly, 40thpercentile compensates the possible under-diagnoses bias present in our society. Thus, we coded participants’ performance as inadequate in those cases in which the score was below the 40th percentile or, for the variables that measured time, when the score was above the 60th percentile [Trail Making A, Trail Making B, Time in the Rey Complex Figure].
The use of an apparently high value as the threshold forum satisfactory performance [that is, the 40% of participants with poorer performance] is compensated by the fact that this age group generally performs more poorly than the population taken as a whole (Zacks, Hasher, & Li, Reference Zacks, Hasher, Li, Craik and Salthouse2000).
Analyses were carried out by means of PROC LCA V. 1.2.5 Beta (Lanza, Collins, Lemmon, & Schafer, Reference Lanza, Collins, Lemmon and Schafer2007; Lanza et al., Reference Lanza, Lemmon, Dziak, Huang, Schafer and Collins2010), a procedure developed for SAS in which parameters are estimated by maximum likelihood using the expectation-maximization algorithm.
Results
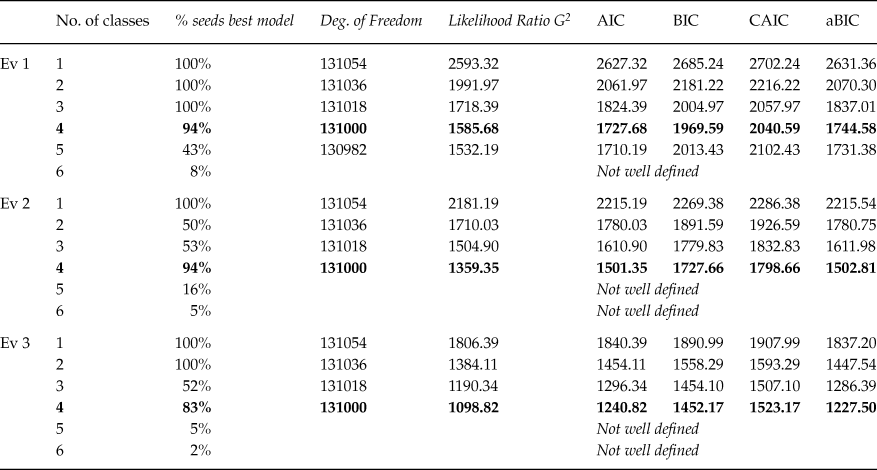
For each one of the three successive annual assessments, one per year, the procedure was adjusted from 1 to 6 latent classes. Results are shown in Table 3. The choice of the best outcome was based, on the one hand, on statistical criteria [i.e., the existence of a single well-identified solution and the fit indexes] and, on the other, on theoretical and practical criteria, which led us to select the solutions for four latent classes, as explained below.
Comparison of models for each evaluation

Note: AIC = Akaike Information Criterion; BIC = Bayesian Information Criterion; CAIC = consistent AIC; a BIC = adjusted BIC. The best solution for each evaluation appears in bold typeface.
Regarding criteria for model identification, the procedure was computed using 100 random starting values [generated from an arbitrary seed] for each evaluation and number of latent classes [see results in Table 3]. The convergence criterion was the maximum absolute deviation, which was set at 1.0e-6. Furthermore, in order to avoid solutions based on local maxima, the procedure to obtain solutions for [the finally selected] four latent classes was repeated for 10 different arbitrary seeds. Results show that the ten repetitions reach exactly the same solution for the three evaluations, with a percentage of seeds converging for the best solutions between 94–99%, 93–99% and 72–83% for years 1, 2 and 3, respectively. As seen in Table 3, adequate model identification is reached only for classes 1 to 4 in evaluation 1, 1 and 4 for evaluation 2, and classes 1, 2 and 4 in evaluation 3.
Table 3 also shows some fit indices and information criteria, such as the Likelihood Ratio G2, the Akaike Information Criterion [AIC] (Akaike, Reference Akaike, Petrov and Csaki1973), the Schwarz Bayesian Information Criterion [BIC] (Schwarz, Reference Schwarz1978), the consistent AIC [CAIC] (Bozdogan, Reference Bozdogan1987), or the adjusted Bayesian Information Criterion [a BIC] (Sclove, Reference Sclove1987). For all of the proposed indices the decision procedure implies selecting the model with the lowest value. Once the percentage of seeds converging leads us to discard the solutions for the models with five or more latent classes, it is easy to see that the solution of four latent classes shows the lowest values for the four indices that were previously mentioned.
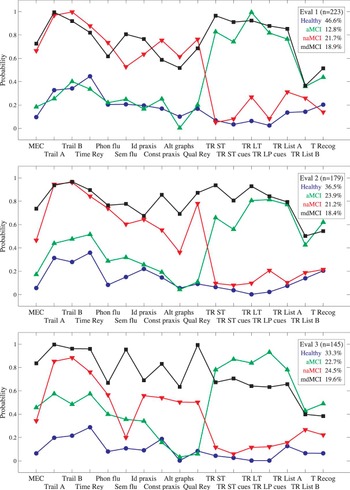
In the present study, we also found two sets of measures; memory: short term recall, short delay recall with cues, long term recall, long delay recall with cues, inmediate recall and recognition, and executive function plus praxis: Trail A, Trail B, Rey Figure time and quality, Phonemic fluency, semantic fluency, ideomotor praxis, constructive praxis, alternanting graph, whose combinations led to four patterns related to low-performance responses: healthy, where both sets of measures have low associated probabilities; mdMCI, where the associated probabilities of both sets of measures are high; aMCI for which only the memory set has a high probability of occurrence, and naMCI, with high probability only in the executive function-praxis set.
Two important measures regarding the utility of the latent classes obtained in any given analysis are homogeneity and class separation (Collins & Lanza, Reference Collins and Lanza2010). When we say that a latent class is highly homogeneous, it implies that the response patterns for people classified within that class are very similar or that such patterns are very characteristic of that class. Latent class separation, when fulfilled, refers to the fact that a response pattern with a large probability of occurrence, given certain latent classes, will have much smaller probabilities of occurrence, given any other latent class. Figure 1 shows how the four latent classes obtained here display both properties. On the one hand, high levels of homogeneity mean that each latent class is associated with a single, characteristic response pattern: healthy [low, low], aMCI [low, high], naMCI [high, low], and mdMCI [high, high]. On the other hand, the probabilities associated with each latent class are far apart, especially for the memory-related variable.
Profiles for four-class model in each of the three annual evaluations.
Dots represent the probability of performance being poor (i.e., a score below the 40 th percentile) for each test contingent on latent-class membership.

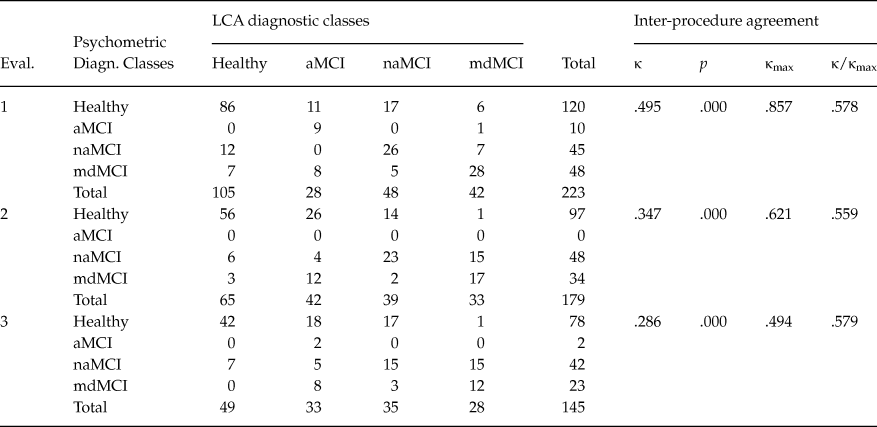
Table 4 compares psychometric diagnoses with those obtained by LCA. Cohen’s kappa coefficient (Cohen, Reference Cohen1960) for each evaluation shows agreement between psychometric and LCA classification. The coefficients show moderate agreement but having similar values from wave to wave. To compare them, they have to be divided by their κ max values, as shown in Table 4 (Umesh, Peterson, & Sauber, Reference Umesh, Peterson and Sauber1989).
Contingency tables for psychometric and LCA diagnostic classification

Note: aMCI = amnestic MCI; naMCI = non-amnestic MCI; mdMCI = multidomain MCI; κ = Cohen’s Kappa coefficient of agreement; κmax = maximum value kappa could achieve given unequal distributions.
Finally, another property of LCA estimations is the classification certainty, that is, the probability of membership in a latent class, given a particular response pattern. Our estimations showed high classification certainty, as a large percentage of the participants [89%, 89%, and 92% for evaluations 1, 2 and 3, respectively] were assigned to latent classes with a probability higher than 0.90.
Discussion
The aim of this study was to corroborate the existence of three cognitive profiles of impairment in elders, and four profiles of cognitive function, if healthy older people are also considered. For this purpose, we used the statistical procedure of LCA. We wanted to confirm those MCI profiles that had been previously obtained and described with different statistical procedures.
As we already mentioned, we considered each one of the three yearly assessments separately, using the 40thpercentile as the cut-off point for a solution of 4 groups, which was the one that presented the best fit. Already the results of the LCA for the first neuropsychological assessment were very similar to the four profiles described in the solution adopted by Díaz & Peraita (Reference Díaz and Peraita2008) in which the cut-off point was -1.5 SDs below the mean, as has been common in previous studies using similar criteria (Loewenstein et al., Reference Loewenstein, Acevedo, Small, Agron, Croco and Duara2009; Migliacci et al., Reference Migliacci, Scharovsky and Gonorazky2009). Therefore, there seem to be four basic profiles; two of them showing good performance in memory tests, and the other two with poor performance. Of the two groups with no impairment in episodic memory, there is one group of non-amnestic MCI subjects and one healthy group [considered “healthy” with respect to general cognitive function, as they did show some deficits in executive function, particularly on the Rey Complex Figure and on the Trail Making Test, Form B]. Of the two groups with poor performance on memory tests, one also showed problems in all other cognitive functions; this could probably be considered equivalent to mdMCI. The other group only presented with memory problems and could be equivalent to the aMCI type. These results suggest that there is indeed an exclusively amnestic syndrome, as advocated by Petersen and his colleagues (Petersen, Reference Petersen2004, Petersen et al., Reference Petersen, Smith, Waring, Ivnik, Tangalos and Kokmen1999, Petersen et al., Reference Petersen, Roberts, Knopman, Geda, Cha, Pankratz and Rocca2010). In contrast with their claims, however, the aMCI type, which is assumed to evolve into AD within a short period of time, is not the most frequent; instead, it appears to be the least frequent in some studies, though its prevalence continues to be a very controversial topic (Ganguli, Dodge, Shen, & DeKosky, Reference Ganguli, Dodge, Shen and DeKosky2004; Manly et al., Reference Manly, Tang, Schupf, Stern, Vonsattel and Mayeux2008).
With respect to our first assessment, although the healthy and aMCI groups, on the one hand, and the naMCI and mdMCI groups, on the other, parallel each other in certain cognitive skills, they cannot be equated in terms of memory function; in that domain, groups aMCI and mdMCI showed similarly poor performance, while healthy and naMCI groups resemble each other in terms of adequate memory function. However, participants in the healthy and aMCI groups are much more homogeneous than those in the naMCI and mdMCI groups in their likelihood of falling below the 40thpercentile in tests other than those that assessed memory function.
On the second assessment, performance patterns were practically the same as on the previous evaluation, corroborating the presence of four well-differentiated classes. Perhaps the most relevant piece of data was the decrease in the percentage of healthy participants [from 46.6% to 36.5%], along with an equivalent increase in the group of aMCI participants [from 12.8% to 23.9%]. We are left with profiles that correspond to those described in previous research: there is still a cognitively healthy group, and there are still three impaired groups with global deterioration profiles, as in the first assessment. Even though longitudinal trajectories, in terms of the cognitive status of each group with respect to the previous year, could only be ascertained by means of a latent transition analysis [currently undergoing in our laboratory], we have included here these limited and descriptive percentage data. This finding confirms previous results in that it shows that some individuals are very stable over time, while others are rather variable in their MCI and can switch diagnostic group each year.
On the third assessment, though latent classes continue to meet the homogeneity criterion, the separation among them is significantly less, that is, we observe that differences in probabilities among classes are now lower, particularly between the aMCI and the naMCI classes in terms of tests of executive function and praxis. This last consideration was to be anticipated, given the lower number of participants. The probability distribution of being below the 40thpercentile varies considerably, as we can observe in the first two distributions, and the groups or profiles are not as clearly defined as in previous assessments. There is still a healthy group, with a high probability of performing well on the various tests over time, but the amnestic group’s performance on tests of executive function worsens considerably and is significantly below the performance of the healthy group.
Regarding theoretical and practical criteria, the four latent classes solution show a strong resemblance to schemes that were previously proposed (Busse et al., Reference Busse, Hensel, Gühne, Angermeyer and Riedel-Heller2006; Migliacci et al., Reference Migliacci, Scharovsky and Gonorazky2009). Also, a recent study (Díaz-Mardomingo, Chacón, Martínez, & Peraita, Reference Díaz-Mardomingo, Chacón, Martínez and Peraita2012) showed a similar distribution of these measures through exploratory factor analysis of a broad range of tests, where the two-factor solution resulted in one memory factor and a second factor that includes praxis and executive function tests. This exploratory factor analysis showed that all cognitive processes being assessed in the study by means of 16 tests could be reduced to two large cognitive domains: on the one hand, memory and verbal learning tests [except for the recognition test] and, on the other, attention and executive function tests, as well as praxis and semantic fluency tests. The goal of this analysis was to determine if and how the duration [in time] of the neuropsychological assessments could be reduced.
In sum, this study clearly demonstrates the existence of four cognitive profiles in MCI and confirms previous characterizations of MCI that were based on psychometric criteria. One of the limitations of this study is the performance of LCA requires data to be dichotomized. In this procedure leads to a loss of variability in the cognitive scores.
Cognitive deterioration in the elders is diverse in its manifestation, so that we can talk about profiles and subprofiles according to the various impaired cognitive functions, and not limit classification schemes to three distinct cognitive profiles.
It is important to investigate in detail the etiology of each of these modalities in order to estimate their developmental trajectories over time, since they do not appear to always have a pathological course or outcome.
Clinical judgments are of limited use. Therefore, it is necessary to conduct a battery of neuropsychological tests to ensure that all developmental cognitive processes involved have been assessed.
Given the reversibility of the syndrome in some instances, early detection and pharmacological and non-pharmacological interventions are of primary importance, despite remaining ambiguities with respect to the potential success of existing interventions.
Neuropsychological evaluations should be accompanied by a study of biomarkers, such as MRI, genetics, event-related potential, etc.
There may be individuals who remain cognitively healthy but who, at some point in their lives and for various reasons, could be considered to have some form of MCI.
Implications derived from this study could be summarized briefly: The classification of MCI by means of LCA shows a certain convergence with that obtained by psychometric criteria in terms of number and type of classes.
Finally, we are providing new evidence with respect to procedures that could be used to better understand MCI. Although, in talking about diagnosis in the strictest sense, there ought to be a clearer convergence among the various procedures or methods.