





The contribution of teacher quality to differences in student achievement is typically studied using value-added models, which usually assess relative year-on-year changes in achievement across teachers within an educational community such as a school. Estimates of these teacher effects for literacy vary from small, at around 3%, to moderate, 16%, and for numeracy from 6 to 13% (Nye et al., Reference Nye, Konstantopulos and Hedges2004; Rowan et al., Reference Rowan, Correnti and Miller2002).
Additional research into classroom-level effects on student achievement is warranted by the degree of uncertainty surrounding the results and their interpretation. Importantly, it is difficult to disentangle effects due to teacher quality from other processes operating at the classroom level, sometimes referred to as classroom climate (Fraser, Reference Fraser2012). Likewise, disentangling classroom effects from any due to differing ability profiles across classrooms, even employing covariates such as socioeconomic level, represents the standard problem of control in much nonexperimental behavioral research. These and other considerations have led Konstanopoulos (Reference Konstantopoulos2014, p. 17) to conclude, with respect to using value-added models to evaluate teacher effectiveness, ‘[w]e… need much more empirical evidence with respect to the reliability and the stability of value-added measures…. The findings thus far do not seem robust and conclusive enough to warrant decisions about raises, tenure, or termination of employment.’
In previous research (Byrne et al., Reference Byrne, Coventry, Olson, Wadsworth, Samuelsson, Petrill, Willcutt and Corley2010; Grasby et al., Reference Grasby, Little, Byrne, Coventry, Olson, Larsen and Samuelsson2020), we took advantage of substantial twin samples where pairs either shared or did not share a classroom as an approach to estimating classroom effects. An earlier study of literacy and numeracy achievement in UK twins used the same structure (Walker et al., Reference Walker, Petrill, Spinath and Plomin2004), and though the authors did not explicitly calculate variance attributable to classroom status, they report higher nonshared environment effects for twins in separate classes. As we describe below, this can be interpreted as evidence of a classroom effect, possibly including teacher quality, on student achievement.
The Byrne et al. (Reference Byrne, Coventry, Olson, Wadsworth, Samuelsson, Petrill, Willcutt and Corley2010) study measured variability in student achievement accounted for by classroom-level variables by using identical and fraternal twins and a series of within-pair correlations of the twins’ scores on a variety of literacy assessments. They compared these correlations for twins in the same class and twins in separate classes in kindergarten, Grade 1 and Grade 2. For simplicity, consider identical twins: because they have the same genetic makeup, any differences in correlations between twins assigned to the same classroom as their co-twin and those twins assigned to different classrooms can be attributed in principle to differential influence of classroom factors, notwithstanding any systematic effects of either the same or separate class environments. The difference in correlation coefficients can in fact be interpreted as the size of the classroom-level effect (Byrne et al., Reference Byrne, Coventry, Olson, Samuelsson, Corley, Willcutt, Willcutt, Wadsworth and DeFries2009). For example, if r = .85 for same-class twins and r = .77 for separate-class twins, the classroom effect is estimated at .08. The same logic applies to fraternal twins: The difference in correlations between same- and separate-class twins directly reflects the classroom-level effect, even though correlations between fraternal twins are lower than those for identical twins for substantially heritable traits such as early literacy (Byrne et al., Reference Byrne, Coventry, Olson, Samuelsson, Corley, Willcutt, Willcutt, Wadsworth and DeFries2009).
This method employed by Byrne et al. (Reference Byrne, Coventry, Olson, Wadsworth, Samuelsson, Petrill, Willcutt and Corley2010) is relatively intuitive to understand and was selected for this reason. Grasby et al. (Reference Grasby, Little, Byrne, Coventry, Olson, Larsen and Samuelsson2020) extended this by using structural equation modeling, which ‘generates more precise values’ (p. 1162). Further, while Byrne et al. treated identical (monozygotic [MZ]) and fraternal (dizygotic [DZ]) twins independently of each other, Grasby et al.’s models incorporated both twin types. This allowed Grasby et al. to estimate the variance explained by classroom effects. Additionally, Grasby et al.’s models estimated the three other sources of variance typically studied with twins. Namely, (1) genetic influences (A); (2) common or shared environmental influences; (C), being effects impacting twin pairs equally such as the home or being in the same class; and (3) unique or nonshared environmental influences (E), being effects impacting twins individually such as one twin having a different teacher to the other.
Ultimately, the classroom effects in the Grasby et al. (Reference Grasby, Little, Byrne, Coventry, Olson, Larsen and Samuelsson2020) study explained 2−3% of the variance on average, depending on the grade and measure. Further, they simulated power and noted they were underpowered for these effect sizes.
Here, we model both MZ and DZ twins, like Grasby et al. (Reference Grasby, Little, Byrne, Coventry, Olson, Larsen and Samuelsson2020), but to the data of Byrne et al. (Reference Byrne, Coventry, Olson, Wadsworth, Samuelsson, Petrill, Willcutt and Corley2010). However, we use an alternate method to Grasby et al. and Byrne et al. by assessing whether student behavioral characteristics, in particular inattention and hyperactivity, interact with classroom-level factors. More precisely, we test the hypothesis that classroom-level effects are more substantial for students showing higher levels of inattention and hyperactivity using a multiple moderation model (Purcell, Reference Purcell2002).
We should be clear here on what we mean by classroom-level effects. Just for the purposes of illustration, consider teacher rather than broader-level classroom effects. Teacher effects represent the differential effectiveness of teachers. Teachers are instrumental in improving student performance year-on-year. But if teachers are equally instrumental, the teacher effect would be zero despite the substantial year-on-year gains. A teacher effect is only greater than zero to the extent that teachers differentially affect student outcomes.
Possible Interactions Between Student Behavior and Teaching Skill
In what follows we give the example of teachers, again for the purposes of illustration, but acknowledge that other factors, peers for instance, can likewise influence the classroom climate. The literature suggests student behavioral characteristics may interact with differential teacher skills. First, note that a large international study (Teaching and Learning International Survey [TALIS], 2009) comparing teaching practices among OECD countries found that Australian teachers on average spent 76% of lesson time on teaching and learning, 16% on keeping order in the classroom and dealing with disruptive student behavior, and the remaining 8% on administrative tasks (Freeman et al., Reference Freeman, O’Malley and Eveleigh2010). Although the majority of lesson time was spent on teaching and learning, globally it was actually the classroom disciplinary climate that was the most important predictor of student achievement, with better classroom-management maximizing teaching and learning (TALIS, 2009).
It may also be the case that teacher differences in classroom management skills may impact some students more than others. For example, following their study of teacher effects, Nye et al. (Reference Nye, Konstantopulos and Hedges2004) speculated:
Perhaps the teachers are not equally effective for all students, so that a teacher’s effectiveness depends on the kinds of students they teach. It is certainly plausible (and widely believed) that some teachers are more effective with some kinds of students than with others. In particular, it may require more knowledge or skill to promote achievement in low-SES students, while promoting achievement in high-SES students is relatively easy. If this is the case, there could be greater variability of teacher effects on low-SES students than on high-SES students. (p. 251)
The study did indeed find greater variability in teacher effectiveness for students low in socioeconomic status (SES) than high-SES students. Although Nye et al. (Reference Nye, Konstantopulos and Hedges2004) focused on SES, similar conclusions could be drawn for student behavior whereby variability in teacher effectiveness may be greater for children suffering from behavioral disturbances than for others. To explore this question, the current study extends Byrne et al. (Reference Byrne, Coventry, Olson, Wadsworth, Samuelsson, Petrill, Willcutt and Corley2010) to assess whether classroom-level effects, which include teacher quality, vary significantly with certain student behavioral characteristics, namely inattention and hyperactivity. Accordingly, the following section will discuss attention deficit hyperactivity disorder (ADHD) as a measure of student behavior and illustrate strategies in classroom behavior management that could plausibly contribute to differences among teachers and classrooms depending on student behavior.
ADHD Symptoms as a Measure of Student Behavior
ADHD is one of the most common childhood psychiatric disorders (Willcutt et al., Reference Willcutt, Pennington, Boada, Ogline, Tunick, Chhabildas and Olson2001) with an estimated prevalence of 3−7% among school-aged children (American Psychiatric Association, 2022). ADHD is diagnosed by a number of behavioral symptoms in the Diagnostic and Statistical Manual of Mental Disorders (DSM-5-TR; American Psychiatric Association, 2022) across two domains, inattention and hyperactivity-impulsivity. Although ADHD is a clinical diagnosis, ADHD symptoms can also be viewed as one extreme of a continuum in the population rather than a distinct category (Barkley, Reference Barkley1997; Willcutt et al., Reference Willcutt, Pennington and DeFries2000).
The disorder is characterized by behavioral symptoms including impaired response inhibition or poor impulse control, such as an inability to wait one’s turn while playing games; excessive task-irrelevant activity, such as wriggling feet and legs; and poor sustained attention and easy distractibility (Barkley & Murphy, Reference Barkley and Murphy2006). These symptoms are contrary to the behavior expected in a school environment, such as remaining seated during class time, taking turns, and sustaining attention in order to complete tasks (Anderson et al., Reference Anderson, Watt, Noble and Shanley2012; Kos et al., Reference Kos, Richdale and Hay2006). Not surprisingly, children with ADHD experience academic and educational challenges (Barry et al., Reference Barry, Lyman and Klinger2002).
Managing disruptive student behavior is one aspect of classroom management, and a teacher’s ability to manage this behavior may have significant impacts on student outcomes. Classroom management includes the structure and organization of the classroom; establishing, teaching and enforcing rules; smooth transitions between activities; and effective use of learning time (Gettinger & Kowler, Reference Gettinger, Kowler, Everton and Weinstein2006).
Teacher Differences in Managing Student Behavior
Teachers with a high level of expertise exhibit greater knowledge of classroom management practices, exercise greater skill in orchestrating routines and activities, and are more flexible in the way they respond to disruptive behaviors than novice teachers (Emmer & Stough, Reference Emmer and Stough2001). Vereb and DiPerna (Reference Vereb and DiPerna2004) found that teacher training sessions on ADHD increased teachers’ knowledge of characteristics and diagnostic criteria and that teachers vary in their knowledge about the features of ADHD depending on their teaching experience. They found, too, that some teachers accept treatments that are critical for successfully managing children’s behavior more readily than others. Furthermore, teachers’ negative stereotypical beliefs, negative affect (Anderson et al., Reference Anderson, Watt, Noble and Shanley2012), and greater levels of stress (Greene et al., Reference Greene, Beszterczey, Katzenstein, Park and Goring2002) when interacting with students who have ADHD may influence outcomes for disruptive students more than for well-behaved students. Finally, Wang et al. (Reference Wang, Bernas and Eberhard2004) studied the effect of teaching style on children with ADHD. The authors reported that students with ADHD were more responsive and focused and achieved greater success on a puzzle task when teachers used hand gestures with verbal instructions. This highlights that simple variation in lesson delivery impacts on student performance. For students with high levels of inattention and hyperactivity, having a teacher who uses hand gestures may make a significant difference to their academic achievement, whereas hand gestures may not make a significant difference for attentive students.
Reviews of school-based treatments of ADHD (Daly et al., Reference Daly, Creed, Xanthopoulos and Brown2007; Schultz et al., Reference Schultz, Storer, Watabe, Sadler and Evans2011; Sherman et al., Reference Sherman, Rasmussen and Baydala2008) identify a variety of classroom management practices aimed at modifying individual children’s behavior in order to reduce symptoms of ADHD and increase on-task behavior. Behavior modification techniques that utilize the principles of operant conditioning have been effective in shaping student behavior and reducing ADHD symptoms (Daly et al., Reference Daly, Creed, Xanthopoulos and Brown2007). One commonly employed strategy is the Daily Report Card that is sent home to parents who then reward their child for achieved goals. This strategy has been found to significantly reduce severity of symptoms (Owens et al., Reference Owens, Richerson, Beilstein, Crane, Murphy and Vancouver2005). Another common strategy is the use of tokens that can be redeemed for rewards to reinforce positive behavior and that impose costs for undesirable behavior. This strategy was found to significantly reduce symptoms (Daly, et al., Reference Daly, Creed, Xanthopoulos and Brown2007) and to increase reading performance (Robinson et al., Reference Robinson, Newby and Ganzell1981).
Computer-Assisted Instruction (CAI) is a multisensory, interactive, stimulating method of instruction providing immediate feedback (Daly et al., Reference Daly, Creed, Xanthopoulos and Brown2007; Schultz et al., Reference Schultz, Storer, Watabe, Sadler and Evans2011). These factors have been found to be important for improving the academic outcomes of children with ADHD (Barkley & Murphy, Reference Barkley and Murphy2006). Clarfield and Stoner (Reference Clarfield and Stoner2005) demonstrated improvements in oral reading fluency in kindergarten and Grade 1 students with ADHD engaged in CAI as compared to teacher-directed instruction. Furthermore, DuPaul et al. (Reference DuPaul, Ervin, Hook and McGoey1998) found that peer tutoring improved performance on mathematics and spelling test scores more so for children with ADHD than peer comparisons. Teacher differences in implementing these strategies may have more of an impact on academic outcomes for children with greater symptoms than for those with fewer symptoms since they appeal to the learning needs of inattentive and hyperactive students.
To summarize: the degree to which teachers employ interventions, and the effectiveness of the strategies, may impact on academic outcomes more for poorly behaved children than well-behaved children. For a usually well-behaved student, it may not matter which class the student is in for academic achievement. However, for an inattentive and/or hyperactive student, the class may be critical for academic achievement. That is, the effect of the teacher may vary with student behavior. The aim of the present study is to use largely the same data as the Byrne et al. (Reference Byrne, Coventry, Olson, Wadsworth, Samuelsson, Petrill, Willcutt and Corley2010) study to investigate whether the classroom effect varies depending on the behavior of the child. The hypothesis is that the classroom effect for literacy will be greater for twin pairs higher on ADHD symptoms that for those lower on these same symptoms.
Method
Participants
The total sample of 1516 participants comprised 758 twin pairs (352 MZ and 360 same-sex DZ) from Australia and the United States involved in the International Longitudinal Twin Study (ILTS; for details see Byrne et al., Reference Byrne, Coventry, Olson, Samuelsson, Corley, Willcutt, Willcutt, Wadsworth and DeFries2009; Olson et al., Reference Olson, Keenan, Byrne, Samuelsson, Coventry, Corley, Wadsworth, Willcutt, Defries, Pennington and Hulslander2011). The ILTS uses data collected only on children with English as their first language. As in Byrne et al. (Reference Byrne, Coventry, Olson, Wadsworth, Samuelsson, Petrill, Willcutt and Corley2010), this study used data from kindergarten, Grade 1 and Grade 2, although there was a 7% increase in data used as compared to Byrne et al. (Reference Byrne, Coventry, Olson, Wadsworth, Samuelsson, Petrill, Willcutt and Corley2010) due to more cohorts of students reaching the final assessment stage in this longitudinal study.
The Australian sample was recruited from New South Wales via the voluntary National Health and Medical Research Council’s Australian Twin Registry. Parents of twins were approached by mail, with a 62% participation rate. No payment was given to Australian parents for participation. The American sample was recruited via the Colorado Twin Registry birth records. Of the 60% of parents able to be contacted by mail or phone, 86% agreed to participate. Parents received a payment of $100 for their participation.
Due to the longitudinal nature of this study, the sample size declined in each grade. In addition, the response rate from parents returning the ADHD assessment was less than 100%. Listwise deletion (within each grade) was necessary for these analyses, since no moderators can have missing data (Purcell, Reference Purcell2002). Thus, from among the initial 1516 participants, the percentage of cases removed due to missing data on at least one variable was 21.04%, 26.58% and 38.32% for kindergarten, Grade 1 and Grade 2 respectively. The reduced sample sizes used in the analyses are reported in Table 1. These were down 17−19% on those used by Byrne et al. (Reference Byrne, Coventry, Olson, Wadsworth, Samuelsson, Petrill, Willcutt and Corley2010). Little’s MCAR (Missing Completely at Random) test was not significant, suggesting no systematic missingness.
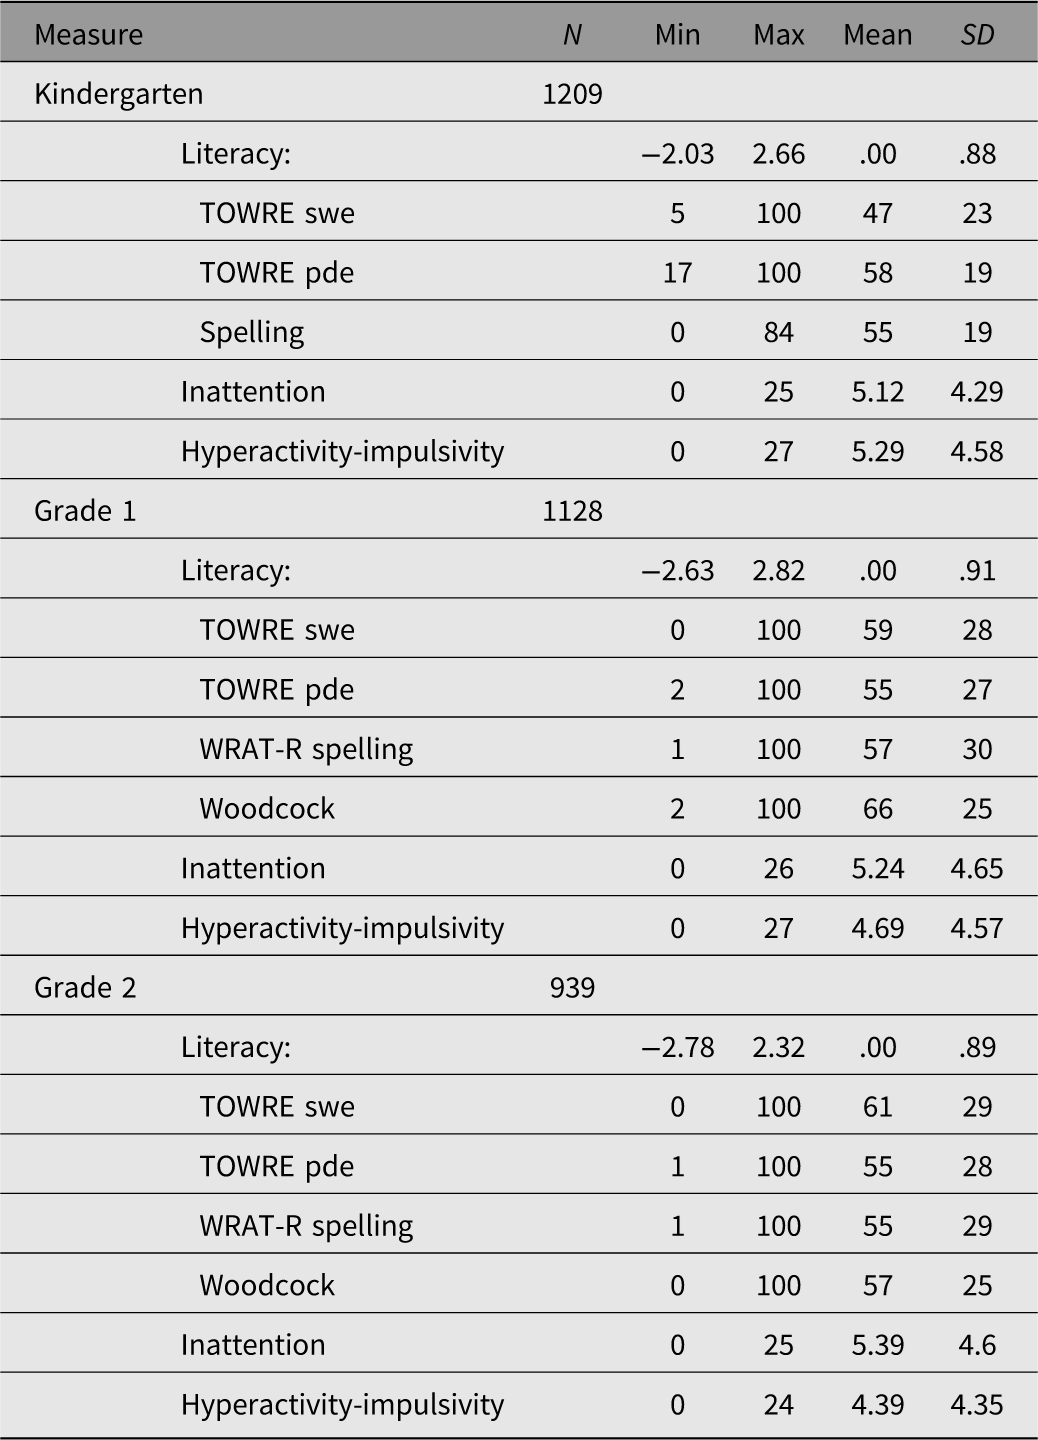
Descriptive statistics for the literacy composite and subsales of Attention deficit hyperactivity disorder (ADHD) symptoms, with the Ns representing the sample sizes used for the analyses at each grade (i.e., after listwise deletion by grade)

Table 1. Long description
The table presents descriptive statistics for literacy and ADHD symptoms across kindergarten, Grade 1, and Grade 2. It includes measures such as Literacy, TOWRE swe, TOWRE pde, Spelling, Inattention, and Hyperactivity-impulsivity. The table has 11 rows and 6 columns. The columns are labeled Measure, N, Min, Max, Mean, and SD. The rows are grouped by grade levels: Kindergarten, Grade 1, and Grade 2. Each grade level has specific measures with corresponding values for N, Min, Max, Mean, and SD. For example, in Kindergarten, the Literacy measure has an N of 1209, a Min of -2.03, a Max of 2.66, a Mean of .00, and an SD of .88. The table provides detailed statistics for each measure across the different grades.
Note: Raw scores are reported for inattention, hyperactivity-impulsivity, and spelling at just kindergarten. Percentiles were available so are reported for Wide Range Assessment Test-Revised (WRAT-R) spelling (grades 1 and 2), Test of Word Reading Efficiency (TOWRE) reading, and Woodcock reading comprehension. Standardized scores are reported for the literacy composite.
Materials and Procedure
In the ILTS, two separate testers assessed each twin simultaneously on the literacy variables of word reading, spelling and comprehension in a session lasting approximately one hour. Testing of children occurred over a 1- to 2-week period in a quiet room at school (in Australia) or in the home (in the United States). The assessments took place towards the end of kindergarten, Grade 1 and Grade 2 in Australia or over the summer break in the US.
At the commencement of the ILTS, parents completed a questionnaire of demographic information, including participants’ age, gender, ethnicity and zygosity (identical or fraternal twin status). Each year, parents provided information about whether the twins were in the same class or separate classes. ADHD symptoms were gathered via a parent questionnaire on each twin, administered at kindergarten, Grade 1 and Grade 2.
Same or different class
Twin pairs were coded as zero if they were in the same class, and 1 if they were in a different class, but this variable was then centered to combat multicollinearity. After centering, kindergarten same class was coded −.28 and separate classes was coded .72, being their standardized values. Likewise for Grade 1, centered same class was coded −.56 and separate classes was coded .44. For Grade 2, centered same class was coded -.64 and separate classes was coded .36.
Literacy composite
The literacy items, detailed below, were averaged to create a composite measure since principal components analyses suggested a single factor at each grade explained over 80% of variance (Byrne et al., Reference Byrne, Coventry, Olson, Wadsworth, Samuelsson, Petrill, Willcutt and Corley2010). Literacy was assessed at each of these three grades but differently depending on the grade. Namely, in kindergarten the literacy composite comprised reading and spelling, while in Grades 1 and 2 it also included reading comprehension, given the children were old enough by then to be assessed on reading comprehension.
Test of Word Reading Efficiency (TOWRE; Torgesen et al., Reference Torgesen, Wagner and Rashotte1999)
The TOWRE measured reading efficiency, and was administer in kindergarten, Grade 1, and Grade 2. It assessed the speed and accuracy of reading words, with two subtests. Sight Word Efficiency (SWE) measured the reading efficiency of familiar words from a list of 104 real words such as car and awkward. While Phonemic Decoding (PDE) measured the efficiency of pronouncing unfamiliar words from a list of 63 pseudowords (nonwords) such as wum and emulbatate. On both subtests, the children were scored on the number of words or nonwords read correctly in 45 seconds. The TOWRE is a widely used test with high levels of reliability (Torgesen, et al., Reference Torgesen, Wagner and Rashotte1999; correlations between two alternate forms ranged from .95 to .97 in the current sample) and validity (Knight & Galletly, Reference Knight and Galletly2006).
Spelling subtest from the Wide Range Assessment Test-Revised (WRAT-R; Jastak & Wilkinson, Reference Jastak and Wilkinson1984)
The WRAT-R was administered in Grades 1 and 2, but not kindergarten. It required children to spell up to 45 words ranging from simple words such as go to more complex words such as occurrence. The score was the total number of words spelled correctly, with scores ranging 0 to 45. In kindergarten, instead of the WRAT-R, a more age-appropriate spelling list with 10 real words and 4 nonwords was used, and phonological spelling was scored as correct (see Byrne et al., Reference Byrne, Coventry, Olson, Wadsworth, Samuelsson, Petrill, Willcutt and Corley2010).
Woodcock Passage Comprehension (Woodcock, Reference Woodcock1989)
Reading comprehension was assessed by that subtest of the Woodcock Reading Mastery Test–Revised, but only at Grades 1 and 2. It required children to silently read a short passage and orally provide a missing word denoted by an underlined space to assess their understanding of the text. The test manual reports high internal reliability (Cronbach’s alpha = .88).
The Disruptive Behaviour Rating Scale (DBRS; Barkley & Murphy, Reference Barkley and Murphy1998)
This measure comprised 18 items that correspond to the DSM-V-TR (American Psychiatric Association, 2022) items used to identify traits of ADHD. Parents rated participants’ behavior over the past 6 months on a 4-point Likert-type scale (0 = never/rarely, 1 = sometimes, 2 = often, 3 = very often). The measure comprises two subscales (DuPaul et al., Reference DuPaul, Ervin, Hook and McGoey1998), inattention (9 items; e.g., ‘Is easily distracted’), and hyperactivity-impulsivity (6 items for hyperactivity, e.g., ‘Fidgets with hands or feet or squirms in seat’ and 3 items for impulsivity, e.g., ‘Has difficulty waiting turn’). Composite measures of inattention and hyperactivity-impulsivity were created by summing the 9 raw scores on each respective subscale. Although in practice, clinicians assign a categorical diagnosis based on a set number of symptoms, this study used a continuous scale of DBRS ratings to increase statistical power and utilize the full range of scores, given the sample was of the general rather than clinical population.
This study used parent ratings rather than teacher ratings of ADHD symptoms so that the same person rated both twins for every grade to increase reliability. In the current sample, Cronbach’s alpha for inattention and hyperactivity-impulsivity across the three grades ranged from .85 to .88, indicating good internal reliability. Test−retest reliability for both subscales ranged from .64 to .73 across the three grades, indicating reasonably high stability, taking into account known systematic changes during childhood development (Ebejer at al., 2010). Lahey et al. (Reference Lahey, Pelham, Loney, Kipp, Ehrhardt, Lee, Willcutt, Hartung, Chronis and Massetti2004) report the DBRS to be a valid predictor of ADHD symptoms in young children and provide strong support for the predictive validity of ADHD symptoms and social and academic impairment in later years.
Analyses
We explain the analyses in three sections. We conceptually illustrate (1) how the classroom effects are modeled herein, then (2), whether these effects are moderated by behavior. Finally (3), we detail the models used. Given twin modeling can be of either the path coefficients or the variance components of A, C and E, in what follows all significance tests are of the path coefficients only. We only invoke mention of the variance components insofar as they help us (a) explain the expected effects, or (b) interpret the effects observed.
Classroom effect
In advance of considering the impact of behavior on the classroom effect, we first unpack just the latter. A classroom effect will be evident if there is a significant beta for the moderating effect of classroom assignment (same or different) on C and/or E. This would suggest different estimates of C or E for twins in same versus separate classes — and for the following reasons. As outlined earlier, for twins in the same class, shared environmental influences include a shared classroom and teacher as well as home and family. For twins in separate classes, shared environmental influences include home and family but not classroom or teacher. So, if shared environment influences are significantly greater for twins in the same class than for twins in separate classes, a classroom effect will be apparent from the significant coefficient of the moderator of same or different class on C. The impact of the teacher becomes part of nonshared environmental influences for twins in separate classes. Hence, where strategies employed by particular teachers do make a measurable difference to literacy outcomes, this will be apparent from a significant beta that shows greater nonshared environmental effects of literacy for the twins in separate classes than for twins in the same class, without having to measure the teachers or their strategies directly.
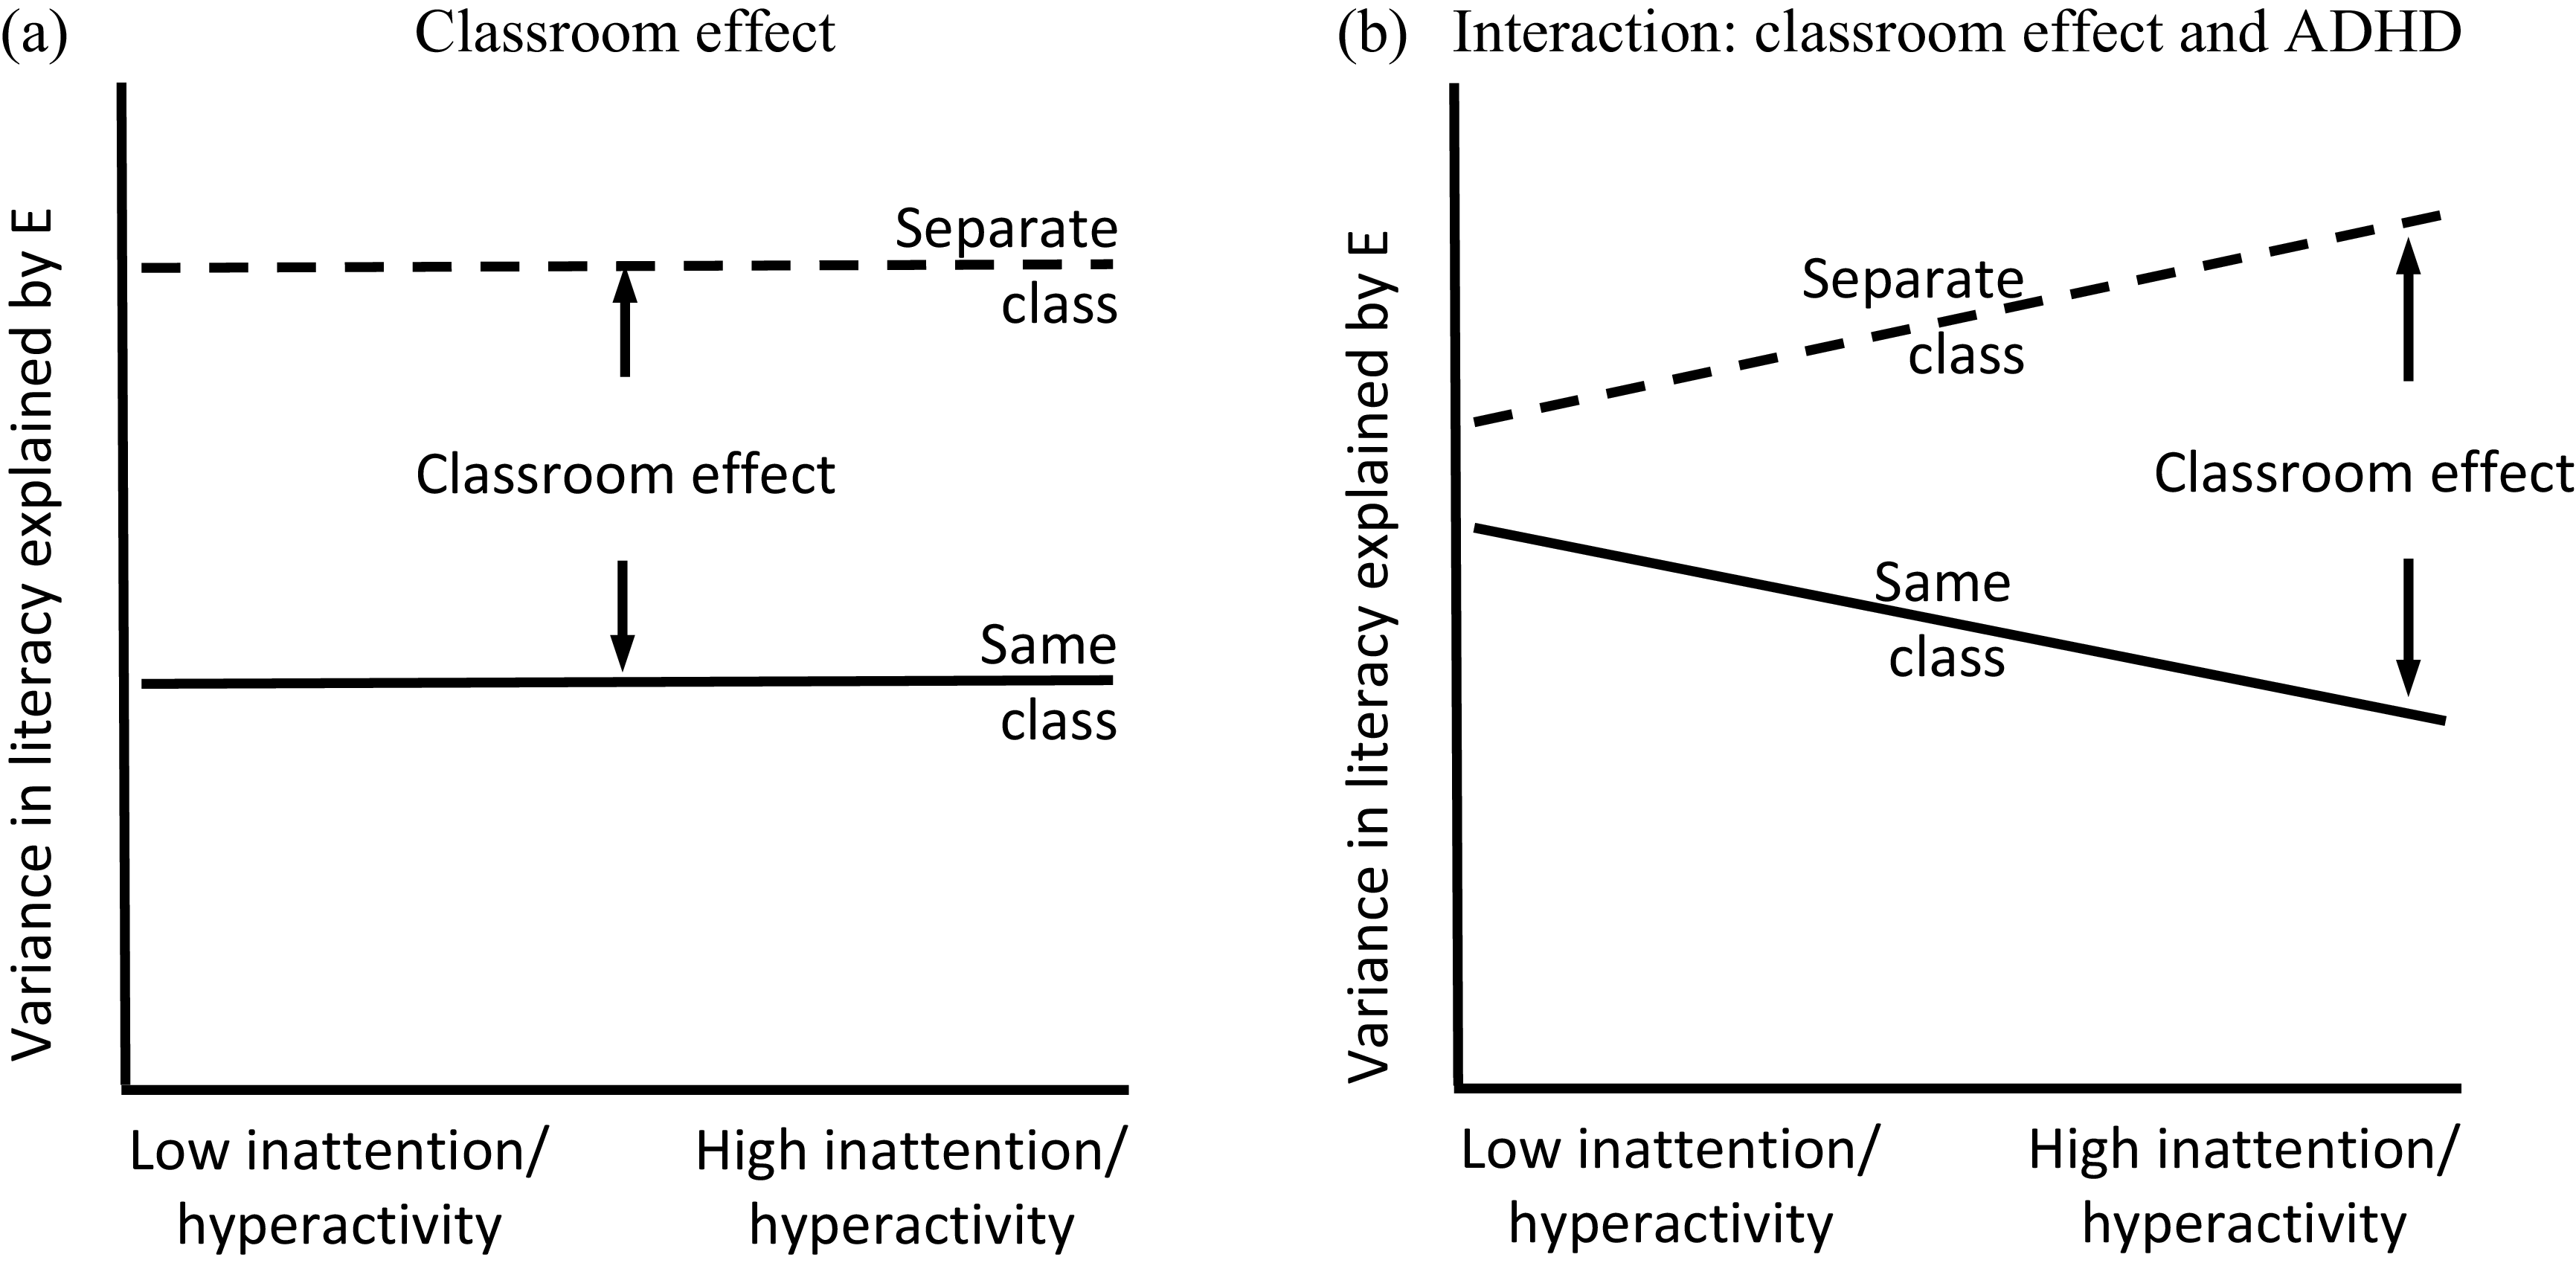
We conceptually graph this classroom effect, which can show in one of two ways: greater influence of C for twins in the same class compared to twins in separate classes, or greater influence of E for twins in separate classes compared to twins in the same class. For the purposes of illustration, panel (a) of Figure 1 depicts just the variance in E. Alternatively, if there were no effect of classroom, these dotted and solid lines would be combined.
An approximate graphic example of (a) a classroom effect, and (b) an interaction effect between classroom assignment and ADHD in predicting environmental influences on literacy using variance accounted for by E for illustration; had this been for C instead, the dotted and solid lines would be reversed in (a) and (b).

Moderation by behavior
We hypothesize behavior will moderate this classroom effect. The test of this will be whether the coefficient is significant for the interaction between classroom and behavior on either C or E. If the beta is significant and positive for C, this will indicate more shared environmental variance in shared classrooms when students have higher ADHD behaviors. Alternatively, if the beta for the interaction is sig and negative for E, then (given the coding of classroom) this would indicate less unique variance in shared classrooms when twins have higher ADHD scores. Panel (b) of Figure 1 illustrates the interaction effect, hypothesized herein, between classroom assignment and ADHD symptoms in predicting the unique environmental variance of literacy. Specifically, the classroom effect is hypothetically only for high, not low, ADHD symptoms.
In both panels (a) and (b), if the effects were observed for C rather than E, the two lines (i.e., dotted and solid) would be reversed. The A parameter is not expected to differ for twins in the same versus separate classes, since genetic influences on a trait should remain the same regardless of whether twins are together or separate. As illustrated, a greater classroom effect for students with behavior problems than for ‘normal’ peers would show up as higher E and lower C for those pairs in separate classes as compared with those who share a classroom.
Models used
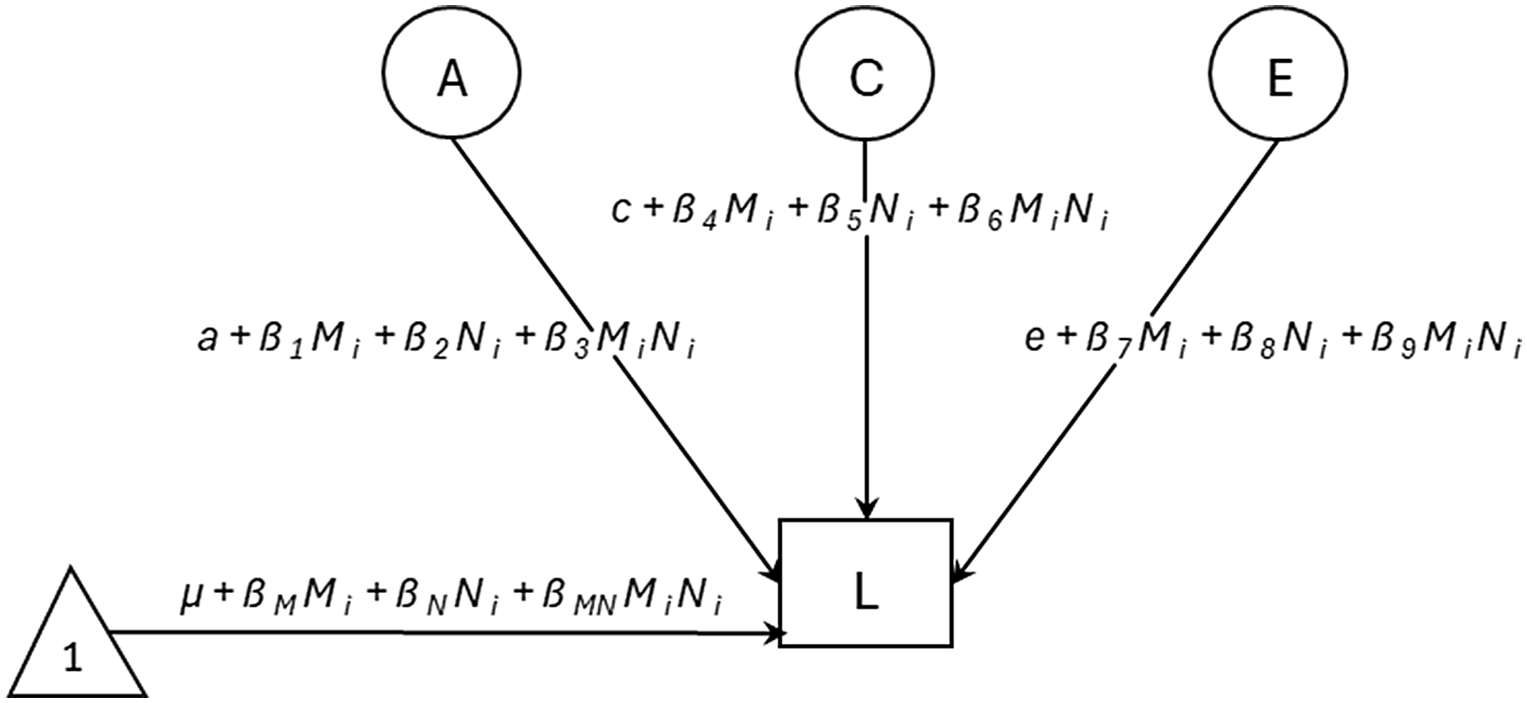
The analyses comprised six Purcell moderated regression models (inattention and hyperactivity-impulsivity at each of the three grades) using the Mx statistical package (Neale et al., Reference Neale, Boker, Xie and Maes2002). Figure 2 presents the model (Purcell, Reference Purcell2002), and the caption below the figure explains the means and variances portions of the model. Appendix A presents the Mx script used.
The Purcell moderated regression model used, shown here for just one twin for brevity. The means portion (path from mean to manifest variable) computes the expected mean of literacy (L), where M is the same/separate class moderator, N is the behaviour moderator, and MN is their interaction, i denotes all scores on each moderator variable, and ß represents the coefficient of each moderator. The regression models had literacy as the outcome variable, and the three moderators, classroom placement (same/separate class, M), behaviour (N), and the interaction between class and behaviour (MN) as the predictors. These predictors were modelled as unstandardized path coefficients. These models assessed whether the variance in A, C or E of literacy was moderated by either class, behaviour, or their interaction: so, nine coefficients (ß 1-9) per model in all. ß1 shows whether A differs by classroom, ß2 is whether A differs by behaviour, while ß3 is whether A is associated with the class x behaviour interaction. ß4-6 are respectively for classroom, behaviour and class x behaviour effects on C, while ß7-9 represent the same respectively for E.

This model, being saturated, was then refitted against a series of nested models where each of the nine parameters were set to zero to calculate the p values. These were computed as the difference between the -2 times log-likelihoods (and the associated degrees of freedom) of the saturated and nested models, which represents a chi squared statistic. These values are presented in Tables 2 and 3 for inattention and hyperactivity-impulsivity respectively and are reported lower down.
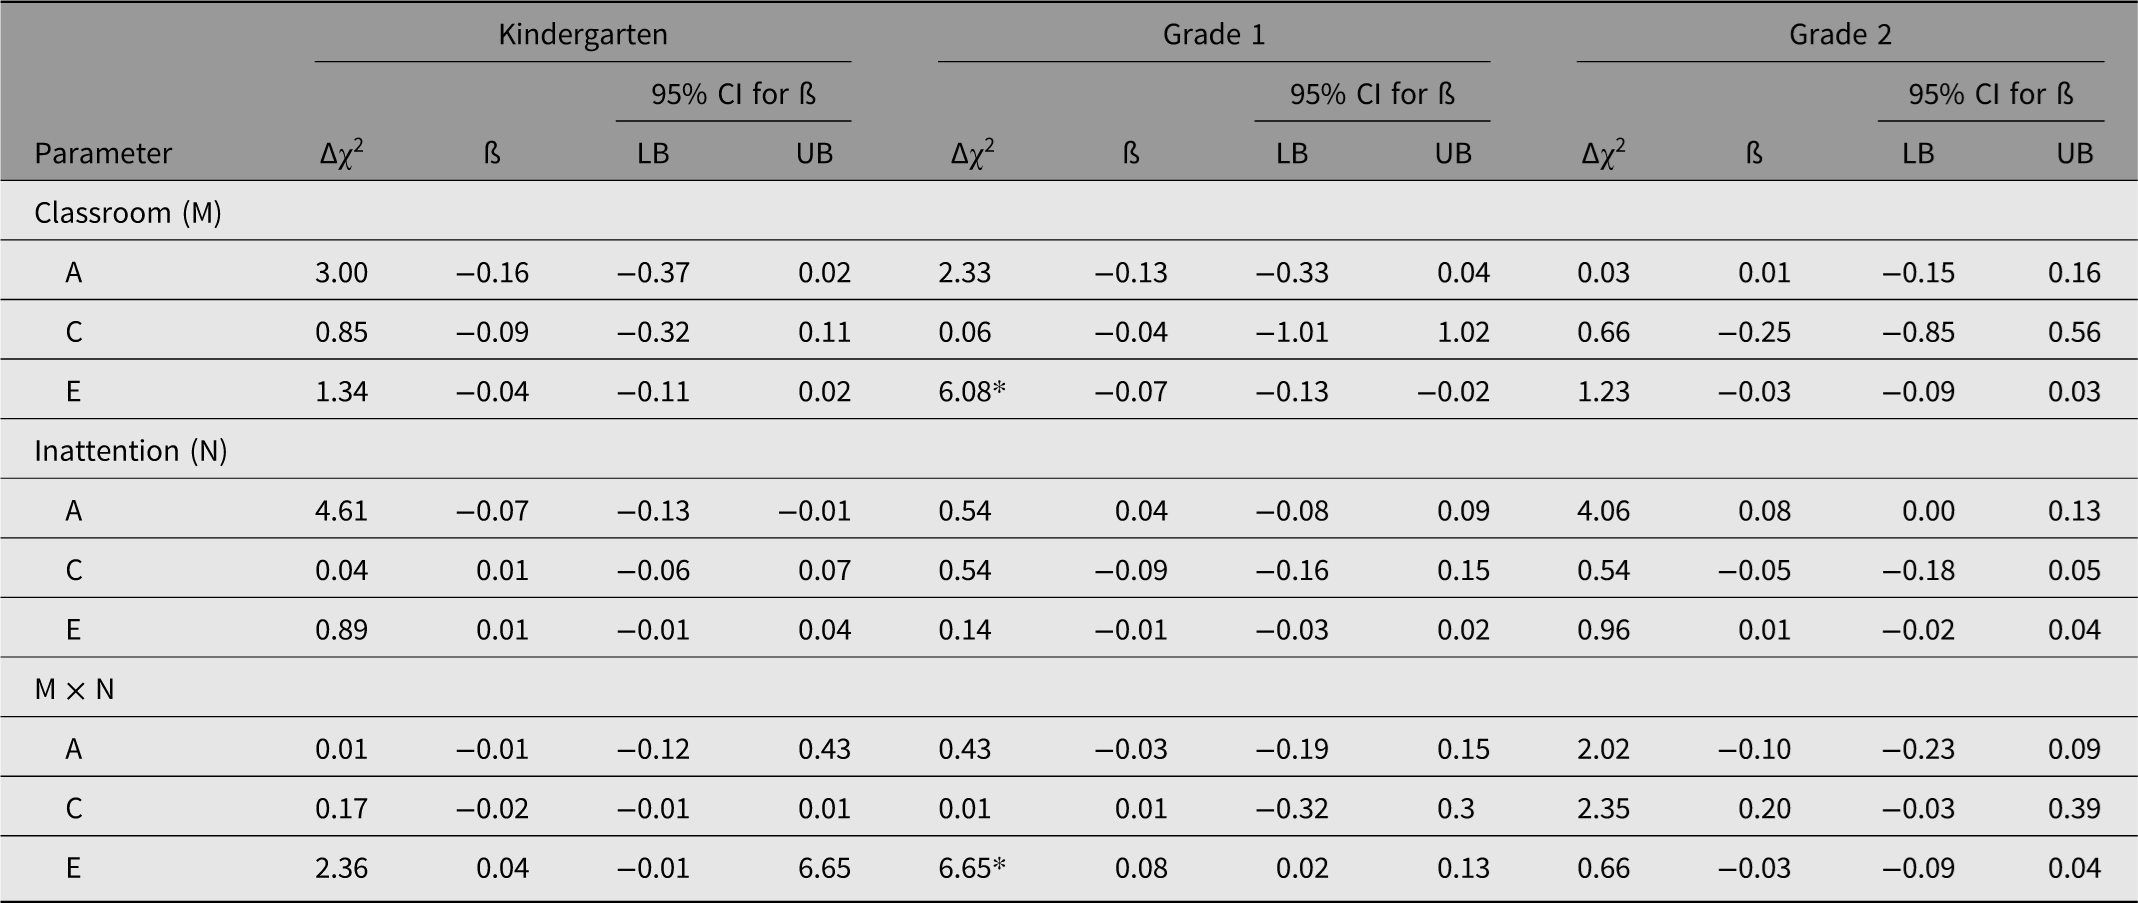
For inattention, the coefficients of Purcell moderated regressions showing whether the A, C or E estimates of literacy are moderated by either classroom (twin pairs in either same or different classes), inattention, or the interaction of classroom and inattention

Table 2. Long description
The table presents data on the coefficients (B) and chi-squared values (Δχ²) for various parameters across kindergarten, grade 1, and grade 2. The parameters are grouped into Classroom (M), Inattention (N), and the interaction of Classroom and Inattention (M x N). Each group includes three parameters labeled A, C, and E. The table includes columns for Δχ², B, and the 95% confidence interval (CI) for B, with lower bound (LB) and upper bound (UB) values. Row-wise data: Row 1: Classroom (M) - A, Δχ² 3.00, B -0.16, LB -0.37, UB 0.02. Row 2: Classroom (M) - C, Δχ² 0.85, B -0.09, LB -0.32, UB 0.11. Row 3: Classroom (M) - E, Δχ² 1.34, B -0.04, LB -0.11, UB 0.02. Row 4: Inattention (N) - A, Δχ² 4.61, B -0.07, LB -0.13, UB -0.01. Row 5: Inattention (N) - C, Δχ² 0.04, B 0.01, LB -0.06, UB 0.07. Row 6: Inattention (N) - E, Δχ² 0.89, B 0.01, LB -0.01, UB 0.04. Row 7: M x N - A, Δχ² 0.01, B -0.01, LB -0.12, UB 0.43. Row 8: M x N - C, Δχ² 0.17, B -0.02, LB -0.01, UB 0.01. Row 9: M x N - E, Δχ² 2.36, B 0.04, LB -0.01, UB 6.65. Notable trends include significant chi-squared values for certain parameters, such as Inattention (N) - A in kindergarten and Classroom (M) - E in grade 1.
Note: CI, confidence interval; LB, lower bound estimate; UB, upper bound estimate. A, genetic parameter; C = shared environment parameter;
E, nonshared environment parameter. All ∆ test statistics were computed for a one degree of freedom difference between models. *p < .012.
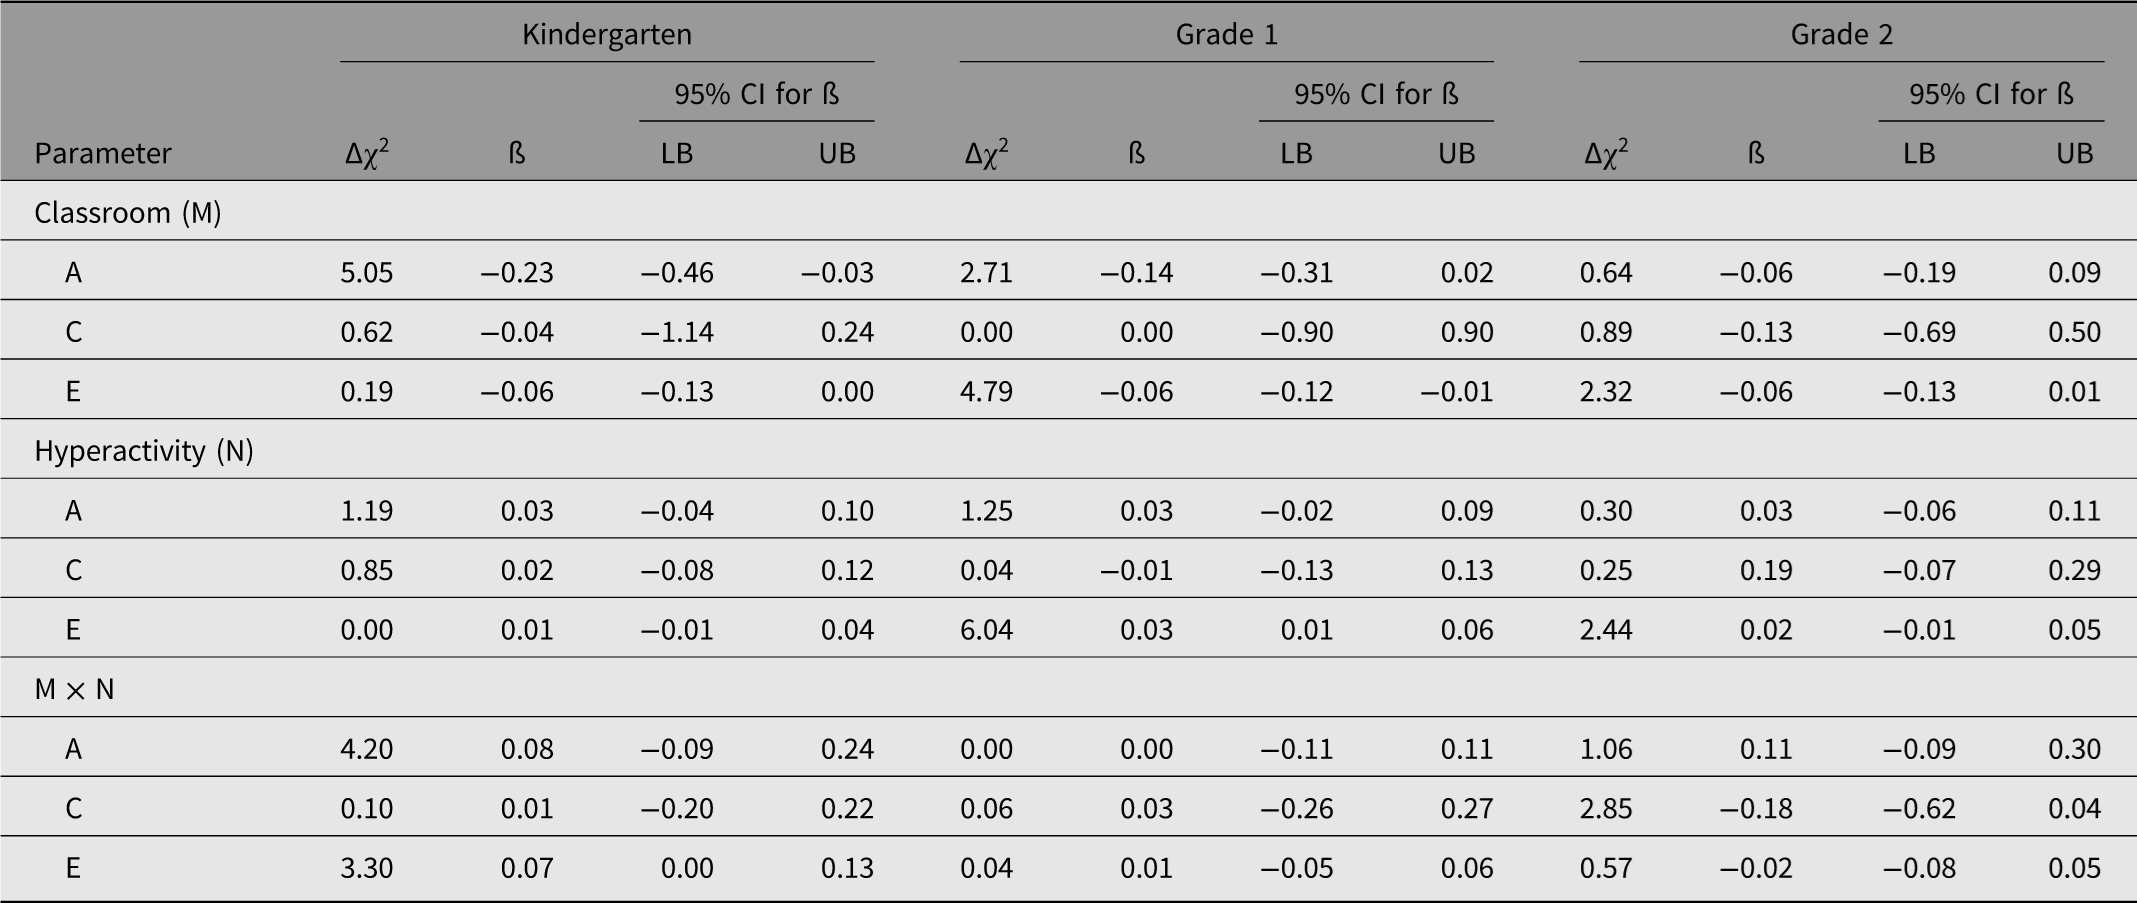
For hyperactivity, the coefficients of Purcell moderated regressions showing whether the A, C or E estimates of literacy are moderated by either classroom (twin pairs in either same or different classes), hyperactivity, or the interaction of classroom and hyperactivity

Table 3. Long description
A table comparing coefficients and chi-squared values for classroom and hyperactivity parameters across kindergarten, grade 1, and grade 2. The table has 12 rows and 11 columns. Column headers are Parameter, Δχ², β, 95% CI for β LB, 95% CI for β UB, Δχ², β, 95% CI for β LB, 95% CI for β UB, Δχ², β, 95% CI for β LB, and 95% CI for β UB. Row labels are Classroom (M) A, Classroom (M) C, Classroom (M) E, Hyperactivity (N) A, Hyperactivity (N) C, Hyperactivity (N) E, M x N A, M x N C, and M x N E. Row 1: Classroom (M) A, 5.05, -0.23, -0.46, -0.03, 2.71, -0.14, -0.31, 0.02, 0.64, -0.06, -0.19, 0.09. Row 2: Classroom (M) C, 0.62, -0.04, -1.14, 0.24, 0.00, 0.00, -0.90, 0.90, 0.89, -0.13, -0.69, 0.50. Row 3: Classroom (M) E, 0.19, -0.06, -0.13, 0.00, 4.79, -0.06, -0.12, -0.01, 2.32, -0.06, -0.13, 0.01. Row 4: Hyperactivity (N) A, 1.19, 0.03, -0.04, 0.10, 1.25, 0.03, -0.02, 0.09, 0.30, 0.03, -0.06, 0.11. Row 5: Hyperactivity (N) C, 0.85, 0.02, -0.08, 0.12, 0.04, -0.01, -0.13, 0.13, 0.25, 0.19, -0.07, 0.29. Row 6: Hyperactivity (N) E, 0.00, 0.01, -0.01, 0.04, 6.04, 0.03, 0.01, 0.06, 2.44, 0.02, -0.01, 0.05. Row 7: M x N A, 4.20, 0.08, -0.09, 0.24, 0.00, 0.00, -0.11, 0.11, 1.06, 0.11, -0.09, 0.30. Row 8: M x N C, 0.10, 0.01, -0.20, 0.22, 0.06, 0.03, -0.26, 0.27, 2.85, -0.18, -0.62, 0.04. Row 9: M x N E, 3.30, 0.07, 0.00, 0.13, 0.04, 0.01, -0.05, 0.06, 0.57, -0.02, -0.08, 0.05.
Note: CI, confidence interval; LB, lower bound estimate; UB, upper bound estimate. A, genetic parameter; C, shared environment parameter;
E, nonshared environment parameter. All ∆ test statistics were computed with one degree of freedom.
A correction for multiple testing was required since inattention and hyperactivity were treated as two distinct variables measured at three time points, creating six tests of significance. In so doing, we calculate the degree to which these variables represent completely distinct variables using factor analysis as outlined by Nyholt (Reference Nyholt2004) to estimate the effective number of independent variables (Veff). The Veff was 4.25, suggesting inattention and hyperactivity-impulsivity across the three time points represent 4.25 completely independent variables rather than 6 as would be the case with a Bonferroni correction. So, for α = .05, p < .012 (.05/4.25) indicated significance.
Results
Descriptive Statistics
Table 1 presents the means, standard deviations, and sample sizes of the literacy and behavior variables used in the analyses. For inattention and hyperactivity, the range is from 0 to 24−27 but the means are notable at around 5, being in the lowest quarter of scores. This indicates a positive skew in these distributions.
Twins were generally together in the same class in kindergarten and then separated in Grade 1 or Grade 2, with some variation to this pattern. As such, the final sample size for twins in the same class decreased from 856 in kindergarten to 490 in Grade 1 and 332 in Grade 2, and the sample size for twins in separate classes increased from 341 in kindergarten to 623 in Grade 1 and dropped slightly to 603 in Grade 2.
Data Preparation
Variables were prepared using SPSS. Predictors and moderators were centered prior to computing the interaction term to combat multicollinearity. Analyses revealed residuals that were nonnormal and heteroscedastic for some models. We resolved this by transforming the variables as follows: log for the TOWRE at kindergarten, reverse-log for spelling at kindergarten, reverse-log for inattention at all grades, and reciprocal for hyperactivity-impulsivity at all grades.
Following standard practice for twin studies (McGue & Bouchard, Reference McGue and Bouchard1984), all variables were adjusted for effects of age and gender, otherwise these effects can bias the estimates of genetic and environmental influence. The variables were then standardized within country to reduce nonindependence due to clustering by country. Finally, the variables were truncated to + or – 3 standard deviations by converting extreme scores to −3 or 3 (see Byrne et al., Reference Byrne, Coventry, Olson, Wadsworth, Samuelsson, Petrill, Willcutt and Corley2010; Samuelsson et al., Reference Samuelsson, Byrne, Olson, Hulslander, Wadsworth, Corley, Willcutt and DeFries2008).
Main Analyses
The results of the six structural equation models (inattention and hyperactivity-impulsivity at each of the three grades) are presented in Tables 2 and 3 for inattention and hyperactivity-impulsivity respectively. For each model, the 95% confidence intervals are reported for the moderating effects of class, behavior, and their interaction on each of A, C and E, so 9 parameters in each of the 6 models, 54 in all. While 8 of 54 parameters had significant confidence intervals, after correcting for multiple testing only 2 remained significant, and these are marked with an * in Table 2 and are reported below.
Do classroom effects moderate the A, C and E estimates of literacy?
Consistent with the hypotheses, the Purcell regression results indicate the E variance of literacy is significantly moderated by classroom, χ2 (1, N = 1088) = 6.08, p < .012, but only at (a) Grade 1 and (b) in the model including inattention. This result indicates a significant difference between the nonshared environmental influences on literacy for twins in the same class as compared to twins in separate classes. As evidenced by ACE modeling, detailed below, the effect is in the expected direction such that E is higher for twins in separate classes than in the same class, which is interpreted as a classroom effect. This is comparable to the example in Figure 1 (b). This classroom effect size explained 5% of the variability in literacy scores. This was calculated by running ACE models on Grade 1 literacy separately for same and separate classes, and (a) equating A across the same and separate classes and (b) comparing the trade-off between C and E for same and separate classes. As a benchmark, the A, C and E estimates when same and separate classes were combined for Grade 1 literacy were 81.00%, 5.39% and 14.24% respectively. For same class pairs, these estimates were 81.00%, 8.76% and 11.24%, and for separate classes they were 81.00%, 2.89% and 16.62%. The 5% effect size on E reported above was computed as 16.62−11.24.
This finding aligns with other findings in two respects. First, the same coefficient in the model that included hyperactivity, rather than inattention, was not significant but was similar in size, at −.06, to the above-reported significant classroom result for inattention, at −.07. This was expected given the classroom coefficients in question here differ only to the extent variance has been removed by (a) the differing subscales of behavior (i.e., inattention or hyperactivity) and (b) the interactions of these differing subscales with classroom. This suggests the models have behaved as they should.
Second, the findings align in part with that observed by Byrne et al. (Reference Byrne, Coventry, Olson, Wadsworth, Samuelsson, Petrill, Willcutt and Corley2010) when using the same sample. The key difference, aside from the design, was the current paper analyzed the literacy composite, while Byrne et al. analyzed the subscales of literacy in addition to the literacy composite. While the latter was not significant at Grade 1, Byrne et al. found the spelling item from Grade 1 was, while reading and comprehension were not. Hence, it is plausible the current study’s finding at Grade 1 are driven by spelling more so than reading or comprehension, and we view this as a valuable avenue for future research.
Does behavior moderate the A, C and E estimates of literacy?
Analyses showed behavior failed to significantly moderate literacy’s variance due to A, C or E. This result indicates that genetic and environmental influences on literacy are essentially constant for all levels of student behavior.
Behavior as a moderator of the classroom effect on literacy
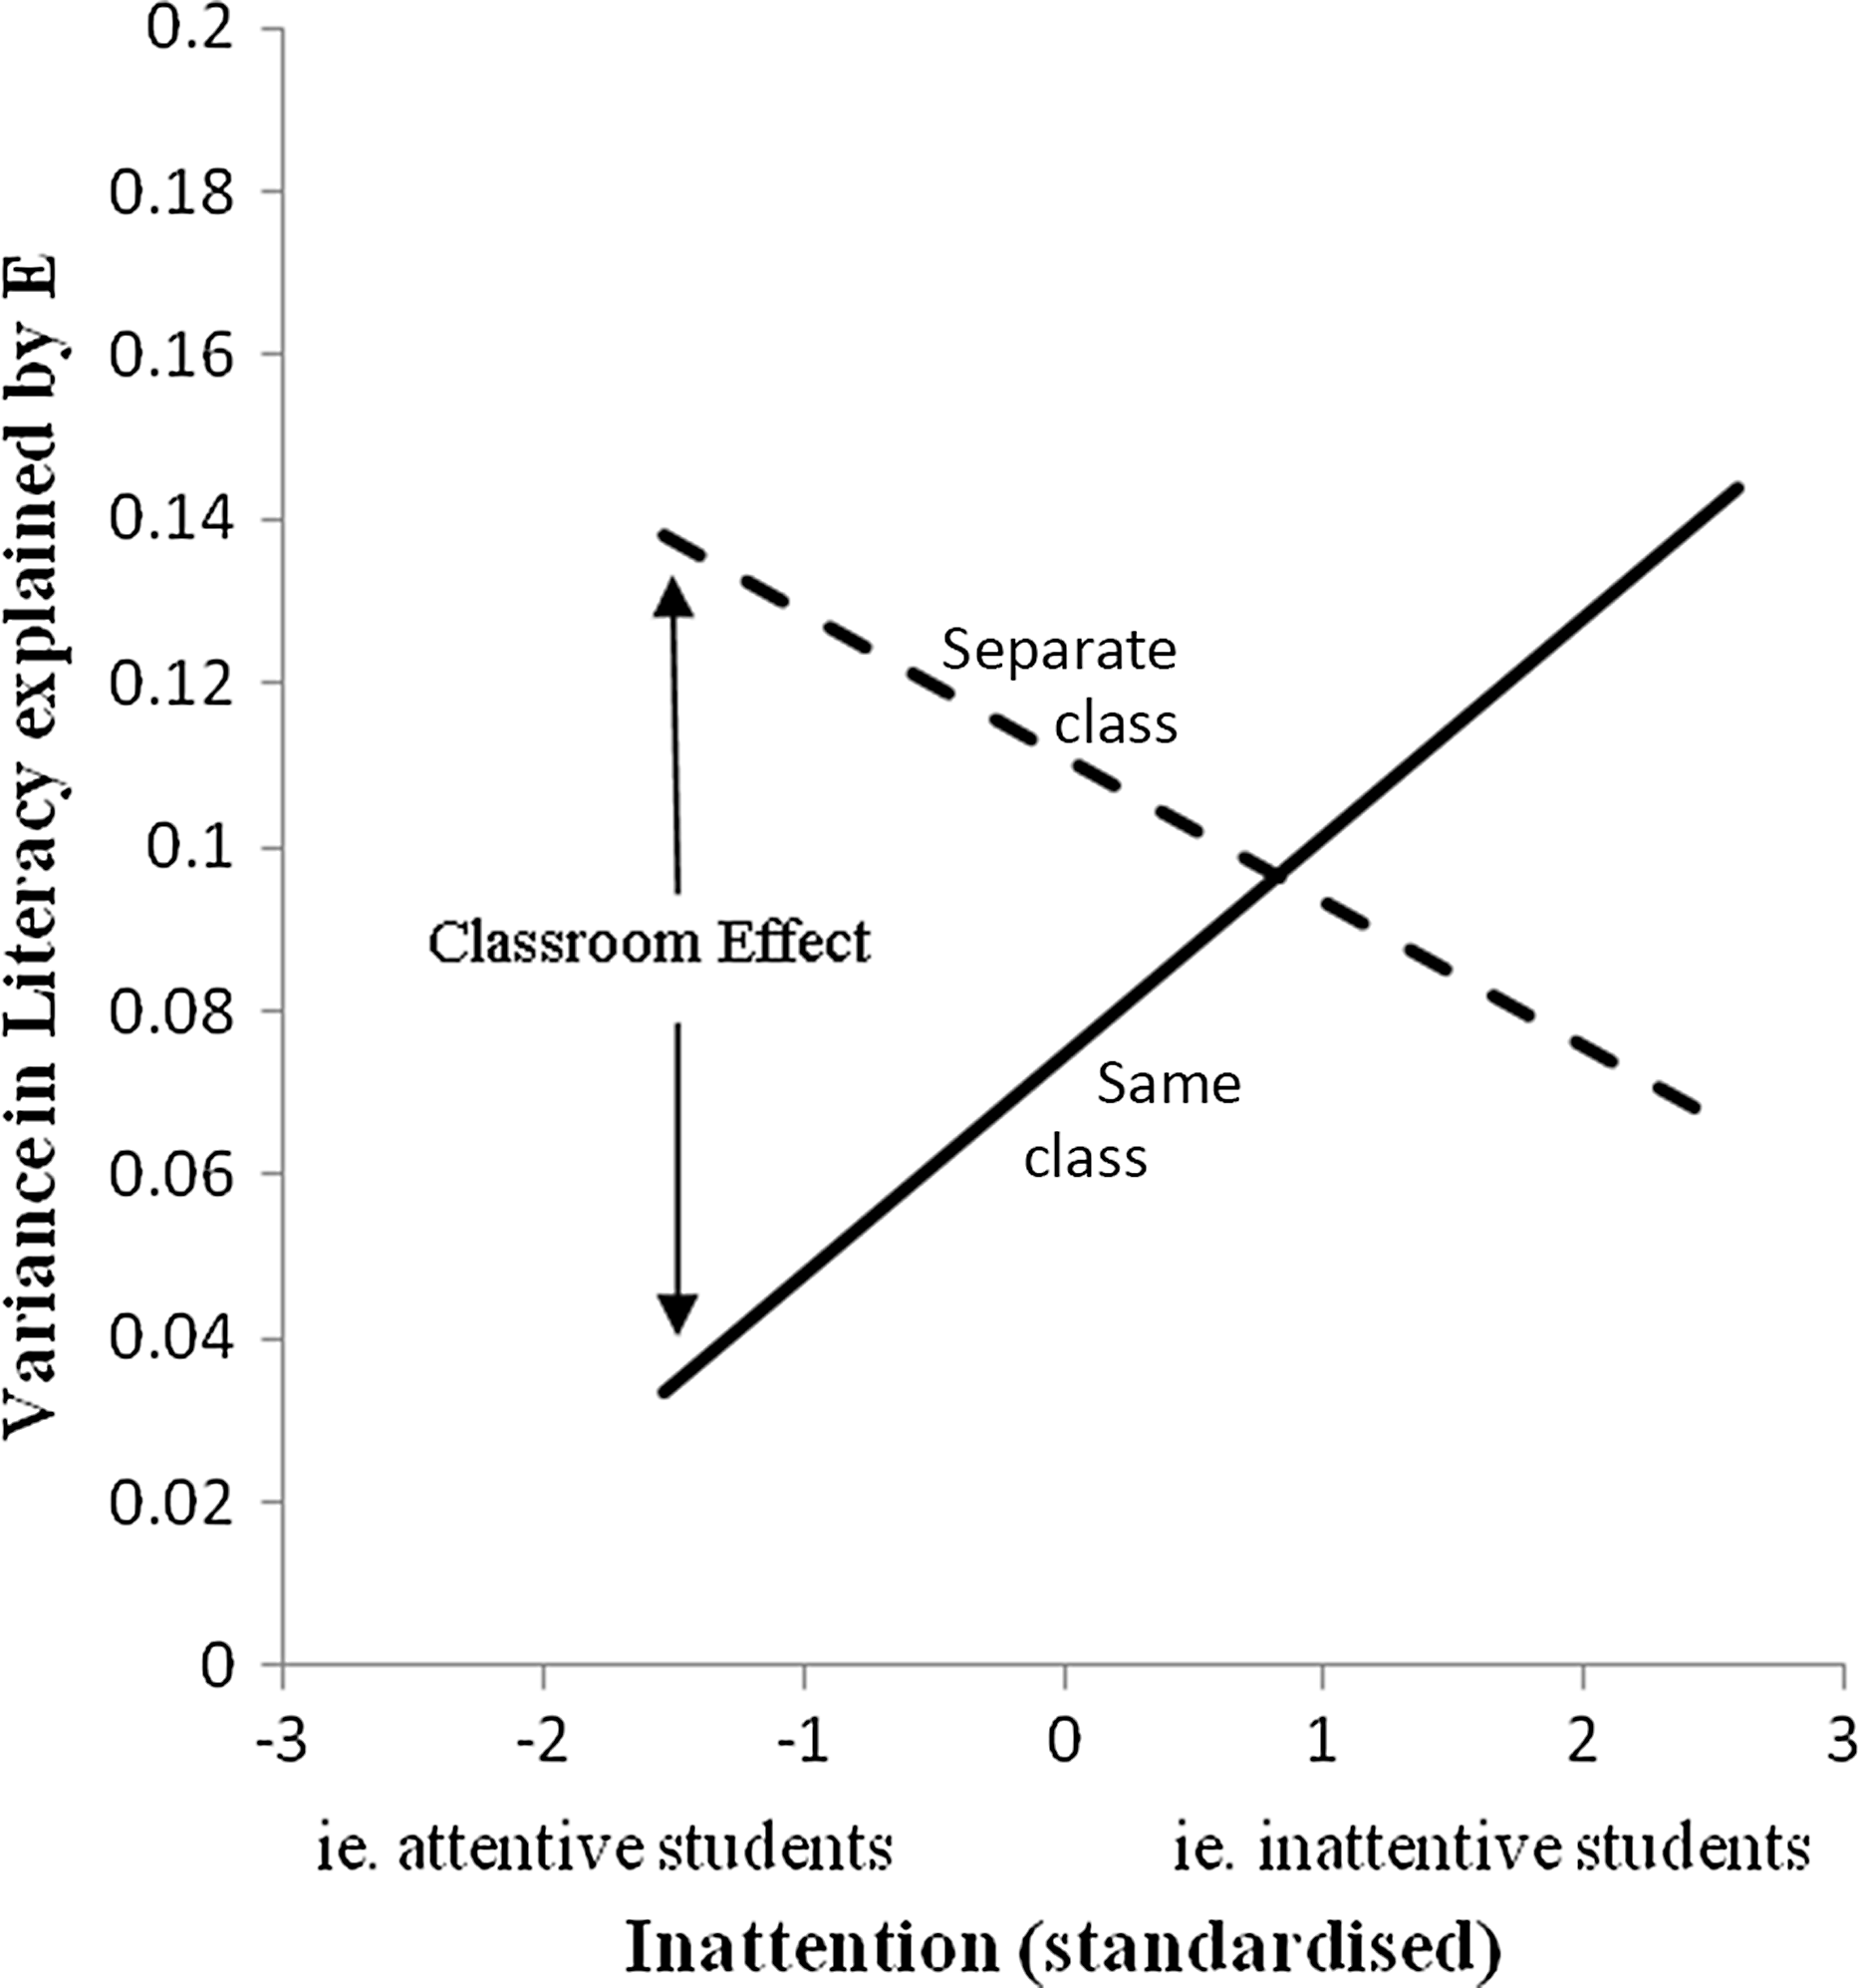
No significant interactions in the predicted directions were found for hyperactivity-impulsivity or for inattention at any grade. The one ‘significant’ interaction result was for inattention and class placement at Grade 1 (χ2 [1, N = 1088] = 6.65, p < .012), with less variance explained by E for inattentive students compared with attentive ones. It thus shows a classroom effect for attentive students, but the reverse for inattentive students. This result is, of course, in the direction opposite to that predicted, see Figure 3, and therefore clearly does not support the hypothesis motivating the study.
The interaction of the significant classroom effect and inattention for nonshared environmental (E) influences on literacy in Grade 1.

Discussion
We studied classroom-level effects on child achievement in early literacy and whether these effects varied in their impact for children high and low in inattention and hyperactivity. Previous research has indicated there are a range of techniques teachers can use to assist students with behavior difficulties. In the context of this twin study, if there is variability in teacher use of these techniques it should show up as an interaction between classroom assignment for twin pairs (same or different classes) and the variance explained by unique environment (E) in behavior-genetic analyses, with E accounting for higher variance for twins in separate classrooms. The results failed to support these predictions. While small and typically nonsignificant classroom effects were expected based on the same observed elsewhere (Byrne et al., Reference Byrne, Coventry, Olson, Wadsworth, Samuelsson, Petrill, Willcutt and Corley2010; Grasby et al., Reference Grasby, Little, Byrne, Coventry, Olson, Larsen and Samuelsson2020), the current study confirms these typically null findings also occur for classroom effects moderated by behavior.
Samuelsson et al. (Reference Samuelsson, Byrne, Olson, Hulslander, Wadsworth, Corley, Willcutt and DeFries2008) compared the genetic and environmental influences on literacy achievement in a sample of twins from the United States, Australia and Scandinavia (Norway and Sweden in this case). The study found that for students in kindergarten who received structured and intense reading instruction (as occurs in Australia and the United States), genetic influences explained a high proportion of individual differences in reading ability. In contrast, for Scandinavian children, who were not exposed to intense literacy instruction in kindergarten, individual differences were due to variation in the emphasis on literacy at home and school (i.e., environmental influences). One year later, when all children had received at least a year of intense literacy instruction, the estimates of genetic contribution to individual differences were similar across the three samples. Thus, when reading instruction is emphasized, it reduces the differences in teaching environments and consequently individual differences in reading are more influenced by genetic endowment (Samuelsson et al., Reference Samuelsson, Byrne, Olson, Hulslander, Wadsworth, Corley, Willcutt and DeFries2008). Furthermore, differences between students in their reading ability are more influenced by genetics when curricula are intense and consistent between classrooms, such as in a state or national curriculum (Samuelsson et al., Reference Samuelsson, Olson, Wadsworth, Corley, DeFries, Willcutt, Hulslander and Byrne2006). In the current study, any differences that do exist — in teacher skill in managing student hyperactivity and inattention — do not spill over to differences in students’ literacy achievement in the context of US (Colorado) and Australian (New South Wales) classroom practices.
As stated, the available research into management of children with high levels of inattention and hyperactivity indicates that certain practices can be helpful. For instance, the use of hand gestures (Wang et al., Reference Wang, Bernas and Eberhard2004), various behavior-modification techniques (Owens et al., Reference Owens, Richerson, Beilstein, Crane, Murphy and Vancouver2005; Robinson et al., Reference Robinson, Newby and Ganzell1981), CAI (Clarfield & Stoner, Reference Clarfield and Stoner2005) and peer tutoring (DuPaul et al., Reference DuPaul, Ervin, Hook and McGoey1998) improve academic performance of inattentive children. However, for these practices to emerge as influences on student variability they would need to be part of the practices of some teachers but not of others. It is plausible that in the teacher samples in this study there was not sufficient variability in teachers adopting these and other efficacious techniques to affect achievement variability. If this were the case, an implication would be that the current results do not necessarily contradict the findings from the research concerning the efficacy of these ways of managing behavior issues in the classroom.
On the other hand, it may be that these techniques are simply too limited in their efficacy to overcome the influences of genes and other environmental factors, including classroom-based ones such as classroom climate (Byrne et al., Reference Byrne, Coventry, Olson, Wadsworth, Samuelsson, Petrill, Willcutt and Corley2010; Marsh et al., Reference Marsh, Martin and Cheng2008). That would be a less encouraging implication of the current pattern of results. But in the absence of any data on actual classroom practices of teachers in our samples we are unable to decide whether the ‘insufficient variability’ or ‘limited efficacy’ explanation is the more plausible. A study that combined classroom assignment of twins with in-class observations of teacher practices would contribute in a valuable way in addressing this question.
Limitations of the Present Study and Future Directions
This project suffers from the limitations that apply to all studies using the DBRS as the single measure of behavior difficulties. For example, Simonoff et al. (Reference Simonoff, Pickles, Hervas, Silberg, Rutter and Eaves1998) report contrast effects in mother’s ratings of hyperactivity whereby higher ratings of hyperactivity for one twin correspond to lower ratings for the other twin. If present, a contrast effect may have impacted the accuracy of parental ratings in this study. In addition, critiques of measures of ADHD behavior identify the subjective nature of rating scales that lack a metric scale for the magnitude or intensity of behaviors such as fidgeting (Reid & Maag, Reference Reid and Maag1994). Beyond this, the current sample comprised normal-range variance on the DBRS, but a sample with a higher prevalence of ADHD would have better suited the research question. A further limitation is that the association between the very same literacy and behavior variables studied here is in part due genetic effects that are shared (Ebejer et al., Reference Ebejer, Coventry, Byrne, Willcutt, Olson, Corley and Samuelsson2010), which ultimately serves to reduce the power of the effects reported.
Beyond this, two potential limitations of our chosen design could be accommodated in future research. We devote a paragraph to each. First, A could be equated across same and different classes in the Purcell moderated regressions, given the coefficients showed same and different class moderated A, and significantly so in one of the six models (kindergarten with hyperactivity, where A shows up as higher in same than different classes based on: a + ß1Mi, which computes, when using the values and coding of Table 3, to be a + (−.23*−.28), so a + .064, for same class, and a + (−.23*.72), so a − .17, for different classes). So, while we suggest A can be equated across same and different classes when testing classroom effects, whether it should be is open to question. On the one hand, if we assume there was no reason for class moderating A, then it could be classed as noise, and equating A across same or different class would be appropriate and would ensure it did not bias the coefficients of the classroom effect or the classroom interaction with behavior. On the other hand, the moderating effect of classroom on A may not be noise, and if so, should be included in the model and not equated away. In support of this view, two speculative explanations for larger A in same than different classes at kindergarten are as follows. First, while it is convenient to pretend assignment to either same or different classes is random and dictated by forces outside of the family, such as the school, it is unlikely this is the case in all instances. Some families would have had the choice to have their twins in a same or separate class, and from within this group different genes may have led some families to separate their twins, and other families to keep them together, resulting in higher A for literacy in same-class twins. Second, in only those choosing to keep their twins together, there may be more of a A × C interaction, which mimics A in ACE models (Purcell, Reference Purcell2002), which would increase A in the same class group. It is not unreasonable to invoke C here, as the moderating effect of classroom on A are greatest in kindergarten, dissipate over time, and are negligible by grade 2. Given C, likewise, is largest at kindergarten and minimized by Grade 2 (Byrne et al., Reference Byrne, Coventry, Olson, Samuelsson, Corley, Willcutt, Willcutt, Wadsworth and DeFries2009) it is plausible C plays a role. To sum all this up, a greater effect of A in same than different classes could be real, but if it is pure noise, A could be equated across the same or different classes for more unbiased estimates of the classroom effect.
Second, future research could use the model of Grasby et al. (Reference Grasby, Little, Byrne, Coventry, Olson, Larsen and Samuelsson2020), which estimated the classroom effect as a separate source of variance, but then Purcell-moderate just this classroom variance by behavior. By contrast, the current design effectively spread the test of an interaction between classroom effects and behavior across two separate parameters, namely the coefficients of both C and E from the interaction between class and behavior. Holding A constant would have rendered these tests less disparate. However, with A varying, there was more potentially for (a) C and E coefficients to behave differently, and (b) for this to either magnify or attenuate the hypothesized effect. This matter of A varying aside, merely by testing C and E separately we perhaps gave ourselves more opportunity to find an effect should one have been present. That the hypothesized effect was not present tempers the concern over this feature of our design.
An important limitation, already mentioned, is the lack of measures of teachers’ behavior management strategies. With 758 twin pairs spread over many classrooms (e.g., 969 for the kindergarten sample), that would have been an unmanageable task. But future research could go some way to filling this information gap. For example, if researchers locate MZ pairs who are (a) in separate classrooms, (b) high on inattention and/or hyperactivity, and (c) highly discordant for literacy achievement, then interviews with or observations of their teachers could focus directly on management strategies as one of the environmental factors that may contribute to the discordancy. By exploiting the advantages offered by twin studies, in particular the ability to control for individual differences in genetic potential, researchers may be able to make efficient progress in untangling the various threads that make up the fabric of classroom and child-level factors that affect academic achievement.
Conclusion
This is the first twin study to explore the relationship between children’s behavior and a classroom effect on literacy. This study extended beyond Byrne et al. (Reference Byrne, Coventry, Olson, Wadsworth, Samuelsson, Petrill, Willcutt and Corley2010) and Grasby et al. (Reference Grasby, Little, Byrne, Coventry, Olson, Larsen and Samuelsson2020) by investigating whether the impact of teachers varied depending on child behavior. Teachers’ influence on variance in literacy was determined by comparing shared and nonshared environmental influences between twins who shared and did not share a teacher.
The study found no significant interaction between classroom assignment (and therefore potential teacher impact) and levels of inattention and hyperactivity on variation in literacy achievement. Thus, the teaching environment in these samples appeared to be relatively uniform, with variation in achievement between students due to other environmental factors plus, of course, genetic endowment. None of the findings show that management strategies for children burdened with inattention and hyperactivity are ineffective, but if they are effective, they were not subject to enough variation in this sample to emerge as influences in their own right.
Supplementary material
To view supplementary material for this article, please visit https://doi.org/10.1017/thg.2026.10097.
Acknowledgments
The research was supported by the University of New England’s strategic initiative fund, the Australian Research Council (DP0663498 and DP0770805), the National Institute for Child Health and Human Development (HD27802 and HD38526), the Research Council of Norway (154715/330), the Swedish Research Council (345-2002-3701), and Stavanger University. We are grateful for support from the Australian Twin Registry and the Australian Multiple Birth Association. We also thank our testers: in Australia, Frances Attard, Nicole Church, Marreta Coleman, Cara Newman; in Norway, Bjarte Furnes; in Sweden, Inger Fridolfsson, and Christina Wiklund; in the USA, Kim Corley, Rachael Cole, Barb Elliott, Kari Gilmore, Angela Villella, and Ingrid Simece.


 Open access

