I. INTRODUCTION
It is well known that phase separation takes place in borosilicate glasses (SiO2–B2O3–M2O, M = alkali), the composition of which are within an immiscibility region.Reference Mazurin, Roskova, Porai-Koshits, Mazurin and Porai-Koshits1, Reference Haller, Blackburn, Wagstaff and Charles2 The region becomes smaller when the size of alkali ion becomes larger, i.e., alkali ion shifts from lithium to cesium.Reference Mazurin, Roskova, Porai-Koshits, Mazurin and Porai-Koshits1–Reference Levin and McMurdie3 Therefore, one can find compositions with the same molar fractions of SiO2, B2O3, and M2O, which are out of the immiscibility region at a temperature higher than the glass transition when M is a large alkali ion, but within the region when M is a small alkali ion. Thus, with such a composition of the large alkali ion, one can prepare a transparent glass, in which phase separation is not observed macroscopically because the composition is out of the immiscibility region. Then, replacing the large alkali ion by the smaller one through ion-exchange technique, it is expected that phase separation takes place in the glass when the composition of the glass enters into the immiscibility region after the ion exchange. In fact, Karapetyan et al.Reference Karapetyan, Loboda and Tagantsev4, Reference Karapetyan, Loboda and Tagantsev5 reported that phase separation can be induced in borosilicate glasses through ion exchange and subsequent annealing process. However, they only investigated the phase separation with naked eye observation and absorption spectroscopy; the separated phases were not characterized.
We have also investigated the ion-exchange-induced phase separation, in which it was suggested that the phase separation takes place through spinodal decomposition.Reference Kadono, Hattori, Wakasugi, Shiomi and Nishii6 In this article we present experimental results and discussion in more detail. Here, we prepared a sodium borosilicate glass with a composition, the immiscibility temperature of which is lower than the glass transition temperature of the glass; the glass was transparent and no phase separation was observed. Then, we exchanged sodium ions in the glass by lithium ions. Through this process we obtained a glass in which phase separation was induced only at the ion-exchanged domains and the other parts were still transparent. Furthermore, we obtained a glass in which the phase-separated domains became porous by immersing the ion-exchanged glass in an acid solution. The characterization of the porous domains provided structural feature on the phase-separated domains of the original ion-exchanged glass. Through the ion-exchange-induced phase separation and acid treatment, we first prepared a monolithic glass which consists of porous domains, and homogeneous and transparent parts.
II. EXPERIMENTAL PROCEDURE
Glasses with a composition, 70SiO2·15B2O3·15Na2O in mol%, were prepared from raw materials, SiO2, B2O3, and Na2CO3, by melting the batch mixture in a Pt crucible at 1400 °C for 1 h. The obtained glasses were annealed at 600 °C for 1 h, cut in the size of 10 × 10 × 20 mm3, and optically polished. The glasses were colorless and transparent. For comparison, we prepared glasses with compositions, 70SiO2·15B2O3·7.5Na2O·7.5Li2O and 70SiO2·15B2O3·15Li2O, in which a half of and whole sodium in the 70SiO2·15B2O3·15Na2O glass were replaced by lithium, respectively. The former was transparent but a little hazy and the latter opaque. Hereafter, the glasses, 70SiO2·15B2O3·15Na2O, 70SiO2·15B2O3·7.5Na2O·7.5Li2O, and 70SiO2·15B2O3·15Li2O are denoted as 15Na, 7.5Na·7.5Li, and 15Li glasses, respectively.
Ion exchange was performed by immersing the 15Na glasses in LiNO3 molten salt at 400 °C for 12 h. Subsequently, heat treatments for the ion-exchanged glasses, i.e., post heat treatment, were performed at 600, 625, and 650 °C for various periods. After the post heat treatments, acid leaching was performed by immersing the glasses in 1 M HNO3 solution at 90 °C for 30 min.
X-ray diffraction patterns were measured for judgments of vitrification or devitrification and for assignments of crystallites in samples. The surfaces of samples were observed by scanning electron microscopy (SEM). Depth profiles of sodium distributions from the surface were measured with an energy dispersive x-ray (EDX) microanalyzer equipped to the SEM. The distributions and average diameters of the pore size were measured with a mercury porosimeter. Elemental analyses for acid solutions after the acid leaching treatments were performed with inductively coupled plasma (ICP) chemical analysis.
III. RESULTS
A. Ion exchange and post heat treatment
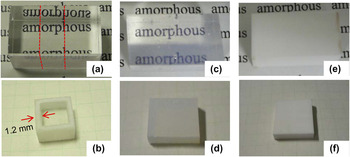
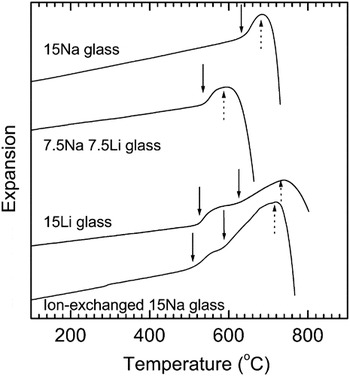
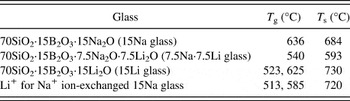
Figure 1 shows photographs of the 15Na glass before ion exchange and after ion exchange, and cut as shown in the photo. The glass was transparent before the ion exchange, while after the ion exchange, the surface region up to 1.2 mm inside became opaque. This suggests that the Li+ ions reached the depth with the ion-exchange condition of the present study. Photographs of 7.5Na·7.5Li and 15Li glasses as prepared and after heat treatment at 600 °C for 48 h are presented for comparison. The 7.5Na·7.5Li glass as prepared was transparent though a little hazy while it became completely opaque after the heat treatment. On the other hand, the 15Li glass as prepared was opaque and became more after the heat treatment. The x-ray diffraction patterns of the 7.5Na·7.5Li and 15Li glasses before the heat treatment presented in S1, showed only halo patterns, while after the heat treatment, a very small diffraction line assigned to SiO2 (cristobalite) crystallites was observed for both the glasses. This indicates that phase separation takes place in the 7.5Na·7.5Li and 15Li glasses. Figure 2 shows the thermal expansion curves measured with a dilatometer. The glass transition and softening temperatures obtained from these curves are summarized in Table I. The thermal expansion curve of the 15Li glass has two steps showing two glass transition temperatures. This is a typical curve for a phase-separated glass.Reference Shelby7 It is noteworthy that the expansion curve of the ion-exchanged 15Na glass was similar to that of the 15Li glass.
Photographs of 15Na glass (a) before and (b) after ion exchange, (c) 7.5Na·7.5Li glass as prepared and (d) heat treated at 600 °C for 48 h, 15Li glass (e) as prepared and (f) heat treated at 600 °C for 48 h. The glasses in (a), (c), and (e) were 10 × 10 × 20 mm3 in size and cut along red lines as shown in (a) after ion exchange or heat treatment to those in (b), (d), and (f), respectively.

Thermal expansion curves as-prepared 15Na glass, 7.5Na·7.5Li glass, 15Li glass, and 15Na glass ion-exchanged at 400 °C for 12 h. Arrows in solid lines and dashed lines represent the glass transition and softening temperatures, respectively.

Glass transition (T g) and softening (T s) temperatures measured with a dilatometer.

Ion exchange was performed in LiNO3 molten salt at 400 °C for 12 h.
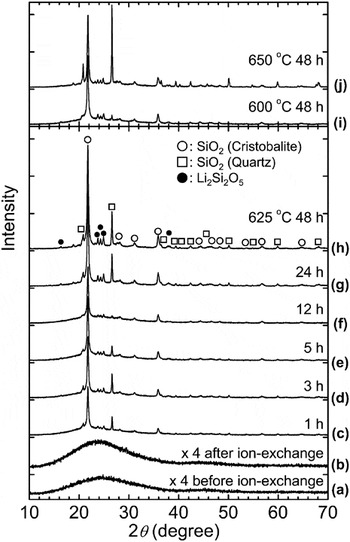
Post heat treatments were performed for the ion-exchanged 15Na glasses at 600, 625, and 650 °C for various periods ranging from 1 to 48 h. Although the opaque domain became more, the transparent part inside of the glasses showed no variation even after the post heat treatments. Figure 3 shows x-ray diffraction patterns of the as-prepared 15Na glass before ion exchange, and the opaque domain of the ion-exchanged 15Na glass without the post heat treatment and those after the post heat treatments at 625 °C. The x-ray diffraction patterns of the opaque domains of the ion-exchanged glasses after the post heat treatments at 600 and 650 °C for 48 h are also shown. The x-ray diffraction of the opaque domain of the ion-exchanged glass without the post heat treatment shows only a halo pattern as well as that of the as-prepared 15Na glass. It is supposed that the ion-exchanged domain became opaque not owing to the crystallization but to the phase separation. After the post heat treatments, some crystallite phases, i.e., SiO2 (cristobalite and quartz) and Li2Si2O5 (lithium disilicate), were precipitated. The intensities of the diffraction lines of these crystallites almost increased with the heat treatment time.
X-ray diffraction patterns of (a) the as-prepared 15Na glass before ion exchange, (b) the ion-exchanged glass without post heat treatment, and (c)–(j) those after ion exchange and post heat treatment at various conditions.

B. Acid leaching treatments of ion-exchanged glasses
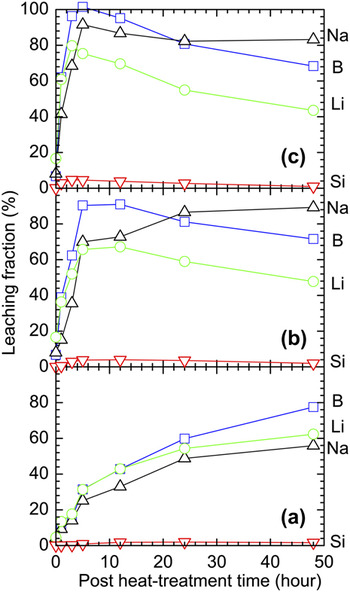
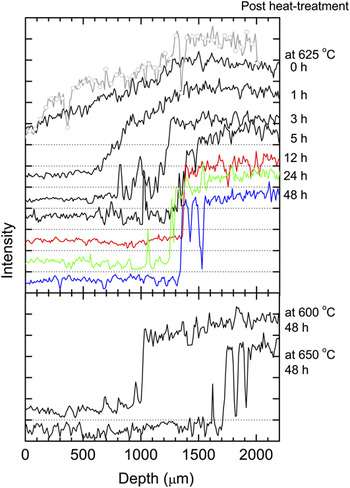
Figure 4 indicates the results of ICP analyses of lithium, sodium, boron, and silicon leaching in 1 M HNO3 solutions, in which post heat treated glasses were immersed at 90 °C for 30 min. The dependences of the leaching fraction on the post heat treatment time are shown. The leaching fraction of lithium was defined as a ratio of leaching Li+ ions to incorporated ions with the ion exchange. The leaching fractions of the other elements were defined as the ratios of leaching ions to the ions presented at the ion exchanged domain, i.e., from the surface to the diffusion depth of Li+. The diffusion depth was determined with an EDX line profile of Na+ distribution (Fig. 5). The amount of Na+ ions presented in the region was estimated from the difference of the amounts of those presented before ion exchange and of the incorporated Li+ ions assuming that the Li+ ions were exchanged only with the Na+ ions in the glass. As shown in Fig. 4, silicon hardly leached regardless of the post heat treatment temperature and time. On the other hand, although lithium, sodium, and boron did not almost leach for the glasses before the post heat treatments (time = 0), these elements leached after the post heat treatments. For the glass heat treated at 600 °C, their leaching fractions increased with the post heat treatment time. For the glasses heat treated at 625 and 650 °C, the fractions rapidly increased until 5 h and after that gradually varied. The leaching of lithium, sodium, and boron from the post heat treated glasses suggests that the heat treatment evolved interconnected structure of two phases, i.e., SiO2-rich and borate (B2O3–Na2O and Li2O)-rich phases and that the phase separation takes place through spinodal decomposition. The phase separation proceeded with the time of the post heat treatment at 600 °C [Fig. 4(a)], while it completed with 5 h at 650 °C as shown by the fact that Na+ leaching fraction reached almost 100% at this time [Fig. 4(c)]. The decrease in the fractions after the maximal values is probably due to precipitation of crystallites shown in Fig. 3, which block the leaching of borate phases.
Results of inductively coupled plasma analyses of lithium, sodium, boron, and silicon leaching in 1 M HNO3 solutions, in which post heat treated glasses were immersed at 90 °C for 30 min. The dependences of the leaching fraction on the time of post heat treatment at (a) 600 °C, (b) 625 °C, and (c) 650 °C are shown.

Sodium distribution profiles for the ion-exchanged glass, for which neither post heat treatment nor acid leaching was performed (gray circles and solid line), and the ion-exchanged glasses with post heat treatment at 625 °C for various periods followed by the acid leaching, and with post heat treatment at 600 and 650 °C for 48 h followed by the acid leaching (solid lines).

Depth profiles of sodium distribution measured with EDX are shown in Fig. 5 for the ion-exchanged glass, for which neither post heat treatment nor acid leaching was performed, and the ion-exchanged glasses with post heat treatment at 625 °C for various periods followed by the acid leaching. Figure 5 also shows the profiles for the ion-exchanged glasses with post heat treatment at 600 and 650 °C for 48 h followed by the acid leaching. The depth profiles of the ion-exchanged glass with neither post heat treatment nor acid leaching and with acid leaching (post heat treatment time = 0 h) were very similar, in which sodium distribution gradually increases and became constant at about 1400-μm depth from the surface. This suggests that the lithium distribution gradually decreases from the surface along the depth as a result of the lithium diffusion and that the diffusion depth of lithium reached 1400 μm. The depth is consistent with the fact that the thickness of opaque domain after the ion exchange is about 1.2 mm [Fig. 1(b)]. The leaching of sodium, lithium, and boron was scarcely observed from the ion-exchanged glass without the post heat treatment though the surface domain became opaque. Thus, although the Li+-ion incorporation induced a phase separation, it did not enough proceed so that the interconnected structure of phases was evolved as mentioned above. For the ion-exchanged glasses with the post heat treatment, sodium leaching depth increased with increasing the heat treatment time. For the glass heat treated for 5 h, sodium completely leached until 1300-μm depth, which is almost the same as the diffusion depth of lithium predicted from the sodium distribution profile. For the glass heat treated at 650 °C, sodium leached until 1300-μm depth with the heat treatment even for 3 h (not shown in Fig. 5), and the leaching depth reached 1800 μm with 48 h. On the other hand, the leaching depth was 1000 μm for the glasses heat treated at 600 °C for longer than 24 h. These facts show that the phase separation enough proceeded for the glasses, which were heat treated at the conditions: at 600 °C for longer than 24 h and at 625 and 650 °C for longer than 5 h. The x-ray diffraction patterns of the ion-exchanged glasses with post heat treatment at 625 °C for various periods followed by the acid leaching presented in S2 show only the diffraction lines of SiO2 crystallites (cristobalite and quartz) on a halo pattern. The crystallites, Li2Si2O5, observed in the x-ray patterns before the acid leaching were disappeared.
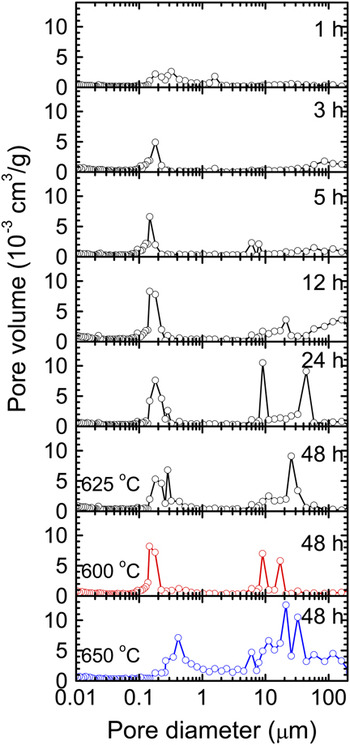
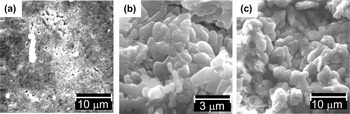
Pore size distributions are shown in Fig. 6 for glasses heat treated at 625 °C for various times, and at 600 and 650 °C for 48 h followed by acid leaching. For the glasses heat treated at 625 °C, pores of 200 nm diameter emerged at first and the distribution became larger with the heat treatment time. For the heat treatment longer than 24 h, pores of diameter larger than 10 μm were also observed. Both distribution profiles in the glasses heat treated at 600 and 650 °C for 48 h were similar to that in the glass heat treated at 625 °C although the peak positions slightly shifted. In the glass heat treated at 650 °C, pores with medium size between the two peaks were also observed. Figure 7 shows the SEM images of the surface of glasses which were treated at various conditions demonstrating the porous feature of the acid leaching domains.
Pore size distributions for glasses heat treated at 625 °C for 1 to 48 h and at 600 and 650 °C for 48 h followed by acid leaching.

Scanning electron microscopy images of the surface of glasses which were treated at various conditions demonstrating the porous feature of the acid leaching domains: post heat treated (a) at 600 °C for 48 h, (b) at 625 °C for 5 h, and (c) at 650 °C for 5 h.

IV. DISCUSSION
Immiscibility regions in composition for SiO2–B2O3–Na2O and SiO2–B2O3–Li2O are found in literatureReference Mazurin, Roskova, Porai-Koshits, Mazurin and Porai-Koshits1–Reference Karapetyan, Loboda and Tagantsev5 and illustrated in S3. The immiscibility temperature of the 15Na glass is under 550 °C, while that of 15Li glass is over 950 °C. This means that no phase separation takes place in the 15Na glass at the temperature range between 550 and 950 °C, whereas it is observed in the 15Li glass. The immiscibility regions as shown in S3 indicate immiscibility temperatures when the melts of the composition are cooled to the temperature and kept there. Therefore, they cannot be applied to the ion-exchanged glass system. However, since they indicate the phase-separation temperature of the composition, the phase separation is expected to be induced in the Li+ for Na+ ion-exchanged 15Na glass by the annealing at a temperature between 550 and 950 °C because of the rise of the immiscibility temperature by the ion exchange. In the present experiments, the ion exchange at 400 °C made the glass opaque at the ion-exchanged domain, indicating that the phase separation took place there, while no phase separation was observed in the part inside of the glass where Li+ ions did not reach. Although the ion-exchange temperature (400 °C) is below the immiscibility temperature of the 15Na glass (550 °C), the latter fact, that no phase separation was observed inside of the glass, can be explained by the fact that the temperature is much lower than the glass transition temperature of the 15Na glass (636 °C). On the other hand, the glass transition temperature of the ion-exchanged domain became lower (513 °C) than that of the original glass before ion exchange. This temperature is still higher than the ion-exchange temperature. Nevertheless, the phase separation was observed at the ion-exchanged domain. A reason is that the rise of the immiscibility temperature by the ion exchange increases the tendency for the phase separation. Furthermore, the diffusion process of Na+ and Li+ ions itself probably induces the phase separation. The post heat treatment at temperatures between 600 and 650 °C enhanced the phase separation. This is reasonable because the temperatures are higher than the glass transition temperature of the Li+ for Na+ ion-exchanged domain and are expected to be lower than the immiscibility temperature of the domain. On the other hand, at the parts in which ion exchange did not occur, no phase separation was observed because the post heat treatment temperatures were higher than the immiscibility temperature of the domain (550 °C) and still below the glass transition temperature in the cases of the heat treatments at 600 and 625 °C.
As discussed above, the ion-exchange-induced phase separation is almost thermodynamically understandable based on the phase or immiscibility diagram. In the process, however, the interdiffusion of alkaline ions and rearrangements of glass networks simultaneously occur; as this kind of subject, structural change and relaxation of glass networks induced by ion exchange has become an important issue and has been investigated.Reference Yamane, Shibata, Yasumori, Yano and Takada8–Reference Ingram, Wu, Coats, Kamitsos, Varsamis, Garcia and Sola10 Therefore, spectroscopic and more kinetic approaches are necessary to clarify the mechanism of the ion-exchange-induced phase separation. Thus, detailed investigation is in progress.
V. CONCLUSIONS
By the immersion of 15Na glass in LiNO3 molten salt at 400 °C for 12 h, the Li+ ions were substituted for the Na+ ions in the glass at the domain from the surface to 1400 μm in depth. The ion exchange induced phase separation at the domain because of the rise of the immiscibility temperature. The post heat treatment of the ion-exchanged glasses at a temperature higher than 600 °C enhanced the phase separation, but the part, in which ion exchange did not occur, kept homogeneous and transparent as well as the original glass. The acid leaching treatment suggested that the phase separation created the interconnected structure of the separated phases. The acid leaching made the ion-exchanged domain of the glass porous; the average pore size was about 200 nm. The ion-exchange-induced phase separation followed by the acid leaching provides a method to prepare monolithic glasses which consist of porous domains, and homogeneous and transparent parts.
The phase separation or immiscibility phenomena in glass-forming systems have been well known and investigated so far.Reference Mazurin, Roskova, Porai-Koshits, Mazurin and Porai-Koshits1–Reference Levin and McMurdie3 However, they are still an important issue not only from the scientific but also technological aspects.Reference Yazawa, Kuraoka and Du11–Reference Martineau, Michaelis, Schuller and Kroeker17 Although the ion-exchange-induced phase separation is a more complicated process than the conventional phase separation, the investigation on the mechanism may give an insight for understanding these phenomena, which have continued to receive much attention, in more details. Furthermore, since porous glasses prepared through the conventional phase separation have already found various kinds of interesting and useful applications,Reference Hood and Nordberg18–Reference Minamiyama, Daiko, Mineshige, Kobune and Yazawa27 the porous-transparent hybrid glasses presented in this study are expected to be promising materials in wider applications.
ACKNOWLEDGMENTS
This work was carried out in Next-generation Nanostructured Photonic Device and Process Technology as part of Program to Create an Innovative Components Industry supported by New Energy and Industrial Technology Development Organization. One of the authors (K. K.) is also grateful for the financial support from Murata Science Foundation.