Introduction
Intrauterine growth restriction (IUGR) is the failure to achieve the essential growth potential for a given fetus owing to maternal, fetal, placental or umbilical disorders.Reference Peyter, Delhaes and Baud 1 , Reference Pisaneschi, Boldrini, Genazzani, Coceani and Simoncini 2 The incidence of IUGR is ~5–10%.Reference Bamfo and Odibo 3 Previous studies have shown that IUGR is associated with a reduction in nephron numbers at birth, which increases the risk of renal diseases and hypertension in adulthood.Reference Myrie, McKnight, Van Vliet and Bertolo 4 , Reference Baserga, Bares and Hale 5
The development of the mammalian kidney is the result of mutual inductive interactions between the ureteric bud and the metanephric mesenchyme. The whole complex process is tightly regulated by the expression of numerous genes in a spatiotemporal-specific pattern.Reference Stuart, Bush and Nigam 6 However, IUGR is reported to be associated with abnormal gene expression patterns and signaling pathways concerning kidney development.Reference Baserga, Bares and Hale 5 , Reference Figueroa, Lozano and Suazo 7 – Reference Grigore, Ojeda and Robertson 9
Ouabain, a specific ligand of Na–K–ATPase, inhibits the activity of Na–K–ATPase in a dose-dependent manner. Accumulating evidence has suggested that ouabain is a mammalian hormone produced in the adrenal glands and hypothalamus.Reference Shah, Laredo, Hamilton and Hamlyn 10 – Reference Lichtstein, Steinitz and Gati 12 The circulating level of endogenous ouabain ranges from 0.5 to 2.0 nM.Reference Dvela-Levitt, Cohen-Ben Ami and Rosen 13 However, recent studies have revealed that low concentrations of ouabain may stimulate Na–K–ATPase, triggering several complex signaling pathways and exerting different biological effects.Reference Liu and Xie 14 – Reference Xie and Askari 16
High circulating levels of ouabain have been found during pregnancy and the postnatal period, and the fetal plasma concentration of ouabain approximated the maternal levels.Reference Xie and Cai 17 In pregnant mice an anti-ouabain antibody reduced the circulating level of ouabain, resulting in a significant loss of birth weight and kidney dysplasia.Reference Dvela-Levitt, Cohen-Ben Ami and Rosen 13 In our previous work we found that low doses of ouabain partially restored the number of nephrons in IUGR rats.Reference Li, Khodus and Kruusmagi 18 – Reference Khodus, Kruusmagi, Li, Liu and Aperia 20 To discover the molecular mechanisms of this process, in this study we investigated the gene expression and signaling pathways of embryonic kidneys.
Materials and methods
Animals
The experimental protocol was approved by the Ethics Review Board for Animal Studies of Drum Tower Hospital, Medical School of Nanjing University, China. All procedures were performed in accordance with the Guide for the Care and Use of Laboratory Animals published by the US National Institutes of Health (NIH Publication No. 85–23, revised 1996). Sprague–Dawley (SD) rats were purchased from Vital River (Vital River, Beijing, China) and housed in a room maintained at 23°C, 65–75% humidity, with a controlled 12-h light–dark cycle. Before pregnancy the rats were allowed free access to a standard diet and purified water. A total of 12 female SD rats weighing between 250 and 265 g were used. Vaginal smears were performed daily to determine the stage of the estrus cycle. During estrus, female rats were housed with the same male rat for 6 h, and gestational day 0 (GD0) was determined by the appearance of sperm in vaginal smears.
Rat diets and research design
The 12 pregnant rats were randomly divided into three groups. In the control group (n=4) all rats received the standard diet (No. 20121023; Xietong Organism, Nanjing, China; protein, 22.10%; fat, 5.28%; carbohydrate, 52.00%; metabolizable energy, 3520 kcal/kg) throughout the experiment. In the IUGR group (n=4) they were fed a 75% caloric low-protein diet (SY01; Slac Laboratory Animal, Shanghai, China; protein, 9.00%; fat, 3.20%; carbohydrate, 72.6%; metabolizable energy, 3530 kcal/kg). At GD2, all rats in the IUGR group were anesthetized by inhalation of ether, and mini osmotic pumps (model 2004; Alzet, Cupertino, CA, USA) delivering sterile phosphate-buffered saline (PBS) solution were implanted in the abdominal cavity. In the ouabain group (n=4) all rats received the same treatment as the IUGR group, except that the mini pumps delivered ouabain dissolved in PBS (10 μg/kg body weight/day, at a rate of 0.25 μl/h, which maintained the plasma level of ouabain at ~1 nM).Reference Khodus, Kruusmagi, Li, Liu and Aperia 20
Food intake, maternal body weight and blood parameters
All pregnant rats were kept individually in metabolic cages for 16 days, from GD0 to GD16. The food intake of the control group was recorded daily, and mean food intake on the given GD was calculated.
All pregnant rats were weighed daily, and blood pressure was measured every 3 days using a programmable tail-cuff sphygmomanometer (BP-2006 A; Softron, Tokyo, Japan).Reference Chen, Yue and Wu 21 Previous studies have shown that a group of genes associated with the early stage of kidney development were highly expressed at about GD16, and so embryonic kidneys at GD16 were isolated.Reference Stuart, Bush and Nigam 22 When the pregnant rats were sacrificed, maternal blood samples were collected. Hematological analysis of maternal whole blood was conducted using an automatic analyzer (COULTER LH 780 Hematology Analyzer; Beckman Coulter, Atlanta, GA, USA). Serum samples from pregnant rats were prepared by centrifugation, and total protein, glucose, urea nitrogen, creatinine, triglyceride and cholesterol were analyzed using commercially available assays (AU Test Menu; Beckman Coulter, Brea, CA, USA) according to the manufacturers’ guidelines (AU5800 Clinical Chemistry System; Beckman Coulter, Brea, CA, USA).
Fetal weight, RNA isolation, quality control, complementary DNA (cDNA) synthesis and sequencing
Litters of <10 or >14 were excluded, and the remaining pups were weighted. Embryonic kidneys were isolated under a stereomicroscope and immediately frozen in liquid nitrogen, then stored at −80°C for further analysis of messenger RNA (mRNA) expression. All the embryonic kidneys isolated from the same pregnant rat were pooled in one vial for later RNA extraction.
The total RNA of embryonic kidneys was extracted using TRIZOL reagent (Invitrogen, Grand Island, NY, USA) and purified with the Qiagen RNeasy mini kit (Qiagen, Valencia, CA, USA). The integrity of the RNA was determined by denaturing agarose electrophoresis, and its quality was evaluated using an ND-8000 spectrophotometer (Nanodrop Technologies, Wilmington, DE, USA). RNA samples were used if there was no smear on the agarose and the value of OD260/OD280 was between 1.8 and 2.0. The quantity of RNA was determined by the OD260 value.
The same amount of RNA from the vials in the same group was pooled for later cDNA synthesis. Single- and double-stranded cDNA was synthesized from mRNA samples using SuperScript II (Invitrogen). The double-stranded cDNA was then purified for end repair, dA tailing, adaptor ligation and enrichment of DNA fragments. The size was checked using a DNA-specific chip (Agilent DNA-1000; Agilent Technologies, Loveland, CO, USA) on an Agilent Technologies 2100 Bioanalyzer (Agilent Technologies). The libraries were quantified using Qubit (Invitrogen) according to the Qubit user guide. Thus, there were three libraries in total, one for each group. Libraries were pooled and sequenced for 100 cycles on one lane of an Illumina HiSeq2000 instrument (Illumina, Inc., San Diego, CA, USA). Sequencing was done using a TruSeq SBS sequencing kit version 2 (Illumina, Inc.) and analyzed with Illumina RNA-Seq pipeline version 1.8 (Illumina, Inc.).
Real-time quantitative polymerase chain reaction (qRT-PCR)
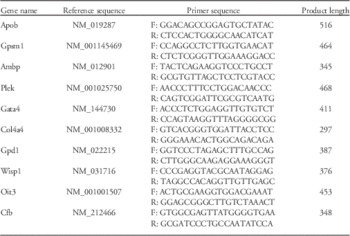
qRT-PCR was performed using the SYBR PrimerScript RT-PCR kit (TaKaRa Bio, Osaka, Japan) with SYBR Green dye to confirm the sequencing results. The RNA used for qRT-PCR was prepared in the same way as for the total RNA extraction. In the qRT-PCR analysis there were four samples per group for litters of the same group being assessed separately, and the mean fold change in gene expression was compared with the sequencing result. The reference gene (β-actin) was set as an inner control for detecting the expression levels of selected genes. The primers used for qRT-PCR are listed in Table 1. The qRT-PCR conditions were as follows: 95°C for 15 min followed by 40 cycles at 95°C for 15 s and 60°C for 1 min. The qRT-PCR analysis of each sample was done in triplicate and the fold change of each gene expression was determined by the comparative cycle threshold method.
Primers used to validate the results of RNA sequencing

Data analysis
Three series of raw data obtained from sequencing were pre-processed to exclude reads shorter than 25 bp. Reads of the control group were compared with those of the IUGR group, and reads of the IUGR group were compared with those of the ouabain group. When calculated P-values were <0.05 and absolute values of log2 ratio were >1, genes were considered to be expressed differentially. Two lists of these above differentially expressed genes (DEGs) were submitted to the Database for Annotation and Visualization and Integrated Discovery (DAVID). Gene ontology (GO) enrichment analysis was performed using the GOEAST software toolkit (http://omicslab.genetics.ac.cn/GOEAST/), and a false discovery rate (FDR)-adjusted P-value<0.05 was considered a significant level of GO term enrichment. The Kyoto Encyclopedia of Genes and Genomes (KEGG) biological molecular pathway analysis was conducted to identify possible enrichment of genes with specific biological themes, and significant enrichment of DEGs was identified by a hypergeometric test (FDR adjusted P<0.05).
Statistical analysis
Statistical analyses were conducted using SPSS 18.0 (IBM Corporation, Armonk, NY, USA). The results were presented as means±s.e.m. One-way ANOVA and the S–N–K test were used to estimate the statistical significance of maternal weight gain during pregnancy, maternal blood pressure, litter size, fetal body weight and blood parameters. Pearson’s correlation coefficient was used to analyze the correlation between sequencing results and RT-PCR results, and P<0.05 was considered significant.
Results
Ouabain partially restored the maternal weight gain reduced by malnutrition
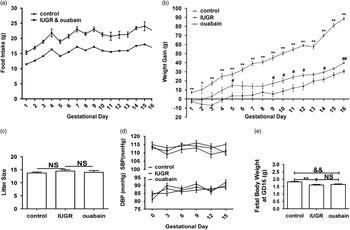
Figure 1a shows the food intake of the control, IUGR and ouabain groups. Body weight gain was defined as pregnant weight minus pre-pregnant weight. At GD16 the weight gain in both the IUGR and the ouabain groups was less than that in the control group (P<0.001, S–N–K test). Ouabain partially restored the weight gain reduced by maternal malnutrition (P=0.031, S–N–K test) (Fig. 1b). However, we saw no difference in either litter sizes (Fig. 1c) or the blood pressure of pregnant rats (Fig. 1d). Maternal malnutrition during pregnancy significantly reduced pup weight, and ouabain treatment had no significant effect on pup weight (Fig. 1e).
Food intake, body weight gain, litter size and blood pressure of the three groups. (a) Food intake during pregnancy. Each rat in the intrauterine growth restriction (IUGR) and ouabain groups was fed 75% amount of an isocaloric low-protein diet. (b) Body weight gain during pregnancy. (c) Litter size of each group. (d) Blood pressure of pregnant rats. (e) Fetal body weight of each group. One-way ANOVA and S–N–K test were used. *P<0.05, **P<0.001, IUGR group v. control group; #P<0.05, ##P<0.001, ouabain group v. IUGR group; &&P<0.001, ouabain group v. control group; SBP, systolic blood pressure; DBP, diastolic blood pressure; NS, no significant difference.

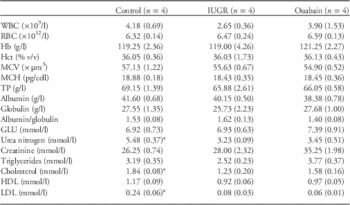
Serum tests of the maternal blood showed that urea nitrogen, cholesterol and low-density lipoprotein were significantly higher in the control group than in the IUGR group (P<0.05, S–N–K test), and there was no significant difference between the IUGR and ouabain groups (Table 2).
Parameters of maternal blood samples

IUGR, intrauterine growth restriction; WBC, white blood cell; RBC, red blood cell; Hb, hemoglobin; Hct, hematocrit; MCV, mean corpuscular volume; MCH, mean corpuscular hemoglobin; TP, total protein; GLU, blood glucose; HDL, high-density lipoprotein; LDL, low-density lipoprotein.
One-way ANOVA and S–N–K test were used.
*P<0.05, IUGR group v. control group.
Characterization of sequencing and mapping, validation of the RNA-seq quality by qRT-PCR
With an average of seven million reads for each library, a total of 21 million raw sequencing reads were generated from the libraries. The high-quality reads were subjected to the reference genome (UCSC human genome rn5) by TopHat. More than 90% of the reads were uniquely mapped to the reference genome without mismatches (Table 3).
Statistics of raw sequencing reads

IUGR, intrauterine growth restriction.
RNA sequencing reads were mapped to the UCSC genome rn5 by TopHat. TopHat allows up to two mismatches when mapping to the reference genome.
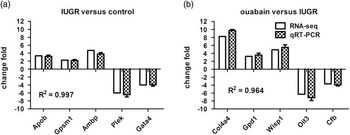
We compared the fold changes from qRT-PCR with the RNA-seq results and found that both results correlated well with each other (correlation coefficients 0.997 and 0.964, respectively; P<0.001) (Fig. 2).
Validating the RNA-seq results using real-time quantitative polymerase chain reaction (qRT-PCR). (a) Intrauterine growth restriction (IUGR) group v. control group; (b) ouabain group v. IUGR group. The correlation coefficient was calculated using Pearson’s correlation analysis.

Summary analysis of DEGs
The expression level of genes was determined as fragments per kilobase of transcript per million fragments mapped (FPKM). With the criterion that FPKM was >1, the numbers of identified genes were 10,994, 10,973 and 11,099 in the control, IUGR and ouabain groups, respectively.
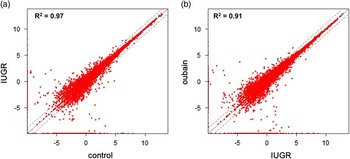
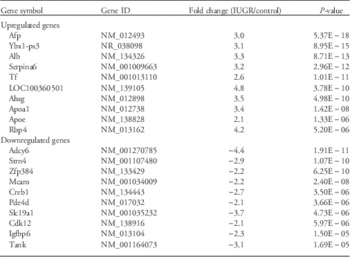
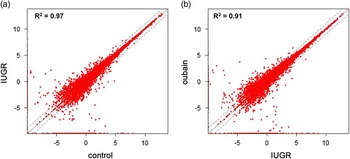
We further conducted a correlation analysis of gene expression level between the IUGR and control groups and the results showed that the global profile of gene expression was generally highly correlated (Fig. 3a). With the threshold of P<0.05 and no less than a two-fold change of expression, 322 genes were identified as differentially expressed (177 upregulated and 145 downregulated) in the IUGR group. The top 10 upregulated and downregulated genes are listed in Table 4.
Scatter plot analysis for global expression. (a) Scatter plot analysis for global expression between the intrauterine growth restriction (IUGR) and control groups; (b) scatter plot analysis for global expression between the ouabain and IUGR groups.
Summary of top 10 upregulated and downregulated differentially expressed genes between the intrauterine growth restriction (IUGR) and control groups

The genes were ranked based on the P-values.
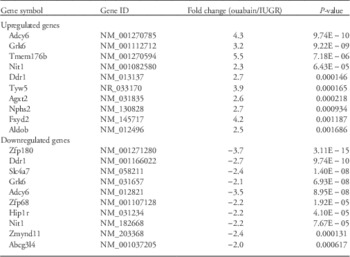
Meanwhile, correlation analysis of gene expression level between the ouabain group and the IUGR group showed that the global profile of gene expression was highly correlated (Fig. 3b). Using the same criteria as above, 318 genes were considered differentially expressed between the ouabain and IUGR groups (180 increased and 138 decreased). The top 10 increased and decreased genes are shown in Table 5.
Summary of the top 10 upregulated and downregulated differentially expressed genes between the ouabain and intrauterine growth restriction (IUGR) groups

The genes were ranked based on the P-values.
One isoform of adenyl cyclase type VI (Adcy6) (NM_001270785) was downregulated in the IUGR group, but this was almost totally reversed by ouabain treatment. The other isoform of Adcy6 (NM_012821) was significantly downregulated in the ouabain group compared with the IUGR group.
Analysis of genes involved in kidney development and function
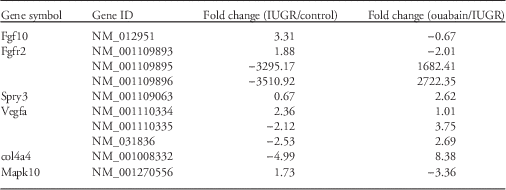
A total of 42 genes, which have been reported to be crucial for kidney development and function, were selected for special analysis. Among these genes, several were identified on more than one transcript. Our data showed that ouabain treatment could partially reverse the IUGR-induced alteration of several genes (Fgfr2, Vegfa and col4a4) (Table 6). The expression of other genes previously demonstrated to be important in kidney development (including Fgfr1, Fgf8, Wt1, Ret, Gdnf, Gfra1, Slit2, Robo2, Bmp4, Spry1, Spry2, Spry4, Six1, Gata3, Tcf21, Pdgfra, Col4a1, Cd2ap, Kirrel, Wnt11, Wnt9b, Lif, Tgfb1, Wnt4, Osr1, Pax8, Bmp2, Pax2, Igf1, Notch1, Notch2, Notch3, Notch4, Mapk8, Cdh6 and Cdh11) was not significantly different between treatment groups.
Analysis of genes involved in kidney development and function (from the literature)

IUGR, intrauterine growth restriction.
The negative values refer to decreased fold changes.
Functional annotation of DEGs
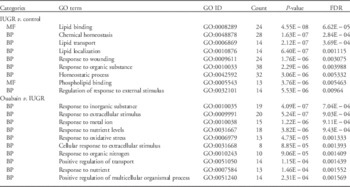
We conducted GO enrichment analysis to assess the biological implications of DEGs, which were clustered into different functional categories for biological process (BP), cellular components and molecular function to describe their properties (Table 7).
The highly enriched gene ontology (GO) categories of differentially expressed genes

FDR, false discovery rate; IUGR, intrauterine growth restriction.
KEGG pathway analysis
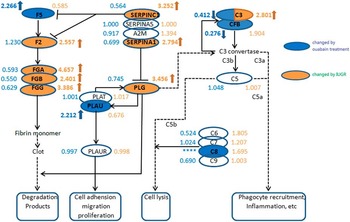
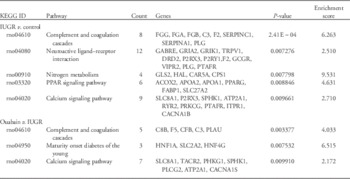
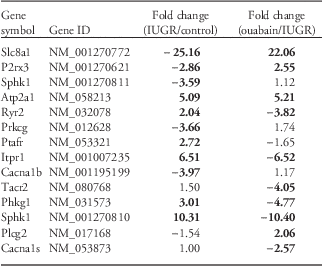
To further investigate the biological function of DEGs, we also explored potential pathways by enrichment analysis of the KEGG database in DAVID. We selected pathways harboring at least three genes, each with a P-value<0.01, for further classification. Five pathways affected by IUGR and three pathways affected by ouabain treatment were identified (Table 8). The complement and coagulation cascades and the calcium signaling pathway were impaired by IUGR during kidney development, but this could be rescued by ouabain treatment (Fig. 4; Table 9).
Differentially expressed genes (DEGs) involved in complement and coagulation cascades. The orange ellipse refers DEGs between the intrauterine growth restriction (IUGR) and control groups, and the blue color represents DEGs between the ouabain and IUGR groups. The numbers at the left of the ellipse and in blue mean the fold changes induced by ouabain treatment compared with IUGR; the numbers at the right of the ellipse and in orange mean the fold changes induced by IUGR compared with controls. ****Indicates that the gene did not express in the ouabain group.

The enriched Kyoto Encyclopedia of Genes and Genomes (KEGG) pathways of differentially expressed genes

IUGR, intrauterine growth restriction; PPAR, peroxisome proliferator-activated receptor.
Analysis of genes clustered into the calcium signaling pathway

IUGR, intrauterine growth restriction.
The numbers in bold represent the absolute value of fold change >2, and the negative values refer to the decreased fold changes.
Discussion
This study examined the molecular mechanisms of IUGR-induced alterations in fetal kidney development, and the impact of maternal ouabain treatment. We found that IUGR was predominantly associated with alterations to the complement and coagulation cascades and calcium signaling pathways. Importantly, ouabain was largely able to reverse these effects, which reveals the potential for novel therapeutic targets against the unfavorable impact of IUGR.
The KEGG signaling pathway analysis revealed that the most significant pathways affected by a low-protein diet are the complement and coagulation cascades, a result which is consistent with previous studies.Reference Buffat, Boubred and Mondon 23 Compared with the control group, IUGR increased the expression of FGA, FGB, FGG, F2 and PLG, which may result in increased production of clots in the microcirculation, thus reducing the supply of nutrients to the cells. The augmentation of SERPINC1 and SERPINA1 could repress the PLG activity of clot degradation, promoting the production of clots. IUGR may destroy the balance of clotting and thrombolytic activity, resulting in massive clots in the microvessels.
Compared with the IUGR group, ouabain treatment reduced the expression of FGA, FGB and FGG. Meanwhile, the induced PLAU promoted the dismantling of the clot into degradation products by activating PLG. In addition, increased expression of PLAU was associated with cell adhesion, migration and proliferation.Reference Connolly, Choi and Gardsvoll 24 All of the above findings suggest that ouabain treatment may calm the overactive coagulation system.
C3 was catalyzed into C3β, which finally formed a membrane attack complex, thereby increasing cell lysis.Reference Hoehlig, Maasch and Shushakova 25 , Reference Blom, Bergmann, Fulde, Riesbeck and Agarwal 26 At the same time, the increased C5α and C3α participated in phagocyte recruitment and the inflammatory response, bringing about cell apoptosis and death.Reference Distelmaier, Adlbrecht and Jakowitsch 27 The expression of C3 increased in the IUGR group, but ouabain treatment reduced the expression of CFB and C3, thereby counterbalancing the adverse effects of the low-protein diet.
The calcium signaling pathway was also commonly and prominently affected by IUGR and ouabain treatment, which has not previously been reported. The calcium ion is one of the intracellular signaling molecules and could trigger physiological changes in response to extracellular signals. Activation of the calcium cascade leads to multiple alterations, such as proliferation, differentiation, migration, survival and apoptosis.Reference Chen, Luther and Zhang 28 , Reference Hung, Hsu and Lin 29 In our study, ouabain treatment was able to partially reverse the alterations in expression of several genes involved in the calcium signaling pathway. Studies have shown that ouabain, at a concentration that activates the signaling function of Na–K–ATPase, can increase the activity of calcium waves, upregulating the calcium-dependent transcription factor nuclear factor κ B (NFκB) and the expression of NFκB target genes.Reference Li, Khodus and Kruusmagi 18 , Reference Li, Zelenin, Aperia and Aizman 19
IUGR is due to an insufficient supply of oxygen and nutrition to the fetus. In IUGR fetuses adapt and redistribute their energy to ensure the development of essential organs by compromising the development of others, such as the kidney and pancreas.Reference Schwitzgebel, Somm and Klee 30 Ouabain treatment during IUGR seemed to have no significant effect on fetal weight and birth weight, which indicates that ouabain does not rescue kidney development by ameliorating birth weight.
Maternal weight gain during pregnancy is positively related to the birth weight of neonates, though the amount and composition of weight gain in pregnancy are various among women.Reference Mumbare, Maindarkar and Darade 31 – Reference Davis and Hofferth 33 Our research showed that a low-protein diet during pregnancy reduced the weight gain and some of the serum chemical constituents related to nutritional status compared with the control group, whereas ouabain treatment had an upward trend to change these parameters. However, ouabain treatment did not increase fetal body weight in concert with the increased maternal weight. Previous studies have shown that low concentrations of ouabain reduce the metabolic activity of skeletal muscle by inhibiting Na–K–ATPase.Reference Benziane, Bjornholm and Pirkmajer 34 Therefore, it is possible that ouabain reduces the energy consumption of skeletal muscle and restores the body weight of pregnant rats without increasing the delivery of nutrients to the fetus. This interesting finding needs further study to explore this mechanism.
Adcy6 expression (NM_001270785) was dramatically changed by both IUGR and ouabain treatment. Ouabain completely reversed the effect of IUGR on Adcy6 (NM_001270785). This was the first report of Adcy6 expression being affected in the kidneys in an IUGR model. Adcy6 in the collecting duct is involved in arginine vasopressin-stimulated renal water reabsorption, the deficiency of which leads to a defect of urinary concentration in mice. Knockout mice present a reduction in renal cortical mRNA in all three epithelial sodium channel isoforms.Reference Rees, Kittikulsuth and Roos 35 At the same time, the other isoform of Adcy6 (NM_012821) was observed to be downregulated in the ouabain group compared with the IUGR group. The different transcripts of the same gene could be translated into different proteins, which play different roles in BPs. The function of these two Adcy6 isoforms (NM_001270785, NM_012821) needs further study.
The development of the mammalian kidney is a complex process, accompanied by a spatiotemporal-specific expression of abundant genes, which is extraordinarily sensitive to unfavorable circumstances. We found that IUGR reduced the expression of Fgfr2, Vegfa and col4a4, whereas ouabain counterbalanced the effects of IUGR. Fgfr2 is the receptor of fibroblast growth factors, which regulates ureteric bud branching. The deletion of Fgfr2 may result in anomalies of the urinary tract and kidney.Reference Bates 36 Vascular endothelial growth factor α (Vegfa) is reported to decrease in the IUGR animal at birth and to be important in the development and maintenance of glomerular architecture and function, its deletion leads to abnormal development of the kidney vessels.Reference Baserga, Bares and Hale 5 , Reference Wilkinson, Gilbert and Kinna 37 Col4a4 is essential to the development of the glomerular basement membrane (GBM), mutation of which results in a lack of GBM collagen IV (a3a4a5), in proteinuria, and kidney failure.Reference Nabais Sa, Storey and Flinter 38 This was the first report of expression of Fgf10, Vegfa and col4a4 being affected in the embryonic kidneys in an IUGR model.
In our study we introduced exogenous ouabain into pregnant rats to treat kidney hypoplasia. However, several investigations have isolated and identified ouabain in the human circulation, leading to the view that endogenous ouabain acts as a hormone to regulate complex physiological activities.Reference Murrell, Randall and Rosoff 11 , Reference Dvela, Rosen, Ben-Ami and Lichtstein 39 Thus, we may deduce that endogenous ouabain is maladjusted in IUGR and a supplement of a low concentration of exogenous ouabain could normalize the regulatory network. To confirm this hypothesis, the secretion pattern and level of endogenous ouabain need to be studied.
Our study offers a comprehensive view of gene networks influenced by IUGR and ouabain treatment, but the detailed regulatory patterns were not explored. In the future the complement and coagulation cascades and the calcium signaling pathway will be investigated using multiple molecular biological technologies. A limitation of our study is that a control+ouabain group was not included. There were effects of the ouabain treatment that appeared to be unrelated to the changes induced by IUGR.
Conclusion
Our investigation suggests that the complement and coagulation cascades and the calcium signaling pathway play important roles in the development of the embryonic kidney during IUGR, which is relevant for the development of new drugs to treat renal dysplasia.
Acknowledgments
Wu Kairong, Li Xiaokang, Qu Yeqing and Qian Liping of the Experimental Animal Research Center of Drum Tower Hospital are warmly thanked for their assistance in animal feeding. The authors also thank Genenergy Biotechnology Corporation for mRNA sequencing.
Financial Support
This study was supported by National Natural Science Foundation of China (No. 31171386).
Conflicts of Interest
The authors declare no potential conflicts of interest with respect to the research, authorship and publication of this article.
Ethical Standards
The authors assert that all procedures contributing to this work comply with the ethical standards of the Guide for the Care and Use of Laboratory Animals published by the US National Institutes of Health (NIH Publication No. 85–23, revised 1996) and has been approved by the Ethics Review Board for Animal Studies of Drum Tower Hospital, Medical School of Nanjing University.