LEISHMANIA DEVELOPMENT IN VECTORS AND HOSTS
During their life, Leishmania parasites cycle between four distinct environments. Procyclic promastigotes, the non-virulent extracellular forms, proliferate in the mid-gut of female sand flies of the genus Phlebotomus, which serve as a vector. Members of the procyclic population cease growth and differentiate into the virulent metacyclic promastigote forms that migrate through the column to the mouth of the fly (Sacks and Perkins, Reference Sacks and Perkins1985; Bates, Reference Bates1994). These virulent forms are introduced into the host during the sand fly blood meal. Once inside, they adhere to resident macrophages and are then internalized via phagocytosis (Kimblin et al. Reference Kimblin, Peters, Debrabant, Secundino, Egen, Lawyer, Fay, Kamhawi and Sacks2008; Forestier et al. Reference Forestier, Machu, Loussert, Pescher and Spath2011). Subsequently, in Old World species, lipophosphoglycan (LPG) molecules on the parasite surface attenuate phagolysosome biogenesis (McNeely and Turco, Reference McNeely and Turco1990; Holm et al. Reference Holm, Tejle, Gunnarsson, Magnusson, Descoteaux and Rasmusson2003; Vinet et al. Reference Vinet, Jananji, Turco, Fukuda and Descoteaux2011), which generates a pause that allows the promastigotes to prepare for the imminent environmental transition (Swanson and Fernandez-Moreira, Reference Swanson and Fernandez-Moreira2002; Zilberstein, Reference Zilberstein, Myler and Fasel2008). Then the parasites shed LPG until its surface content is low enough to release phagocytosis from this pause, allowing the phagosomes to acidify and fuse with primary lysosomes, forming acidic phagolysosomes (internal pH 4.5–5.5) (Rivas and Chang, Reference Rivas and Chang1983; Antoine et al. Reference Antoine, Prina, Jouanna and Bongrand1990; Lukacs et al. Reference Lukacs, Rotstein and Grinstein1991). The exposure of parasites to acidic pH at mammalian body temperature (e.g. 33–37°C) is the signal to differentiate into amastigotes, the intracellular form of Leishmania (Zilberstein and Shapira, Reference Zilberstein and Shapira1994; see review in Zilberstein, Reference Zilberstein, Myler and Fasel2008). The mid-gut of sand flies and host phagolysosomes, the major habitats of promastigotes and amastigotes, respectively, both contain strong hydrolytic enzymes. In contrast, the mouth of sand flies and the mammalian bite site, which serve as transition stations, represent milder environments with neutral pHs. Hence, the most dramatic environmental changes experienced by the parasite as it moves between the vector and host are pH and temperature.
Axenic promastigote cultures were developed for all Leishmania species in the 1960s. These cultures have enabled several important discoveries about Leishmania development including metacyclogenesis (Sacks, Reference Sacks1989), LPG structure and function (Turco, Reference Turco1988), conservation of biochemical pathways (Blum, Reference Blum1993, Reference Blum1994) and RNA editing (Stuart et al. Reference Stuart, Schnaufer, Ernst and Panigrahi2005). These cultures are so successful that data generated using axenic promastigotes have become the benchmarks many of us use when considering the divergent phenotypes of promastigotes and amastigotes. Analyses have revealed that in addition to differences in shape and motility, each life form adjusts metabolically and physiologically to their pH environments, pH 7 and 5.5 for promastigotes and amastigotes, respectively (Mukkada et al. Reference Mukkada, Meade, Glaser and Bonventre1985; Zilberstein and Shapira, Reference Zilberstein and Shapira1994; Burchmore and Barrett, Reference Burchmore and Barrett2001). Promastigotes utilize glucose as their major source of carbon whereas amastigotes oxidize fatty acids for energy and amino acids for carbon. Promastigotes catabolize glucose that is taken up from the medium whereas amastigotes must synthesize glucose via gluconeogenesis (Saunders et al. Reference Saunders, de Sauza, Naderer, Sernee, Ralton, Doyle, Macrae, Chambers, Heng, Nahid, Likic and McConville2010; Vince et al. Reference Vince, Tull, Landfear and McConville2011).
How do Leishmania sense and quickly respond to the changing environments using only 8200 genes? To date, it has been established that both promastigotes and amastigotes employ primary proton pumps and secondary carriers to keep intracellular pH constant (Glaser et al. Reference Glaser, Utz and Mukkada1992). P-type ATPases serve as primary proton pumps that create a proton electrochemical gradient across the parasite surface membrane, which mathematically is the sum of the pH gradient and membrane potential (Δμ H+=ΔpH+ZΔψ) (Zilberstein et al. Reference Zilberstein, Agmon, Schuldiner and Padan1984). To accommodate external pH changes, each life form modulates the contributions of these two components such that the proton electrochemical gradient (Δμ H+) across the parasite surface membrane stays the same. When external pH is around 7.5, promastigotes create a larger ΔpH (acidic inside) and membrane potential is relatively small. In contrast, amastigotes that proliferate at pH 4.5–5.5 create a negative pH gradient (alkaline inside) but a very large membrane potential (Glaser et al. Reference Glaser, Baatz, Kreishman and Mukkada1988; Zilberstein and Shapira, Reference Zilberstein and Shapira1994). At the molecular level, the proton turnover rate is adjusted by regulating the abundance and/or kinetics of the proton pumps and carriers. Keeping intracellular pH constant throughout the Leishmania life cycle ensures that intracellular enzymes are active in all parasite forms.
IN VITRO DIFFERENTIATION SIMULATES IN VIVO DEVELOPMENT
In vivo studies of amastigotes derived from animal models have provided information about cell structure, function and disease development. However, using the in vivo approaches it was hard to investigate the host signals that initiate parasite development or to delineate the cascade of cellular changes in gene and protein expression during intracellular differentiation. To tackle these issues, in vitro systems that simulate parasite development inside host phagolysosomes were devised. The first axenic amastigote culture employed L. mexicana and was described in this journal in 1992 by Paul Bates (Bates et al. Reference Bates, Robertson, Tetley and Coombs1992). Later, in 1998 Saar et al. reported the first axenic culture for Old World L. donovani (Saar et al. Reference Saar, Ransford, Waldman, Mazareb, Amin-Spector, Plumblee, Turco and Zilberstein1998). To date, a PubMed search using the terms ‘axenic amastigotes’ and ‘Leishmania.’ turns up more than 200 hits. All these in vitro studies employ rich tissue culture media at acidic pH and incubation at 33°C or 37°C, for cutaneous and visceral species, respectively, with or without 5% CO2.
Few in vitro studies use specific markers to survey the quality of the axenic amastigote cultures (Bates et al. Reference Bates, Robertson, Tetley and Coombs1992; Saar et al. Reference Saar, Ransford, Waldman, Mazareb, Amin-Spector, Plumblee, Turco and Zilberstein1998; Debrabant et al. Reference Debrabant, Joshi, Pimenta and Dwyer2004). Given the absence of universal controls, inconsistencies between different in vitro studies as well as between gene expression analyses of in vitro and in vivo amastigotes are hard to resolve. This notwithstanding, proteomic analyses performed in well-controlled axenic systems have proved reproducible and generated data consistent with findings from studies using host-derived amastigotes (Rosenzweig et al. Reference Rosenzweig, Smith, Opperdoes, Stern, Olafson and Zilberstein2008b; Paape et al. Reference Paape, Lippuner, Schmid, Ackermann, Barrios-Llerena, Zimny-Arndt, Brinkmann, Arndt, Pleissner, Jungblut and Aebischer2008, Reference Paape, Barrios-Llerena, Le Bihan, Mackay and Aebischer2010; Pescher et al. Reference Pescher, Blisnick, Bastin and Spath2011). A recent study by Pescher et al. (Reference Pescher, Blisnick, Bastin and Spath2011) reported that despite a loss of virulence when parasites were grown in host- free culture for a long time, protein expression and abundance in axenic versus intracellular amastigotes was >92% identical, supporting the premise that axenic amastigotes resemble host-derived amastigotes.
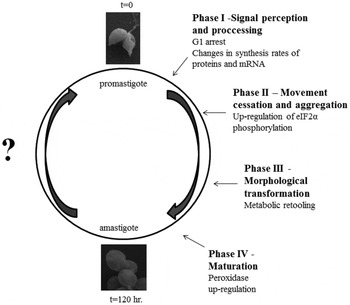
An important and novel advantage of the axenic system is the ability to monitor differentiation over time and control precisely the participation of any host molecules. Axenic L. donovani differentiation consists of four morphological phases (Fig. 1) (Barak et al. Reference Barak, Amin-Spector, Gerliak, Goyard, Holland and Zilberstein2005): signal perception with no morphological change (phase I, 0–5 hours); movement cessation and aggregation (phase II, 5–10 hours); morphological transformation to amastigote-shaped cells (phase III, 10–24 hours); and amastigote maturation (phase IV, 24–120 hours). Detailed high-coverage proteomic analyses have uncovered that L. donovani differentiation is well-regulated, with ordered and coordinated changes in protein abundance that retool the parasite's metabolic pathways for life in the new host environment (Rosenzweig et al. Reference Rosenzweig, Smith, Opperdoes, Stern, Olafson and Zilberstein2008b).
Time-course of L. donovani differentiation in a host free culture.

During L. donovani differentiation not only protein abundance but also protein modifications are altered in a regulated manner. An iTRAQ study of Rosenzweig et al. (Rosenzweig et al. Reference Rosenzweig, Smith, Myler, Olafson and Zilberstein2008a) characterizing post-translational changes during differentiation revealed methylation of arginine, aspartic acid, glutamic acid, asparagine and histidine; as well as acetylation of methionine, serine, alanine and threonine. In addition, phosphorylation was detected on serines and threonines, as well as fucosylation and hexosylations on serines, threonines and a single asparagine. This study was the first high-throughput time course analysis of post-translational modifications during development of an intracellular parasite.
To explore further the relationship between changes in mRNA levels and protein abundance, Lahav et al. (Reference Lahav, Sivam, Volpin, Ronen, Tsigankov, Green, Holland, Kuzyk, Borchers, Zilberstein and Myler2011) compared time-course microarray and proteomic data collected in parallel during L. donovani axenic differentiation. A systems approach was used to dissect the relative contribution of changes in mRNA abundance, translation efficiency and post-translational processing to the regulation of gene expression during promastigote to amastigote differentiation. It was found that regulation of mRNA levels plays a major role early in the differentiation process, whereas translation and post-translational regulation are more important at later stages. In addition, this analysis indicated that the differentiation signal triggers a transient global increase in the rate of protein synthesis, which is subsequently down-regulated when the α-subunit of translation initiation factor 2 is phosphorylated. Summarily, the relationship between mRNA and protein abundance changes as Leishmania adapts to new environmental circumstances.
To date, Rosenzweig et al. (Reference Rosenzweig, Smith, Opperdoes, Stern, Olafson and Zilberstein2008b), Lahav et al. (Reference Lahav, Sivam, Volpin, Ronen, Tsigankov, Green, Holland, Kuzyk, Borchers, Zilberstein and Myler2011) and Saxena et al. (Reference Saxena, Lahav, Holland, Aggarwal, Anupama, Huang, Volpin, Myler and Zilberstein2007) are the only time-course studies of Leishmania promastigote to amastigote differentiation that employ high-throughput transcriptome and proteomic analyses. Here we describe a reanalysis of the data generated by these studies that takes advantage of the latest bioinformatics and gene ontology tools. This reanalysis expands our understanding of three features of Leishmania differentiation in particular: energy metabolism, translation and signal transduction.
GENE ONTOLOGY ANALYSIS OF PROTEINS EXPRESSED DURING L. DONOVANI DIFFERENTIATION
iTRAQ analyses performed by Rosenzweig et al. (Reference Rosenzweig, Smith, Opperdoes, Stern, Olafson and Zilberstein2008b) detected changes in abundance of 1712 proteins at seven time points of differentiation sampled. Manual Gene Ontology (GO) analysis carried out at that time focused on metabolism and a few aspects of gene expression. We reanalyzed the data using current bioinformatics tools and Gene Ontology data available in TriTryp DB (http://tritrypdb.org/tritrypdb/), focusing on 973 proteins that had less than three missing experimental values. Protein abundance values, expressed as the log2 fold-change in abundance in comparison to promastigotes, are summarized in the supplementary tables of Rosenzweig et al. (Reference Rosenzweig, Smith, Opperdoes, Stern, Olafson and Zilberstein2008b). The matrix of abundance values of all 973 proteins at the seven different time points was clustered using a hierarchical clustering algorithm with complete linkage (see Supplementary Table 1 – see Cambridge Journals On-Line, Parasitology). The Euclidean distance was used as a distance metric. The resulting dendrogram was cut at a height that generated reasonable clusters after visual inspection. All the statistical calculations were performed in R (http://www.R-project.org).
The four resulting clusters were subjected to a Gene Ontology (GO) enrichment analysis using the BiNGO (Maere et al. Reference Maere, Heymans and Kuiper2005) Cytoscape plugin with the Benjamini-Hochberg false discovery rate correction for multiple testing (all the P values quoted in the text are adjusted P values). To detect terms specifically enriched in each cluster, as opposed to terms generically enriched in all the 1712 proteins detected by iTRAQ, each cluster was analyzed separately with the complete dataset of 1712 proteins serving as the background. GO annotations for the Leishmania proteome were downloaded from TriTrypDB (Aslett et al. Reference Aslet, Aurrecoechea, Berriman, Brestelli, Brunk, Carrington, Depledge, Fischer, Gajria, Gao, Gardner, Gingle, Grant, Harb, Heiges, Hertz-Fowler, Houston, Innamorato, Iodice, Kissinger, Kraemer, Li, Logan, Miller, Mitra, Myler, Nayak, Pennington, Phan, Pinney, Ramasamy, Rogers, Roos, Ross, Sivam, Smith, Srinivasamoorthy, Stoeckert, Subramanian, Thibodeau, Tivey, Treatman, Velarde and Wang2010).
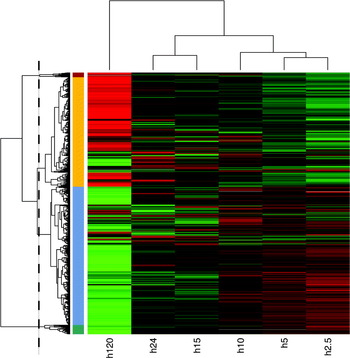
A heatmap was generated to illustrate the results of the cluster analysis, with red representing positive values and green negative ones (Fig. 2). The coloured strips on the side of the dendrogram denote the four clusters identified when the tree was cut at the height corresponding to the dashed line. As expected, data sets from the differentiation early time points (2.5 and 5 h) are more closely related and therefore these time points group together. Two clusters contain proteins up-regulated in amastigotes and the other two encompass down-regulated proteins. The red and green clusters are the smallest ones and contain proteins that displayed a more extreme abundance up- or down-regulation in amastigotes. In agreement with Rosenzweig et al. (Reference Rosenzweig, Smith, Opperdoes, Stern, Olafson and Zilberstein2008b), the average abundance values of each cluster are similar up until 10 h, after which the values start to diverge.
Heatmap depicting the hierarchical clustering of protein abundance values. Each value is the log2 fold-change in abundance in comparison to promastigotes. The analysis includes 973 proteins assayed at 6 different time points. Negative values are in shades of green, while positive values are in red. After visual inspection the dendrogram was cut at the height indicated by the dashed line. The four resulting clusters are highlighted with colour strips on the side of the dendrogram (red, yellow, blue and green).

The blue cluster (cluster 3) that contains 515 proteins down-regulated in amastigotes is strongly enriched in ribosomal proteins (Supplementary Fig. 1 – see Cambridge Journals On-Line, Parasitology; GO term: “structural constituent of ribosome”, P value <5e-15). This cluster contains 73 of the 90 ribosomal proteins that were also analyzed by Rosenzweig et al. (Reference Rosenzweig, Smith, Opperdoes, Stern, Olafson and Zilberstein2008b). This observation accords with the strong decrease in protein synthesis in differentiation phases II and III that followed a 3-fold increase in the rate of protein synthesis in phases I and II (Lahav et al. Reference Lahav, Sivam, Volpin, Ronen, Tsigankov, Green, Holland, Kuzyk, Borchers, Zilberstein and Myler2011).
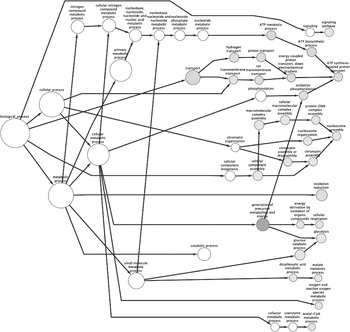
The yellow cluster (cluster 4) contains 407 proteins up-regulated in amastigotes (Fig. 2). As shown in Fig. 3, this cluster comprises several oxidoreductase enzymes associated with various metabolic pathways (GO term: “oxidation reduction”, P value <5e-3). Specifically, the pathways involved include: the TCA cycle (malate dehydrogenase, succinate dehydrogenase, isocitrate dehydrogenase); response to oxidative stress (trypanothione reductase, iron superoxide dismutase); glycosomal glycolytic enzymes (fructose-1.6-bisphosphate aldolase, glucose-6-phosphate isomerase, triosephosphate isomerase, 6-phospho-1-fructokinase, glyceraldehyde 3-phosphate dehydrogenase); fatty acid synthesis (enoyl-[acyl-carrier-protein] reductase); and steroid biosynthesis (HMGR 3-hydroxy-3-methylglutaryl-CoA reductase, squalene monooxygenase, C-5 sterol desaturase). In addition, this cluster is enriched with proteins associated with mitochondrial respiration and oxidative phosphorylation (GO term: “oxidative phosphorylation”, P value <5e-3). Furthermore, the cluster contains several ATP synthase subunits as well as components of the electron transport chain (GO term: “electron carrier activity”, P value <1e-3).
GO term enrichment analysis for cluster 4 (yellow, in Fig. 2). The figure refers only to the “Biological Process” branch of the GO hierarchy. Enriched nodes are coloured, with darker grey, indicating higher statistical significance. The size of the node is proportional to the number of proteins having the corresponding GO term. Several intermediate nodes have been omitted for clarity.

Inhibiting steroid synthesis has been observed to induce prominent alterations in the Leishmania mitochondrial membrane associated with loss of its energy-transducing properties (Rodrigues et al. Reference Rodrigues, Bernardes, Visbal, Urbina, Vercesi and de Souza2007). Based on this observation, and in agreement with previous studies, inhibitors of this pathway have been proposed as chemotherapies (Berman et al. Reference Berman, Holz and Beach1984, Reference Berman, Goad, Beach and Holz1986; Urbina, Reference Urbina1997; Lorente et al. Reference Lorente, Rodrigues, Jimenez Jimenez, Joyce-Menekse, Rodrigues, Croft, Yardley, de Luca-Fradley, Ruiz-Perez, Urbina, de Souza, Gonzalez Pacanowska and Gilbert2004; Cammerer et al. Reference Cammerer, Jimenez, Jones, Gros, Lorente, Rodrigues, Rodrigues, Caldera, Ruiz Perez, da Souza, Kaiser, Brun, Urbina, Gonzalez Pacanowska and Gilbert2007). The observation that enzymes involved in steroid synthesis are up-regulated during differentiation could contribute to the increased mitochondrial activity in amastigotes, as indicated in this section and by (Rosenzweig et al. Reference Rosenzweig, Smith, Opperdoes, Stern, Olafson and Zilberstein2008b).
The abundance of histones up-regulates in amastigotes (GO term: “nucleosome”, P value <5e-3), all histones detected in iTRAQ analysis are in either cluster 2 or 4 (red or yellow). GO enrichment analysis of the proteins in clusters 1 and 2 (green and red) did not reach significance, as these clusters are too small (34 and 17 proteins, respectively). Nevertheless, cluster 1 (green), containing the most down regulated proteins, comprises four ribosomal proteins and arginyl tRNA synthetase, which corroborates further the decreased translational activity we evidenced previously in amastigotes. The red cluster contains enzymes involved in beta-oxidation (long chain fatty Acyl-CoA synthetase, 3.2-trans-enoyl-CoA isomerase, Acyl-CoA dehydrogenase).
In summary, and in agreement with in vivo studies, these results indicate that as Leishmania undergoes transition from promastigotes to amastigotes, protein synthesis decreases while several catabolic pathways (TCA cycle, β-oxidation) are induced (Mottram and Coombs, Reference Mottram and Coombs1985; Lahav et al. Reference Lahav, Sivam, Volpin, Ronen, Tsigankov, Green, Holland, Kuzyk, Borchers, Zilberstein and Myler2011). The latter suggest an increase of mitochondrial oxidative phosphorylation activity. In addition, proteins involved in the response to oxidative stress are up-regulated, including superoxide dismutase and trypanothione reductase. The latter is essential for viability and specific to trypanosomatids and therefore represents a promising target for drug development (Tovar et al. Reference Tovar, Wilkinson, Mottram and Fairlamb1998), especially since this enzyme is inhibited by antimonial drugs (Wyllie et al. Reference Wyllie, Cunningham and Fairlamb2004). We suspect that these particular proteins are up-regulated in amastigotes to deal with the oxidative stress in macrophages and developmentally increased mitochondrial activity.
ENERGY METABOLISM
Promastigotes live in the sugar- and amino acid-rich guts of sand flies, whereas amastigotes reside inside macrophage phagolysosomes where sugars are scarce. Therefore it is not surprising that major biochemical differences between Leishmania promastigotes and amastigotes have been documented over the years. Briefly, procyclic promastigotes seem to prefer proline, while metacyclics exhibit sugar-dependent catabolism (Mukkada et al. Reference Mukkada, Schaefer, Simon and Neu1974). In amastigotes, on the other hand, fatty acid oxidation serves as the major source of energy, enabled by higher TCA enzyme activities (Hart and Coombs, Reference Hart and Coombs1982; Fig. 2 in Mottram and Coombs, Reference Mottram and Coombs1985). Both L. mexicana and L. major intracellular amastigotes exhibit elevated amino acid oxidation activities, for example, glutamate dehydrogenase activity is increased (Mottram and Coombs, Reference Mottram and Coombs1985). Furthermore gluconeogenesis is a key source of glucose for intracellular amastigotes, as deleting the gene encoding fructose 1,6 bis phosphatase resulted in intracellular amastigotes that were unable to replicate (Naderer et al. Reference Naderer, Ellis, Sernee, De Souza, Curtis, Handman and McConville2006). Nevertheless, L. major amastigotes are capable of using amino sugars such as N-acetyl glucosamine and glucosamine as sources of carbon and energy and contain the key enzymes required to convert them to fructose 6 phosphate (Naderer et al. Reference Naderer, Heng and McConville2010).
Comparative iTRAQ analysis of axenic L. donovani promastigotes and amastigotes confirmed the changes in metabolism established by the aforementioned in vivo studies, in particular that the abundance of key glycolytic enzymes is down-regulated in amastigotes while the abundance of gluconeogenesis enzymes is increased. Axenic amastigotes synthesized more TCA, respiration and oxidative phosphorylation enzymes as well as enzymes associated with fatty acid and amino acid oxidation. Recent quantitative proteomic analyses performed using host-derived amastigotes have corroborated these changes in metabolic activities (Paape et al. Reference Paape, Lippuner, Schmid, Ackermann, Barrios-Llerena, Zimny-Arndt, Brinkmann, Arndt, Pleissner, Jungblut and Aebischer2008, Reference Paape, Barrios-Llerena, Le Bihan, Mackay and Aebischer2010). Taken together, the data support the idea that at the metabolic level, the axenic differentiation system mirrors quite accurately the development of amastigotes inside host phagolysosomes.
As mentioned above, a unique advantage of the axenic system is the ability to dissect changes in gene expression, protein abundance and enzymatic activities along the time-course of differentiation. Rosenzweig et al. carried out the first high-throughput quantitative iTRAQ analysis over time (Rosenzweig et al. Reference Rosenzweig, Smith, Myler, Olafson and Zilberstein2008a, Reference Rosenzweig, Smith, Opperdoes, Stern, Olafson and Zilbersteinb). They discovered that parasites switch from promastigote to amastigote metabolism at phase III, around the time they undergo morphological change. Their iTRAQ data clearly indicated coordinated changes in the abundance of key enzymes in several pathways. For example, three cytosolic glycolytic enzymes namely phosphoglycerate mutase, enolase and pyruvate kinase, were significantly down-regulated (∼2-fold on average) in amastigotes from 10 h after differentiation was initiated. In parallel, gluconeogenesis enzymes were coordinately up-regulated with similar kinetics. Notably, no change was detected in the abundance of glycolytic enzymes inside glycosomes, which are not part of the gluconeogenesis pathway. Rosenzweig et al. (Reference Rosenzweig, Smith, Myler, Olafson and Zilberstein2008a, Reference Rosenzweig, Smith, Opperdoes, Stern, Olafson and Zilbersteinb) speculated that glycerol produced by several lipases whose abundance up-regulates during differentiation is utilized for gluconeogenesis, bypassing cytosolic gluconeogenic enzymes. Abundance up-regulation was observed for enzymes of β-oxidation, branched amino acid oxidation, respiration and oxidative phosphorylation.
Down-regulation of glycolysis on the one hand and the necessity to synthesize glucose on the other hand raised the question, what alternative pathways do amastigotes use to supply gluconeogenesis with carbon? The abundance of β oxidation enzymes was increased during differentiation, but this is not likely to represent the carbon source as Leishmania lack the glyoxylate pathway (Opperdoes and Coombs, Reference Opperdoes and Coombs2007). A potential carbon source is phospholipids, as their breakdown releases fatty acids and glycerol. In line with this possibility, iTRAQ analysis detected a significant increase in the abundance of phospholipases that paralleled increased abundance of glycerol kinase and glycerol 3 phosphate dehydrogenase. Therefore, we surmise that phosphorylation of glycerol to form glycerol 3 phosphate (by glycerol kinase) followed by oxidation of this precursor to form dihydroxy acetone phosphate (by glycerol 3 phosphate dehydrogenase) feeds gluconeogenesis with carbon in amastigotes. An additional carbon source could be branched amino acids, mostly leucine (Ginger et al. Reference Ginger, Chance and Goad1999), the oxidation of which was observed to increase in amastigotes (Mottram and Coombs, Reference Mottram and Coombs1985; Rosenzweig et al. Reference Rosenzweig, Smith, Opperdoes, Stern, Olafson and Zilberstein2008b). In accord with phospholipids and/or branched amino acids serving as carbon sources, axenic amastigotes are able to proliferate in an amino acid-based medium with almost no glucose (Sevillya et al. personal communication). In summary, differentiation involves coordinated changes in the abundance of enzymes in specific pathways. The current challenge is to validate the dynamics of these metabolic changes in vivo. To this end, the authors' group is attempting to develop a system that allows parasites within host phagolysosomes to be monitored over time.
A striking feature of the axenic system is that the changes in metabolism occur even though the parasites are incubated in the same medium throughout differentiation. Specifically, even though the glucose and amino acid concentrations are relatively high (5 and 0·25 mM, respectively), differentiating parasites shift from glucose to fatty and amino acid oxidation and from glycolysis to gluconeogenesis. These observations suggest that once differentiation is activated by an external signal (i.e. pH 5.5 and 37°C), parasites undergo a preset gene expression programme that prepares them for life inside phagolysosomes. This is a puzzling finding as several studies have indicated that axenic parasites, especially promastigotes, that have been passaged for a long time in culture lose virulence, suggesting that they must physically pass through the mammalian host to retain virulence (Pescher et al. Reference Pescher, Blisnick, Bastin and Spath2011). Yet, long-term axenic parasites retain an ability to adapt metabolically to the phagolysosome environment, even though they have not physically experienced this compartment for a very long time. We surmise that the host-specific signals activating virulence and differentiation are different. The differentiation signal has been identified and therefore we are able to simulate differentiation in vitro. However, the host molecule(s) that induce parasite virulence is/are yet to be discovered.
TRANSLATION
As noted above, iTRAQ detected dramatic and coordinated decreases in the abundance of parasite translation machinery proteins, including ribosomal proteins, tRNA synthases and translation factors (Rosenzweig et al. Reference Rosenzweig, Smith, Opperdoes, Stern, Olafson and Zilberstein2008b). This 2–4-fold decrease started in phase III, around 10 h after promastigotes were exposed to the differentiation signal. A concomitant decrease in translational activity is corroborated by the reported reduction in the size of polysomes around 15 h (see Fig. 4 in Lahav et al. Reference Lahav, Sivam, Volpin, Ronen, Tsigankov, Green, Holland, Kuzyk, Borchers, Zilberstein and Myler2011). The extent of regulatory coordination strongly supports the existence of a genetically programmed mechanism that is activated at some point after the start of differentiation. Since changes in protein abundance correlate with changes in mRNA levels for all translation machinery genes, the regulation appears to be primarily at the RNA level. It is likely that coordinated degradation of mRNA and proteins underlies reduced translation; a precise mechanism is still to be identified.
Logically, the coordinated decrease in the abundance of translation machinery proteins and observed reduced translational activity must mean that amastigotes are less active than promastigotes. In line with this, amastigotes grow, transport solutes (Saar et al. Reference Saar, Ransford, Waldman, Mazareb, Amin-Spector, Plumblee, Turco and Zilberstein1998; Mazareb et al. Reference Mazareb, Fu and Zilberstein1999) and consume energy at slower rates than promastigotes (Mukkada et al. Reference Mukkada, Meade, Glaser and Bonventre1985). However, as mentioned earlier, the abundance of certain metabolic pathway proteins increases in amastigotes (Mottram and Coombs, Reference Mottram and Coombs1985; Rosenzweig et al. Reference Rosenzweig, Smith, Opperdoes, Stern, Olafson and Zilberstein2008b; Paape et al. Reference Paape, Barrios-Llerena, Le Bihan, Mackay and Aebischer2010). This apparent contradiction is resolved when one considers more closely the dynamics of general translation activity during differentiation (Lahav et al. Reference Lahav, Sivam, Volpin, Ronen, Tsigankov, Green, Holland, Kuzyk, Borchers, Zilberstein and Myler2011). After promastigotes were shifted into differentiation conditions, within less than 3 h a rapid 3-fold increase in the protein synthesis rate was observed that paralleled a similar increase in total cell protein (Lahav et al. Reference Lahav, Sivam, Volpin, Ronen, Tsigankov, Green, Holland, Kuzyk, Borchers, Zilberstein and Myler2011). This transient boost in translational activity was followed by an exponential decrease, until the translational activity and total cell protein level returned to values characteristic of promastigotes. Notably, the cell volume changed in parallel, with a sharp increase early on after differentiation was initiated followed by a return to the cell volume characteristic of promastigotes (Lahav et al. Reference Lahav, Sivam, Volpin, Ronen, Tsigankov, Green, Holland, Kuzyk, Borchers, Zilberstein and Myler2011; Rosenzweig et al. unpublished observations). The various results can be integrated in the following model. The temperature increase of more than 10 degrees when promastigotes are shifted into differentiation conditions triggers a rapid increase in the rate of protein synthesis. This causes a rapid accumulation of proteins, which the cell attempts to compensate by increasing in volume. Nevertheless, the cell reduces the protein load further by suppressing protein synthesis and promoting degradation of unused proteins. Ultimately, as differentiation proceeds, the protein over load is cleared and only the proteins relevant to amastigote growth are synthesized.
The premise that the differentiating parasite experiences an ‘over load’ of proteins is supported by the discovery that the heat contribution to initiating differentiation can be replaced with reagents that induce protein misfolding (Barak et al. Reference Barak, Amin-Spector, Gerliak, Goyard, Holland and Zilberstein2005). High temperatures are known to affect protein folding and trigger the heat shock response. It was found that exposing promastigotes to heat alone (37 °C) induced a growth arrest that was alleviated only by reducing the pH to 5.5 or less (Zilberstein et al. Reference Zilberstein, Blumenfeld, Liveanu, Gepstein and Jaffe1991; Barak et al. Reference Barak, Amin-Spector, Gerliak, Goyard, Holland and Zilberstein2005). In contrast, exposing promastigotes to pH 5.5 without heat did not affect growth or protein synthesis, likely due to the strong pH homeostasis mechanisms parasites employ to regulate intracellular pH (Glaser et al. Reference Glaser, Baatz, Kreishman and Mukkada1988; Zilberstein et al. Reference Zilberstein, Philosoph and Gepstein1989; Alcolea et al. Reference Alcolea, Alonso, Gomez, Sanchez-Gorostiaga, Moreno-Paz, Gonzalez-Pastor, Torano, Parro and Larraga2010). Taken together, these data confirm that the differentiation signal comprises two necessary components (i.e. pH 5.5 and 37°C), with the heat component impacting translational activity.
Upon shifting to lysosome-like conditions (i.e. pH 5.5 and 37°C) parasites undergo a transient G1 arrest within 3 h that coincides with the peak of protein accumulation. One of the key regulators of translation under stress-like conditions is the α subunit of the eukaryote translation initiation factor 2 (eIF2α) (Zhan et al. Reference Zhan, Vattem, Bauer, Dever, Chen and Wek2002). Indeed, in line with the model described above, this protein is known to play a major role in the cellular responses to unfolded and misfolded proteins in higher eukaryotes (Schroder and Kaufman, Reference Schroder and Kaufman2005). Accordingly, it was observed that phosphorylation of this protein gradually increases, reaching almost 4-fold during the second phase of differentiation at a time when methionine incorporation decreases and the size of L. donovani polysomes decreases from 6 to 2 per mRNA (Lahav et al. Reference Lahav, Sivam, Volpin, Ronen, Tsigankov, Green, Holland, Kuzyk, Borchers, Zilberstein and Myler2011). The importance of eIF2α phosphorylation in enabling differentiation to continue was validated in vivo when cells unable to phosphorylate this protein were observed to stall during differentiation (Chow et al. Reference Chow, Cloutier, Dumas, Chou and Papadopoulou2011). Hence, attenuation of protein synthesis during differentiation is necessary and according to the model described above, helps reduce the protein over load so that amastigotes can resume metabolic and other cellular activities.
It is worth noting that iTRAQ phosphoproteomic analyses highlighted a feature of eIF2α phosphorylation unique to trypanosomes, namely that it occurs on a threonine. In higher eukaryotes, it is well documented that eIF2α phosphorylation occurs at a highly conserved serine 51 that is surrounded by a conserved box (Zhan et al. Reference Zhan, Vattem, Bauer, Dever, Chen and Wek2002). Situated at position 166 in Leishmania and 169 in T. brucei (Moraes et al. Reference Moraes, Jesus, Hashimoto, Dey, Schwartz, Alves, Avila, Bangs, Dever, Schenkman and Castilho2007; Lahav et al. Reference Lahav, Sivam, Volpin, Ronen, Tsigankov, Green, Holland, Kuzyk, Borchers, Zilberstein and Myler2011), the threonine phosphorylated in eIF2α is surrounded by a box very similar to the one that appears in higher eukaryotes (Gosline et al. Reference Gosline, Nascimento, McCall, Zilberstein, Thomas, Matlashewski and Hallett2011). Phylogenetic analyses indicate that Leishmania (as well as the other trypanosomatids) probably encode the most ancient eIF2α. This raises the question whether the threonine versus serine phosphorylation event serves the same biological role in trypanosomatids and higher eukaryotes, respectively. Notably, the signaling pathway that senses protein misfolding within the endoplasmic reticulum attenuates translation via eIF2α phosphorylation, but this unfolded protein response (UPR) is transcriptionally regulated in higher eukaryotes and translationally regulated in Leishmania (as well as all other trypanosomatids) (Gosline et al. Reference Gosline, Nascimento, McCall, Zilberstein, Thomas, Matlashewski and Hallett2011). More generally, phosphoproteomic analyses have revealed that a switch in the conserved phosphorylation residue occurs at a few other conserved phosphorylation sites in trypanosomatids (Tsigankov et al. unpublished observation). The possible biological significance of this switching phenomenon requires further study.
SIGNALING PATHWAYS
Axenic differentiation of Leishmania represents an opportunity to uncover parasite-specific pathways. In response to the trigger (i.e. pH 5.5 and 37°C), unknown signaling pathways induce a cascade of morphological and biochemical changes that mediate differentiation.
In general, trypanosomatid parasites use calcium signaling (Fernandes et al. Reference Fernandes, Neira, Ferreira and Mortara2006) mediated by adenylate cyclases and phosphodiesterases that share limited similarity with host homologues. Indeed, trypanosome adenylate cyclases are not coupled to G-proteins and have only a single trans-membrane domain. Moreover, trypanosome phosphodiesterases are not affected by any of the inhibitors active in mammalian cells, implying that the active site in trypanosome and host phosphodiesterases are not the same (Laxman and Beavo, Reference Laxman and Beavo2007). Although trimeric G-proteins are missing from the trypanosome genome, over 40 small GTPases are encoded by the T. brucei genome and likely play roles in signal transduction. A comparison of the small GTPase superfamily and associated GAPs and GEFs between trypanosomes and other species indicates an apparent decrease in representation of Ras- and Rho-like subfamilies within trypanosomes, but a preservation of Rab and Arf subfamily representation. Overall, various atypical and prokaryote-related GTPases are encoded in trypanosome genomes, but many GTPases are conserved among eukaryotes (Field, Reference Field2005; Field and O'Reilly, Reference Field and O'Reilly2008). In addition, a recent study indicated that calcium influx and calcineurin activity are necessary for Leishmania thermotolerance, amastigote proliferation and lesion formation (Naderer et al. Reference Naderer, Dandash and McConville2011).
The Leishmania ‘kinome’ comprises 199 typical and atypical putative kinases that constitute ∼2% of the entire genome. None of these are annotated as tyrosine kinases, although genes encoding putative dual-specificity kinases have been described (see below). Of note, only a very small number of these protein kinases appear to have trans-membrane domains, suggesting that receptor kinases are rare in Leishmania (Parsons et al. Reference Parsons, Worthey, Ward and Mottram2005). Of the 199 predicted kinases, proteomics has detected expression of a handful, some of which participate in metabolism and others that have the potential to be involved in the programmed process of differentiation (Rosenzweig et al. Reference Rosenzweig, Smith, Opperdoes, Stern, Olafson and Zilberstein2008b).
MAPKs (mitogen-activated protein kinases) are the most extensively studied group of protein kinases, likely to play regulatory roles in Leishmania differentiation. MAPK cascades, consisting of three core components, are highly conserved among all eukaryotes. MAP kinase kinase kinase (MAPKKK) phosphorylates and activates a dual-specificity MAP kinase kinase (MAPKK), which in turn specifically activates a MAP kinase (MAPK) by phosphorylating threonine and tyrosine residues located in a conserved TXY motif in the MAPK activation loop (Waskiewicz and Cooper, Reference Waskiewicz and Cooper1995; John von Freyend et al. Reference John von Freyend, Rosenqvist, Fink, Melzer, Clos, Jensen and Wiese2010). Leishmania genomes contain 23 putative MAPKKKs and 7 MAPKK homologues. Additionally, Leishmania genomes encode 17 different proteins that have been annotated as putative MAPKs or MAPK-like kinases based on homology and the presence of 12 conserved sub-domains, one of which (sub-domain VIII) contains the characteristic TXY motif in an activation loop (Wiese et al. Reference Wiese, Wang and Gorcke2003b; Parsons et al. Reference Parsons, Worthey, Ward and Mottram2005). The existence of such a motif strongly supports that the identified dual specificity kinases could be the MAPKK that mediate activation of MAPKs. However, it remains possible that there are tyrosine kinases in the genome that vary greatly from tyrosine kinases of other species and so have escaped bioinformatic identification.
Two of the putative Leishmania MAPKs (MAPK4 and MAPK7) appear to be essential, as null mutants could not be obtained (Morales et al. Reference Morales, Renaud, Faigle, Shorte and Spath2007). Although MAPK4 is essential for both promastigotes and amastigotes (Wang et al. Reference Wang, Melzer, Kruse, Sander-Juelch and Wiese2005), the null mutant of its homologue in T. brucei (TbMAPK2) underwent cell cycle arrest when differentiating into the procyclic form (Muller et al. Reference Muller, Domenicali-Pfister, Roditi and Vassella2002). Conversely, over expression of MAPK7 attenuated Leishmania virulence due to a reversible, non-synchronous growth arrest concomitant with reduced de novo protein synthesis in amastigotes (Morales et al. Reference Morales, Renaud, Faigle, Shorte and Spath2007). These observations raise the possibility that MAPKs 4 and 7 are involved in differentiation in Leishmania. Indeed, stage specificity in either protein expression (MAPK3 and MAPK9) or kinase activity (MAPK4, MAPK7 and MAP10) has been evidenced (Bengs et al. Reference Bengs, Scholz, Kuhn and Wiese2005; Erdmann et al. Reference Erdmann, Scholz, Melzer, Schmetz and Wiese2006; Morales et al. Reference Morales, Renaud, Faigle, Shorte and Spath2007) supporting an involvement for MAPKs 4 and 7 in differentiation and hinting at roles for MAPKs 3, 9 and 10. This notwithstanding, MAPK2, MAPK3 and MAPK9 were shown to be responsible for flagellar morphogenesis and cell morphology (Wiese et al. Reference Wiese, Kuhn and Grunfelder2003a; Bengs et al. Reference Bengs, Scholz, Kuhn and Wiese2005; Erdmann et al. Reference Erdmann, Scholz, Melzer, Schmetz and Wiese2006; Wiese, Reference Wiese2007). With regards to the other MAPKs, to date there is little evidence to support any participation in differentiation. Leishmania MAPK1 appears to be essential specifically for intracellular survival and amastigote cell division (Wiese, Reference Wiese1998) and MAPK2 is required for establishing infection (Wiese, Reference Wiese2007).
Two cascade relationships have been identified in Leishmania between a MAPK and MAPKK, each of which could potentially influence differentiation. The first one involves LmxMKK (MAPKK, accession AJ243118) and MAPK3. Null mutant parasites of these genes exhibit shortened flagella. Erdmann et al. showed in vitro and in vivo that LmxMKK can phosphorylate and activate MAPK3. Additionally, it was found that MAPK3 is able to phosphorylate LmxMKK, indicating a possible feedback regulation of this cascade (Erdmann et al. Reference Erdmann, Scholz, Melzer, Schmetz and Wiese2006). The second relationship is between the essential MAPK4 and MAPKK5, a STE7-like protein kinase. It was shown that MAPKK5 phosphorylates MAPK4 on threonine 190 and tyrosine 192 of the characteristic TXY motif, activating MAPK4 (John von Freyend et al. Reference John von Freyend, Rosenqvist, Fink, Melzer, Clos, Jensen and Wiese2010).
iTRAQ proteomic time-course analysis has detected changes in the abundance of 3 MAPKs. The first, MAPK5, appears to be 2-fold more abundant in amastigotes as compared to promastigotes. The second, MAPK11 does not change in abundance during phases I and II and was not detected in phases III and IV. Finally, the third is a putative MAPK (LinJ.24.2410), the abundance of which increases slightly during phases I and II and then decreases, such that it is 2-fold less abundant in amastigotes than in promastigotes (Rosenzweig et al. Reference Rosenzweig, Smith, Opperdoes, Stern, Olafson and Zilberstein2008b). Studies examining phosphorylation events have evidenced, using a 2-D gel approach, that the L. major homologue of MAPK10 is phosphorylated in a stage-specific manner, primarily in amastigotes, (Morales et al. Reference Morales, Watanabe, Laurent, Lenormand, Rousselle, Namane and Spath2008). In addition, a MAPK1 homologue was reported to be phosphorylated in axenic L. donovani amastigotes in LC-ESI-MS/MS experiments after phosphoprotein enrichment (Hem et al. Reference Hem, Gherardini, Osorio y Fortea, Hourdel, Morales, Watanabe, Pescher, Kuzyk, Smith, Borchers, Zilberstein, Helmer-Citterich, Namane and Spath2010). The rather small number of MAPKs detected in these proteomic screens is not surprising, since signaling proteins are expected to be expressed at low levels.
In summary, the axenic differentiation system has facilitated insight into signal perception during promastigote to amastigote differentiation (Barak et al. Reference Barak, Amin-Spector, Gerliak, Goyard, Holland and Zilberstein2005; Zilberstein and Shapira, Reference Zilberstein and Shapira1994) as well as better understanding of physiological and metabolic changes that drive amastigote maturation (Rosenzweig et al. Reference Rosenzweig, Smith, Opperdoes, Stern, Olafson and Zilberstein2008b). Nevertheless, the sensory molecules and signaling pathways that transduce the environmental signal and mediate the transition from non-infectious promastigotes to pathogenic amastigotes remain to be characterized.
CONCLUSIONS
Given all of the data described in this review, it is clear that differentiating from promastigotes into amastigotes is a genetically programmed, highly regulated process in Leishmania. Differentiation signals activate pathways that induce a plethora of metabolic and physiological changes, which together enable fast adaptation to the upcoming host or vector environments. In vitro the signal to differentiate can be simulated by concomitant exposure to pH 5.5 and 37°C, the discovery of which allowed development of axenic cultures. Whereas the signal that initiates Leishmania differentiation has been discovered, we are still searching for signals that induce virulence. We suspect that these signaling molecules are localized inside the host as parasites lose virulence when grown in axenic culture (Pescher et al. Reference Pescher, Blisnick, Bastin and Spath2011). Once the virulence signal(s) is/are found and applied in the axenic culture system, we will be able to dissect this clinically important aspect of Leishmania development.
ACKNOWLEDGEMENTS
We thank Dr. Tanya Gottlieb for editing this manuscript. We thank Ilona Darlyuk for providing us with SEM generated pictures of L. donovani axenic promastigotes and amastigote, used in Fig. 1.
FINANCIAL SUPPORT
This work was supported by the 7th Framework Programme of the European Commission through a grant to the LEISHDRUG programme (project number 223414).