


1 Introduction
Over many years, considerable research effort has been directed to examining the nature of fluid–structure interaction (FSI). This is due to its practical importance to many fields where coupled interactions between a fluid flow and solid-body motion can occur. One of the most crucial phenomena associated with FSI is flow-induced vibration (FIV), which is the oscillatory response of a coupled fluid–structure system due to fluid forcing. Vortex-induced vibration, or VIV, is a category of FIV, occurring through the synchronization of structural vibration with wake unsteadiness, typically vortex shedding. Fatigue damage, or even catastrophic structural failure, can result from FIV. Thus, for structural design, it is always important to consider such possible resonant interactions. Aircraft, marine vessels, submarines, ground vehicles, chimneys and bridges are good examples of relevant engineering systems. Fundamental understanding of VIV has been revealed through experimental and numerical research studies for generically shaped bodies, with major findings summarized in, e.g., Parkinson (Reference Parkinson1989), Sarpkaya (Reference Sarpkaya2004), Williamson & Govardhan (Reference Williamson and Govardhan2004, Reference Williamson and Govardhan2008) and Wu, Ge & Hong (Reference Wu, Ge and Hong2012). While most research conducted has been based on cylindrical structures, especially circular cylinders, numerous applications involve three-dimensional body shapes, including spherical bodies.
Key features of VIV of a sphere were revealed through experiments by Williamson & Govardhan (Reference Williamson and Govardhan1997). They found that a tethered sphere oscillates strongly at a transverse saturation amplitude of close to two diameters peak to peak. In line with previous studies of VIV of a circular cylinder, they recognized that plotting the amplitude response versus the reduced velocity,
 $U^{\ast }=U/f_{n}D$
, where
 $U$
is the free-stream velocity,
 $f_{n}$
is the natural frequency of the system and
 $D$
is the sphere diameter, was more suitable for interpreting and classifying the behaviour than using the amplitude response versus the Reynolds number. They observed that the transverse oscillation is dominant compared with the streamwise oscillation and that the streamwise oscillation frequency is twice that of the transverse oscillation. They also observed that there were two different modes of oscillation, namely modes I and II. Both two modes appeared within the reduced velocity range
 $U^{\ast }\sim 5$
–10, and the body oscillation frequency,
 $f$
, was close to the static body vortex shedding frequency,
 $f_{vo}$
(
 $f_{vo}/f\sim 1$
); this clearly indicated that these vibrations were induced from vortex shedding behind the sphere. However, there was no clear boundary between mode I and mode II in the amplitude response diagram of VIV of a sphere, contrary to the amplitude response of a cylinder, which has distinct initial, upper and lower branches. Later, the question of how mode II differed from mode I was answered by Govardhan & Williamson (Reference Govardhan and Williamson2005) by examining the vortex phase,
 $\unicode[STIX]{x1D719}_{vo}$
. The vortex phase is the phase difference between the vortex force on the sphere and the sphere displacement. They found that there was approximately a
 $90^{\circ }$
phase shift between modes I and II.
In addition to the first two modes of vibration observed with light spheres (
 $m^{\ast }<1$
, where
 $m^{\ast }$
is the density ratio between solid and fluid) by Williamson & Govardhan (Reference Williamson and Govardhan1997), Jauvtis, Govardhan & Williamson (Reference Jauvtis, Govardhan and Williamson2001) found that there existed another mode of vibration (mode III) which appeared within the reduced velocity range
 $U^{\ast }\sim 20$
–40 for heavy (tethered) spheres (
 $m^{\ast }\gg 1$
). For mode III vibration, it was found that the principal vortex shedding frequency was three to eight times higher than the sphere vibration frequency. Therefore, they stressed that this vibration phenomenon was difficult to explain by classical ‘lock-in’ theories. Later, Govardhan & Williamson (Reference Govardhan and Williamson2005) argued that, in the absence of any body vibration in mode III, there would be no fluid forcing at the natural frequency of the system. However, if the body were to be perturbed, it could generate a self-sustaining vortex force that could amplify, leading to body vibrations of large amplitudes. They categorized mode III as ‘movement-induced excitation’ (Naudascher & Rockwell Reference Naudascher and Rockwell2012). Jauvtis et al. (Reference Jauvtis, Govardhan and Williamson2001) also observed another mode of regular vibration, mode IV, as the reduced velocity was further increased to the range
 $U^{\ast }>100$
. In this mode, the sphere oscillation frequency was not regular and periodic as it was in the first three modes, but, interestingly, the main frequency component was very close to the natural frequency.
Govardhan & Williamson (Reference Govardhan and Williamson2005) used digital particle image velocimetry (DPIV) to observe the formation of a chain of hairpin-type vortex loops on both sides of the wake behind the sphere for both modes I and II. Furthermore, they observed a change in the timing of vortex shedding relative to body motion once it passed from mode I to II, consistent with their observation of a change of vortex phase between these modes. They identified that for a sphere undergoing VIV, there was a preferred orientation of the loops to maintain a symmetry with the plane containing the principal transverse vibrations. For mode III vibrations, they observed a two-sided chain of trailing vortex pairs locked to the body oscillation frequency. In related work, Brücker (Reference Brücker1999) investigated the nature of freely rising air bubbles in water. The bubbles showed spiralling, zigzagging and rocking motions during their rise in water according to the diameters of the bubbles. For a zigzagging bubble, an alternate oppositely oriented hairpin-type wake structure was observed, similar to the observation of Govardhan & Williamson (Reference Govardhan and Williamson2005) for mode I and II vibrations. For a spiralling bubble, a steady wake was observed, which wound in a helical path.
Pregnalato (Reference Pregnalato2003) numerically investigated the FIV of a tethered sphere at a Reynolds number of 500 for two mass ratios,
 $m^{\ast }=0.082$
and
 $m^{\ast }=0.8$
. He observed three modes of vibration, corresponding to the last three modes of vibration characterized by Jauvtis et al. (Reference Jauvtis, Govardhan and Williamson2001). In the study of Pregnalato (Reference Pregnalato2003), the sphere exhibited mode II vibration in the reduced velocity range
 $U^{\ast }=5$
–10, and mode III vibration for
 $U^{\ast }>10$
for both mass ratios. Mode II and III vibrations were highly sinusoidal, similarly to the experimental studies. He observed mode IV vibration with the higher mass ratio,
 $m^{\ast }=0.8$
, sphere. However, for the low mass ratio, mode IV was not observed, regardless of the reduced velocity. Recently, Lee, Hourigan & Thompson (Reference Lee, Hourigan and Thompson2013) studied VIV of a neutrally buoyant (
 $m^{\ast }=1$
) tethered sphere constrained to move on a spherical surface, which may be considered as locally planar for small vibration amplitudes relative to the tether length. This was a combined numerical and experimental study, covering the Reynolds number range
 $Re=50$
–12 000. They distinguished seven broad and relatively distinct sphere oscillation regimes and characteristic wake structures.
Behara, Borazjani & Sotiropoulos (Reference Behara, Borazjani and Sotiropoulos2011) investigated VIV of a sphere through numerical simulations. As distinct from the current study, the sphere was mounted on elastic supports, allowing movement in all three spatial directions, with the Reynolds number set to
 $Re=300$
, reduced mass
 $m_{r}=2$
, for the reduced velocity range
 $U^{\ast }=4$
–9. They observed two distinct branches of the response curve in the synchronization regime, each corresponding to a distinct type of wake structure, identified as hairpin and spiral vortices. The oscillation amplitude was lower in the hairpin branch compared with the spiral branch. When the wake was in the hairpin shedding mode, the sphere moved along a linear path in the transverse plane, while when spiral vortices were being shed, the sphere vibrated on a circular orbit. Furthermore, under VIV on the spiral mode branch, they observed hysteresis in the response amplitude at the beginning of the synchronization regime. More recently, Behara & Sotiropoulos (Reference Behara and Sotiropoulos2016) extended this numerical study by expanding the reduced velocity range to
 $U^{\ast }=0$
–13. They observed that the lock-in regime was
 $U^{\ast }=5.8$
–12.2 for the spiral mode and
 $U^{\ast }=4.8$
–8 for the hairpin mode. The hairpin mode was found to become unstable and merge with the response curve of the spiral mode at
 $U^{\ast }=9$
. They also studied the effect of Reynolds number on VIV at a fixed reduced velocity,
 $U^{\ast }=9$
. They found that the synchronized oscillation persisted up to
 $Re=1000$
, although the sphere trajectory and wake structures were strongly dependent on the Reynolds number. The spiral wake observed at
 $Re=300$
underwent a transition to a hairpin wake in the Reynolds number range
 $Re=500$
–600. During this transition, the sphere trajectories on the transverse plane changed from circular to elliptic orbits.
In many previous studies of a tethered sphere wake (Williamson & Govardhan Reference Williamson and Govardhan1997; Pregnalato Reference Pregnalato2003; Govardhan & Williamson Reference Govardhan and Williamson2005), researchers have observed that the transverse oscillation was of higher amplitude than the streamwise oscillation. Even though computational studies have been reported previously on VIV of a sphere allowed to move in all three spatial directions (Behara et al.
Reference Behara, Borazjani and Sotiropoulos2011; Behara & Sotiropoulos Reference Behara and Sotiropoulos2016), surprisingly little effort appears to have been directed towards simulating the reference case of VIV of a sphere free to move only in the transverse direction. Therefore, this is the case considered in the present study. To gain a better insight, two different Reynolds numbers were chosen for this investigation, namely
 $Re=300$
and 800. The Reynolds number of 300 was chosen because a static sphere experiences unsteady vortex shedding at
 $Re=300$
, and, in previous numerical studies, Behara et al. (Reference Behara, Borazjani and Sotiropoulos2011) and Behara & Sotiropoulos (Reference Behara and Sotiropoulos2016) observed large-amplitude vibrations at this Reynolds number. The Reynolds number of 800 was chosen since both a static and a tethered sphere show irregular vortex shedding at this Reynolds number (e.g. see Lee et al.
Reference Lee, Hourigan and Thompson2013). Moreover, simulations at
 $Re=800$
enable more relevant comparison with experimental studies conduced at higher Reynolds numbers. A mass ratio of
 $m^{\ast }=2.685$
was chosen for this study, which is equivalent to a reduced mass of
 $m_{r}=1.5$
. This is representative of the lower end of mass ratios that have been used for cylinder and sphere VIV experiments in water (e.g. Carberry, Sheridan & Rockwell Reference Carberry, Sheridan and Rockwell2001; Williamson & Govardhan Reference Williamson and Govardhan2004; Govardhan & Williamson Reference Govardhan and Williamson2005; Wong et al.
Reference Wong, Zhao, Lo Jacono, Thompson and Sheridan2017; Sareen et al.
Reference Sareen, Zhao, Lo Jacono, Sheridan, Hourigan and Thompson2018). Wide ranges of reduced velocity were considered to improve the understanding of FIV. In particular,
 $U^{\ast }=3.5$
–100 and 3–50 were chosen at
 $Re=300$
and 800 respectively. Finally, very long integration times were used to gain a better understanding of the asymptotic system response, as it was observed that some non-asymptotic states can be maintained for significant times and yet may eventually evolve to different final states.
The structure of the paper is organized as follows: the numerical methods used are presented in § 2; verification and validation of the numerical method and implementation are presented in § 3; the predicted FIVs of a sphere at
 $Re=300$
are discussed in § 4; effects of Reynolds number on FIV of a sphere are discussed in § 5 with results obtained at
 $Re=800$
, including comparisons with previous work; concluding remarks are made in § 6.
2 Numerical approach
The numerical method employed in this study is based on the open-source CFD package OpenFOAM. This package is capable of handling a wide range of flows. It also comes with a built-in dynamic mesh technique that enables the solution of FSI problems (as Ding, Bernitsas & Kim (Reference Ding, Bernitsas and Kim2013), Habchi et al. (Reference Habchi, Russeil, Bougeard, Harion, Lemenand, Ghanem, Valle and Peerhossaini2013) and Wu, Bernitsas & Maki (Reference Wu, Bernitsas and Maki2014) used in their studies). Dynamic mesh techniques are generally expensive since the mesh is deformed according to the solid-body motion during each time step. However, for VIV of a single body, the efficiency of solving the coupled fluid–solid system can be improved by choosing a non-deformable moving mesh, as adopted by Blackburn & Henderson (Reference Blackburn and Henderson1996), Leontini et al. (Reference Leontini, Stewart, Thompson and Hourigan2006a ), Leontini, Thompson & Hourigan (Reference Leontini, Thompson and Hourigan2006b ) and Leontini, Lo Jacono & Thompson (Reference Leontini, Lo Jacono and Thompson2013). Therefore, instead of using the built-in dynamic mesh technique, a new solver was developed to treat the coupled fluid–solid system with a non-deformable mesh. This approach is considerably more efficient than the dynamic mesh technique. The FSI system and the FSI solver are discussed in detail in the following two subsections.
2.1 Governing equations
Fluid flow was modelled in the moving reference frame attached to the centre of the sphere. This is a non-inertial frame since it accelerates according to the sphere motion. Thus, the fluid momentum equations need to be adjusted accordingly. This can be achieved by adding the acceleration of the sphere to the momentum equation on the right-hand side, acting as a fictitious force in the opposite direction. The fluid is assumed to be incompressible and viscous, while the motion of the sphere is assumed to behave as a spring–mass–damper system. The coupled fluid–solid system can be described by the Navier–Stokes equations, given by (2.1) and (2.2), together with the governing motion of the sphere, given by (2.3),
 $$\begin{eqnarray}\displaystyle & \displaystyle \frac{\unicode[STIX]{x2202}\boldsymbol{u}}{\unicode[STIX]{x2202}t}+(\boldsymbol{u}\boldsymbol{\cdot }\unicode[STIX]{x1D735})\boldsymbol{u}=-\frac{1}{\unicode[STIX]{x1D70C}}\unicode[STIX]{x1D735}p+\unicode[STIX]{x1D735}\boldsymbol{\cdot }(\unicode[STIX]{x1D708}\unicode[STIX]{x1D735}\boldsymbol{u})-\ddot{\boldsymbol{y}}_{\boldsymbol{s}}, & \displaystyle\end{eqnarray}$$
 $$\begin{eqnarray}\displaystyle & \displaystyle \unicode[STIX]{x1D735}\boldsymbol{\cdot }\boldsymbol{u}=0, & \displaystyle\end{eqnarray}$$
 $$\begin{eqnarray}\displaystyle & \displaystyle m\,\ddot{\boldsymbol{y}}_{\boldsymbol{s}}+c\,\dot{\boldsymbol{y}}_{\boldsymbol{s}}+k\,\boldsymbol{y}_{\boldsymbol{s}}=\boldsymbol{f}_{\boldsymbol{l}}. & \displaystyle\end{eqnarray}$$
Here,
 $\boldsymbol{u}=\boldsymbol{u}(x,y,z,t)$
is the velocity vector field in the moving frame,
 $p$
is the scalar pressure field,
 $\unicode[STIX]{x1D70C}$
is the fluid density,
 $\unicode[STIX]{x1D708}$
is the kinematic viscosity, and
 $\boldsymbol{y}_{\boldsymbol{s}}$
,
 $\dot{\boldsymbol{y}}_{\boldsymbol{s}}$
and
 $\ddot{\boldsymbol{y}}_{\boldsymbol{s}}$
are the sphere displacement, velocity and acceleration vectors respectively. In addition,
 $m$
is the mass of the sphere,
 $c$
is the damping constant,
 $k$
is the structural spring constant and
 $\boldsymbol{f}_{\boldsymbol{l}}$
is the flow-induced integrated vector force acting on the sphere due to pressure and viscous shear forces acting on the body surface.
2.2 The fluid–structure solver
A new fully coupled FSI solver (named vivicoFoam) was developed, based on the ‘icoFoam’ solver for laminar flows, to solve the coupled fluid–solid system defined by (2.1)–(2.3). This solver employs a predictor–corrector iterative method, which predicts the solid motion explicitly in the first iteration and then corrects it as necessary through several corrector iterations. Once an approximation to the solid motion is known (from the predictor or a previous corrector step), the Navier–Stokes equations are solved using the PISO algorithm (introduced by Issa Reference Issa1986). The details of the predictor and corrector iterations at the
 $(n+1)$
th time step are as follows.
In the predictor iteration, initially, the sphere acceleration,
 $\ddot{\boldsymbol{y}}_{\boldsymbol{s}}$
, is predicted explicitly using stored accelerations at previous time steps, based on third-order polynomial extrapolation,
 $$\begin{eqnarray}\displaystyle \ddot{\boldsymbol{y}}_{\boldsymbol{s}}^{(n+1)}=3\,\ddot{\boldsymbol{y}}_{\boldsymbol{s}}^{(n)}-3\,\ddot{\boldsymbol{y}}_{\boldsymbol{s}}^{(n-1)}+\ddot{\boldsymbol{y}}_{\boldsymbol{s}}^{(n-2)}. & & \displaystyle\end{eqnarray}$$
Once the sphere acceleration,
 $\ddot{\boldsymbol{y}}_{\boldsymbol{s}}$
, is known, the Navier–Stokes equations can be solved. However, before proceeding to solve these equations, the sphere velocity,
 $\dot{\boldsymbol{y}}_{\boldsymbol{s}}$
, and displacement,
 $\boldsymbol{y}_{\boldsymbol{s}}$
, are estimated by integrating the predicted
 $\ddot{\boldsymbol{y}}_{\boldsymbol{s}}$
and estimated
 $\dot{\boldsymbol{y}}_{\boldsymbol{s}}$
by a third-order Adams–Moulton method by
 $$\begin{eqnarray}\displaystyle \dot{\boldsymbol{y}}_{\boldsymbol{s}}^{(n+1)}=\dot{\boldsymbol{y}}_{\boldsymbol{s}}^{(n)}+\frac{\unicode[STIX]{x1D6FF}t}{12}(5\,\ddot{\boldsymbol{y}}_{\boldsymbol{s}}^{(n+1)}+8\,\ddot{\boldsymbol{y}}_{\boldsymbol{ s}}^{(n)}-\ddot{\boldsymbol{y}}_{\boldsymbol{ s}}^{(n-1)}) & & \displaystyle\end{eqnarray}$$
and
 $$\begin{eqnarray}\displaystyle \boldsymbol{y}_{\boldsymbol{s}}^{(n+1)}=\boldsymbol{y}_{\boldsymbol{s}}^{(n)}+\frac{\unicode[STIX]{x1D6FF}t}{12}(5\,\dot{\boldsymbol{y}}_{\boldsymbol{s}}^{(n+1)}+8\,\dot{\boldsymbol{y}}_{\boldsymbol{ s}}^{(n)}-\dot{\boldsymbol{y}}_{\boldsymbol{ s}}^{(n-1)}) & & \displaystyle\end{eqnarray}$$
respectively, where
 $\unicode[STIX]{x1D6FF}t$
is the time step. At the end of the predictor step, the Navier–Stokes equations are solved with the predicted
 $\ddot{\boldsymbol{y}}_{\boldsymbol{s}}$
, and the fluid force exerted on the sphere is calculated for the following corrector iteration.
In the corrector iteration,
 $\ddot{\boldsymbol{y}}_{\boldsymbol{s}}$
is corrected with the values of
 $\boldsymbol{y}_{\boldsymbol{s}}$
,
 $\dot{\boldsymbol{y}}_{\boldsymbol{s}}$
and
 $\boldsymbol{f}_{\boldsymbol{l}}$
calculated in the predictor or the previous corrector step by
 $$\begin{eqnarray}\displaystyle \ddot{\boldsymbol{y}}_{\boldsymbol{s}}^{(n+1)}=-\frac{c}{m}\dot{\boldsymbol{y}}_{\boldsymbol{s}}^{(n+1)}-\frac{k}{m}\boldsymbol{y}_{\boldsymbol{s}}^{(n+1)}+\frac{1}{m}\boldsymbol{f}_{\boldsymbol{l}}^{(n+1)}. & & \displaystyle\end{eqnarray}$$
Then, the correct values of
 $\dot{\boldsymbol{y}}_{\boldsymbol{s}}$
and
 $\boldsymbol{y}_{\boldsymbol{s}}$
are updated using (2.5) and (2.6) with the corrected
 $\ddot{\boldsymbol{y}}_{\boldsymbol{s}}$
. Subsequently, the Navier–Stokes equations are solved with the corrected
 $\ddot{\boldsymbol{y}}_{\boldsymbol{s}}$
, and the fluid force exerted on the sphere is calculated. Several corrector steps are performed until the magnitudes of the fluid force and the solid acceleration converge to within given error bounds.
It should be recalled that the fluid domain is modelled in a moving frame of reference. The motion of this reference frame is acknowledged through the outer domain velocity boundary conditions (except for the outlet boundary). In this study, all of the outer boundaries except for the outlet have velocities prescribed on them. Once the predictor–corrector iterative process is completed, the velocity boundary conditions are updated according to the sphere velocity,
 $\dot{\boldsymbol{y}}_{\boldsymbol{s}}$
, before proceeding to the next time step.
Schematic of the computational domain and boundary conditions.

2.3 Mesh and domain details
A uniform flow in the
 $x$
direction with magnitude
 $U$
past an elastically mounted sphere of diameter
 $D$
, restricted to translate in the
 $y$
axis, was simulated numerically using the newly built FSI solver described above. As shown in figure 1, a cubic domain with a side length of
 $100D$
was chosen for the computational domain with the sphere at its centre. In this study, the sphere motion was assumed to behave as a spring–mass system with zero damping constant to obtain the highest vibration amplitude. In the FSI solver,
 $\boldsymbol{y}_{\boldsymbol{s}}$
,
 $\dot{\boldsymbol{y}}_{\boldsymbol{s}}$
,
 $\ddot{\boldsymbol{y}}_{\boldsymbol{s}}$
and
 $\boldsymbol{f}_{\boldsymbol{l}}$
were treated as vectors with zero
 $x$
and
 $z$
components since the sphere motion was restricted to the
 $y$
direction. At the inlet and sphere boundaries, a Dirichlet boundary condition was prescribed for the velocity, while a zero-gradient Neumann boundary condition was prescribed for the pressure, as shown in figure 1. At the sphere surface, no-slip and no-penetration boundary conditions were applied. At the outlet boundary, the pressure was set to zero while the velocity was prescribed as zero gradient in the surface normal direction.
A block-structured grid was generated using Ansys-ICEM-CFD for the fluid domain, as shown in figure 2. A cubic block, with a side length of
 $5D$
, was placed around the sphere and was decomposed into six square frustums, as shown in figure 2(b). In each square frustum, exponentially distributed nodes were assigned in the radial direction to achieve high concentration near the sphere surface (see figure 2
c). In order to resolve the wake structures behind the sphere, a large number of grid points were assigned in the downstream direction. To examine the sensitivity of the computed solutions to grid refinement (see the next section), four successively finer grids were employed. The first three grids were generated by keeping the number of cells at the sphere surface,
 $N$
, constant. Grid 1 employed
 $\simeq 0.79$
million cells. In grid 1, the minimum cell thickness in the radial direction from the sphere surface,
 $\unicode[STIX]{x1D6FF}l$
, was
 $0.011D$
. The second grid (grid 2) was generated by decreasing
 $\unicode[STIX]{x1D6FF}l$
to
 $0.004D$
. This yielded
 $\simeq 1.25$
million cells, with approximately 10–16 cells within the boundary layer before flow separation. This was sufficient to resolve the flow in the near wake. However, a third grid (grid 3) was generated by further decreasing
 $\unicode[STIX]{x1D6FF}l$
to
 $0.002D$
with the same number of cells as grid 2, to determine the effect of
 $\unicode[STIX]{x1D6FF}l$
on the solution. Finally, grid 4 was generated by increasing the number of cells at the sphere surface with
 $\unicode[STIX]{x1D6FF}l=0.004D$
to observe the effect of cell thickness in the tangential direction on the solution. This yielded
 $\simeq 2.57$
million cells. The time step,
 $\unicode[STIX]{x1D6FF}t$
, used for each grid was
 $0.005D/U$
.
The unstructured-grid computational domain: (a) isometric view; (b) the cubic block placed around the sphere, which was decomposed into six square frustums; (c) grid near the sphere surface at the
 $x$
–
 $y$
plane.

3 Numerical sensitivity and validation studies
This section presents verification and validation studies. The first study aims to verify that the computational domain and mesh are adequate to capture the flow behind a stationary sphere at
 $Re=300$
and validates against previous predictions. The second study is undertaken to validate the newly developed FSI solver for VIV studies. Finally, a mesh resolution study for the VIV of a sphere is also presented at the end of this section.
Comparison of computed time-averaged drag coefficient,
 $\overline{C}_{d}$
, time-averaged lift coefficient,
 $\overline{C_{l}}$
, and Strouhal number,
 $St$
, at
 $Re=300$
with other numerical studies.

Response of an elastically mounted cylinder as a function of reduced velocity:
 $Re=200$
,
 $m^{\ast }=10$
,
 $\unicode[STIX]{x1D701}=0.01$
. (a) Maximum oscillation amplitude,
 $A_{max}^{\ast }$
; (b) peak lift coefficient,
 $C_{l,max}^{\prime }$
; (c) frequency ratio,
 $f^{\ast }=f/f_{n}$
; (d) average phase angle between lift force and cylinder displacement,
 $\unicode[STIX]{x1D719}$
.

3.1 Rigid sphere
Flow past a rigidly mounted sphere was modelled using the non-VIV solver (which formed the basis of the VIV solver) at
 $Re=300$
. Calculated values for the time-averaged drag coefficient,
 $\overline{C}_{d}$
, time-averaged lift coefficient,
 $\overline{C}_{l}$
, and Strouhal number,
 $St$
, are compared with other studies in table 1. The present results are in close agreement with literature values, generally falling within the narrow ranges of values from accepted benchmark studies (Johnson & Patel Reference Johnson and Patel1999; Constantinescu & Squires Reference Constantinescu and Squires2000; Kim et al.
Reference Kim, Kim and Choi2001; Giacobello et al.
Reference Giacobello, Ooi and Balachandar2009; Kim Reference Kim2009; Poon et al.
Reference Poon, Ooi, Giacobello and Cohen2010).
3.2 Vortex-induced vibration of a circular cylinder
To validate the new solver developed for general FSI problems, a set of simulations was conducted on the FIV of a circular cylinder with parameters chosen from Leontini et al. (Reference Leontini, Thompson and Hourigan2006b
). The mass ratio was set to
 $m^{\ast }=10$
and the damping ratio to
 $\unicode[STIX]{x1D701}=0.01$
. (In this case, the cylinder displacement was modelled by a spring–mass–damper system.) The Reynolds number was
 $Re=200$
and the reduced velocity range was
 $3\leqslant U^{\ast }\leqslant 7.5$
. Figure 3 compares current predictions for the maximum oscillation amplitude,
 $A_{max}^{\ast }$
, the peak lift coefficient,
 $C_{l,max}^{\prime }$
, the frequency ratio,
 $f^{\ast }=f/f_{n}$
, and the average phase angle between the lift force and the cylinder displacement,
 $\unicode[STIX]{x1D719}$
, with results from Leontini et al. (Reference Leontini, Thompson and Hourigan2006b
); the results obtained are almost identical, with minor differences probably attributable to a slightly different blockage ratio, mesh resolution and/or convergence of the predictor–corrector iteration steps. This study provides confidence in the new solver.
The sensitivity of the spatial resolution of the flow parameters of VIV of a sphere at
 $Re=300$
and
 $U^{\ast }=7$
, and
 $Re=800$
and
 $U^{\ast }=6$
(
 $m^{\ast }=2.865$
in each case). Here,
 $\unicode[STIX]{x1D6FF}l$
is the minimum thickness of the cells (in the radial direction) on the sphere surface in each grid and
 $N$
is the number of cells on the sphere surface. The root mean square (r.m.s.) value of the sphere oscillation amplitude,
 $A^{\ast }$
, the time-averaged drag coefficient,
 $\overline{C}_{d}$
, the r.m.s. values of the fluctuation components of the drag and lift coefficients,
 $C_{d,rms}$
and
 $C_{l,rms}$
, and the ratio of the vortex shedding frequency to the natural frequency,
 $f/f_{n}$
, are listed.

3.3 Resolution study
All FSI simulations reported in this work were carried out on grid 2. To demonstrate that this grid was sufficient to resolve the flow in FSI simulations, grid sensitivity analysis was performed for the vibrating sphere case for the following two sets of parameters:
 $Re=300$
and
 $U^{\ast }=7$
, and
 $Re=800$
and
 $U^{\ast }=6$
, with a sphere of
 $m^{\ast }=2.865$
. These
 $U^{\ast }$
values were chosen because the sphere showed periodic oscillation with a large amplitude near these values. Table 2 compares the effect of grid refinement on the results for the r.m.s. value of the sphere oscillation amplitude,
 $A^{\ast }$
, the force coefficients (time-averaged drag coefficient,
 $\overline{C}_{d}$
, r.m.s. values of the fluctuation components of the drag and lift coefficients,
 $C_{d,rms}^{\prime }$
and
 $C_{l,rms}^{\prime }$
) and the frequency ratio,
 $f^{\ast }=f/f_{n}$
. It is noted that for this set of variables, there is less than a 3 % variation in the predictions between grids 1 and 2 over all variables for both
 $Re=300$
and 800. Moreover, the results obtained from grids 2–4 are in a good agreement with one another. This suggests that further decrease of
 $\unicode[STIX]{x1D6FF}l$
or increase of
 $N$
will only affect the predictions weakly. Thus, this observation leads to the conclusion that grid 2 is sufficient for the VIV simulations, and, therefore, this grid was used to obtain all subsequently presented results.
4 Flow-induced vibration of a sphere at Re
 $\boldsymbol{ = }$
300

This section documents and discusses the results obtained for the flow past an elastically mounted sphere allowed to oscillate only along the
 $y$
direction at a Reynolds number of
 $Re=300$
and reduced mass of
 $m_{r}=1.5$
(corresponding to a mass ratio of
 $m^{\ast }=2.865$
) over the reduced velocity range
 $3.5\leqslant U^{\ast }\leqslant 100$
. The Reynolds number of the flow was prescribed through the kinematic viscosity in (2.1) (
 $\unicode[STIX]{x1D708}=DU/Re$
) and the reduced velocity was prescribed through the spring constant in the solid motion equation (
 $k=4m\unicode[STIX]{x03C0}^{2}/U^{\ast 2}$
).
Response of an elastically mounted (on the
 $y$
axis) sphere as a function of the reduced velocity,
 $U^{\ast }$
(calculated without the added-mass effect), at
 $Re=300$
,
 $m^{\ast }=2.865$
; panels (a,c,e) show the results for
 $U^{\ast }=3.5$
–100 while (b,d,f) show enlarged views for
 $U^{\ast }=3.5$
–30: (a,b) sphere oscillation amplitude,
 $A^{\ast }$
, (c,d) time-averaged non-dimensional sphere displacement,
 $\overline{Y}/D$
, (e,f) oscillation frequency normalized by the system natural frequency,
 $f^{\ast }=f/f_{n}$
. The letters (
 $A$
,
 $B$
,
 $C$
,
 $D$
,
 $E$
and
 $F$
) in (a) mark specific points along the response curve at which the time history of the sphere displacement is displayed in figure 5.

4.1 Sphere response
Figure 4 shows characteristics of the VIV response of the sphere in the reduced velocity range
 $3.5\leqslant U^{\ast }\leqslant 100$
in terms of sphere oscillation amplitude,
 $A^{\ast }=\sqrt{2}\;Y_{rms}/D$
, mean displacement of the sphere,
 $\overline{Y}/D$
, and frequency ratio,
 $f^{\ast }=f/f_{n}$
, where
 $Y=\boldsymbol{y}_{\boldsymbol{s}}\cdot (0\;1\;0)$
is the displacement of the sphere in the
 $y$
direction,
 $f$
is the oscillation frequency of the sphere and
 $f_{n}$
is the natural frequency of the system calculated without the added-mass effect. As can be seen from figure 4(a,b), the sphere oscillated significantly, with a maximum oscillation amplitude of approximately
 $0.4D$
, in the reduced velocity range
 $5.5\leqslant U^{\ast }\leqslant 10$
. Within this range, the sphere oscillation frequency was locked in with the vortex shedding frequency and close to the static body vortex shedding frequency,
 $f_{vo}$
. Moreover, the sphere oscillation frequency was synchronized with the natural frequency of the system (figure 4
e,f), confirming that this is a VIV response. This vibration state was designated as branch A.
Figure 4(c,d) displays the variation of the mean position of the sphere with reduced velocity. In the range
 $3.5\leqslant U^{\ast }\leqslant 5$
, where oscillations were very small, the mean position of the sphere was shifted away from its initial position by a small amount. This is consistent with the asymmetric wake of a stationary sphere at
 $Re=300$
(e.g. Johnson & Patel Reference Johnson and Patel1999; Leweke et al.
Reference Leweke, Provansal, Ormières and Lebescond1999; Ghidsera & Dusek Reference Ghidsera and Dusek2000; Thompson, Leweke & Provansal Reference Thompson, Leweke and Provansal2001). Furthermore, in this reduced velocity range, the mean displacement of the sphere,
 $\overline{Y}/D$
, increased as the reduced velocity,
 $U^{\ast }$
, increased. However, once the sphere began to oscillate in the reduced velocity range
 $5.5\leqslant U^{\ast }\leqslant 10$
, it oscillated symmetrically about its initial position, yielding a zero time-mean displacement (see figure 4
c,d). Moreover, the oscillations observed in branch A were purely sinusoidal, with zero offset (as the time history of sphere displacement,
 $Y/D$
, shows in figure 5(a) at
 $U^{\ast }=7$
), suggesting that the wake was symmetrical in the oscillation plane.
The time history diagrams in figure 5 show that it takes many oscillation periods to reach the asymptotic system state. For example, in case
 $A$
, the sphere began to oscillate at
 $\unicode[STIX]{x1D70F}\simeq 60$
, with the oscillation amplitude reaching its final value at
 $\unicode[STIX]{x1D70F}\simeq 150$
, where
 $\unicode[STIX]{x1D70F}=t\;U/D$
is the non-dimensional time. In some cases (see below), the oscillation response can maintain a semi-stable state for many periods prior to relaxing towards the long-time asymptotic state. Hence, care is needed to ensure that the flow is integrated forward in time for long enough to reach the representative long-time system state.
Time history of sphere displacement,
 $Y/D$
, against non-dimensional time,
 $\unicode[STIX]{x1D70F}=tU/D$
: (a) case
 $A$
at
 $U^{\ast }=7$
, (b) case
 $B$
at
 $U^{\ast }=10.5$
, (c) case
 $C$
at
 $U^{\ast }=15$
, (d) case
 $D$
at
 $U^{\ast }=20$
, (e) case
 $E$
at
 $U^{\ast }=28$
and (f) case
 $F$
at
 $U^{\ast }=75$
. See figure 4(a,b) for the locations of the points
 $A$
–
 $F$
along the sphere response curve.

In contrast to the sinusoidal responses observed for
 $U^{\ast }\leqslant 10$
, quite different responses were observed for the reduced velocities
 $U^{\ast }>10$
. Furthermore, for each
 $U^{\ast }>10$
case, varying sphere responses were observed at different time instances. Time histories of the sphere displacement at the points
 $B$
,
 $C$
,
 $D$
,
 $E$
and
 $F$
(marked in figure 4(a,b) at
 $U^{\ast }=10.5$
, 15, 20, 28 and 75) are shown in figure 5(b), (c), (d), (e) and (f) respectively. Within the range
 $U^{\ast }\in [10.5{-}40]$
, initially, the sphere oscillated with a maximum amplitude of approximately
 $0.15D$
, but later the oscillation amplitude decreased greatly. Therefore, all of these cases required simulations over extended times until the solution became stable. In these cases, the time-mean position of the sphere moved away from its initial position by a considerable amount. In addition, over the initial evolution, the oscillation amplitude and the mean position of the sphere varied with the simulation time. Over that initial period, the oscillations were considerably weaker than the purely sinusoidal oscillations observed in branch A.
In the ranges
 $U^{\ast }\in [13{-}16]$
and
 $[26{-}100]$
, the oscillation amplitude decreased to
 ${\approx}0.05D$
and
 $0.015D$
respectively after reaching the asymptotic state; see figure 5(c,e). However, these vibrations were notably periodic. In particular, the response range
 $13\leqslant U^{\ast }\leqslant 16$
is designated branch B and the range
 $26\leqslant U^{\ast }\leqslant 100$
is designated branch C. The sphere oscillation frequencies in both branches were locked in with the vortex shedding frequency. It is not clear that either of these two branches is directly analogous to the response branches observed in higher-Reynolds-number experiments. The sphere oscillation frequency for branch B was approximately equal to the system natural frequency,
 $f_{n}$
; see figure 4(e,f). However, for branch C, the sphere oscillation frequency was not close to the natural frequency of the system, but was close to half of the static body vortex shedding frequency.
Weak initial oscillations in the reduced velocity ranges
 $U^{\ast }\in [10.5{-}12]$
and
 $U^{\ast }\in [17{-}25]$
eventually faded away, as shown in figures 5(b,d), leading to a minimally oscillatory final state. The reduced velocity ranges
 $U^{\ast }\in [3.5{-}5]$
,
 $[10.5{-}12]$
and
 $[17{-}25]$
are desynchronization regimes where no significant sphere oscillations were observed (points
 $B$
and
 $D$
marked in figure 4
a,b). In those three ranges, except for a few cases, sphere oscillations were observed with a very small amplitude (
 ${\leqslant}0.005D$
), and the sphere oscillation frequency was equal to the static body vortex shedding frequency,
 $f_{vo}$
, as shown in figure 4(e,f).
In both branches B and C, the time-mean displacement of the sphere increased as the reduced velocity increased (see figure 4
c,d). However, there was not any clear pattern in the mean displacement over the reduced velocity ranges
 $U^{\ast }\in [10.5{-}12]$
and
 $[17{-}25]$
, where no oscillations were observed. When the reduced velocity was increased further from 30 to 100, the sphere shifted away from its initial position by a substantial margin and oscillated periodically with an amplitude of approximately
 $0.05D$
about its new time-mean position, as shown in the time history of sphere displacement at
 $U^{\ast }=75$
in figure 5(f). Moreover, in this regime, the sphere showed a secondary frequency besides the main frequency, as shown in 5(f) in the zoomed-in view. For
 $U^{\ast }>30$
, the time-mean displacement of the sphere increased as the reduced velocity increased. At
 $U^{\ast }=100$
, the time-mean position of the sphere migrated to
 ${\sim}5D$
away from its initial position (see figure 4
c,e).
4.1.1 Comparison with other research studies
Behara & Sotiropoulos (Reference Behara and Sotiropoulos2016) studied VIV of a sphere that was allowed to move in all three spatial directions for the same Reynolds number with a sphere with a reduced mass of
 $m_{r}=2$
. They observed two different hysteretic VIV responses, with different possible states observable at the same reduced velocity. In one case, the sphere moved in a linear path in the transverse plane (
 $xz$
plane) with hairpin-type vortex loops shed behind the sphere. In the other case, the sphere moved in a circular orbit with spiral vortices observed in the wake. Figure 6 compares the amplitude response observed with a sphere of reduced mass
 $m_{r}=2$
for branch A with that of Behara & Sotiropoulos (Reference Behara and Sotiropoulos2016) for their response branch corresponding to linear oscillations for the reduced velocity range
 $3.5<U^{\ast }<10$
. Here, the sphere response amplitude is observed to be higher when motion is restricted to one DOF (degree of freedom). For the 3-DOF movement, the three orthogonal springs may affect the motion slightly differently from restricted 1-DOF motion aligned with the springs; hence, it is not clear how these two problems exactly relate to each other despite the observed linear motion in a plane in both cases. Despite this, the general amplitude response and lock-in range agree reasonably well, while noting a shift to a slightly higher lock-in range for the current simulations.
Comparison of VIV response for a sphere free to move only in the transverse direction (
 $y$
only), ●, and free to move in all three spatial directions by Behara & Sotiropoulos (Reference Behara and Sotiropoulos2016) when the sphere is moving in a linear path in the transverse plane (
 $xz$
plane), ▴ (orange), at a Reynolds number of
 $Re=300$
and a mass ratio of
 $m^{\ast }=3.8197$
(
 $m_{r}=2$
).

Variation of the sphere response amplitude at various mass ratios, at
 $Re=300$
and
 $U^{\ast }=6.5$
.

The sphere response curves observed for the reduced masses
 $m_{r}=1.5$
and 2 almost lie on top of each other (compare the response curves in figures 4
a and 6). This demonstrates that a small variation in mass ratio does not significantly affect the amplitude response. This was further investigated by varying the mass ratio of the sphere from 1.2 to 10 at a fixed reduced velocity of
 $U^{\ast }=6.5$
, where the peak response occurred (see figure 7). The variation of the sphere response amplitude with mass ratio was less than 2 %. This verifies that there is no significant effect of mass ratio on the sphere peak response amplitude over this mass ratio range, consistent with previous experimental findings for VIV of low-mass-damped spheres and cylinders (Griffin Reference Griffin1980; Govardhan & Williamson Reference Govardhan and Williamson2006).
The highly periodic and large-amplitude vibration observed in branch A resembles the vibration observed over a similar reduced velocity range by Govardhan & Williamson (Reference Govardhan and Williamson2005) in their experimental study on tethered spheres at much higher Reynolds numbers. They found that the oscillations of a tethered sphere (
 $xy$
motion) and a hydroelastic sphere (
 $y$
only) compared well for similar mass damping parameters. In this velocity range, they observed two district modes of vibration (modes I and II). In contrast to the clearly distinguishable mode transitions of a circular cylinder, there was a smooth transition between modes I and II for a sphere. These two modes were only clearly distinguishable from the amplitude response curve for spheres with small mass ratios (Jauvtis et al.
Reference Jauvtis, Govardhan and Williamson2001, figure 2). It was even harder to distinguish them from the amplitude response for hydroelastic spheres (Govardhan & Williamson Reference Govardhan and Williamson2005, figure 2b). At
 $Re=300$
, the amplitude response variation is not indicative of two different vibration modes.
For mode I, Govardhan & Williamson (Reference Govardhan and Williamson2005) observed an oscillation amplitude of
 ${\approx}0.4D$
for a sphere of mass ratio
 $m^{\ast }=2.83$
in 2-DOF motion (
 $xy$
motion); this is similar to the current observations for
 $m^{\ast }=2.865$
and with 1-DOF motion in the
 $y$
direction. However, they observed an oscillation amplitude of
 ${\approx}0.8D$
for mode II which was not the case in this study. Indeed, for both modes I and II, they observed that the oscillating frequency of the sphere was close to the natural frequency of the system, consistent with the low-Reynolds-number behaviour here. However, it would be misleading to claim a strong analogy between modes I and II, and branch A, at this low Reynolds number.
4.2 Force measurements
This section presents the pressure and viscous force components acting on the sphere in the
 $x$
,
 $y$
and
 $z$
directions. Figure 8 shows the variation with
 $U^{\ast }$
of the mean drag coefficient,
 $\overline{C}_{d}$
(the force coefficient in the
 $x$
direction), the mean lift coefficients in the
 $y$
and
 $z$
directions,
 $\overline{C}_{ly}$
and
 $\overline{C}_{lz}$
respectively, the mean total lift coefficient,
 $\overline{C}_{l}=\sqrt{\overline{C}_{ly}^{2}+\overline{C}_{lz}^{2}}$
, and the mean angle of lift,
 $\overline{\unicode[STIX]{x1D703}}$
, where
 $\unicode[STIX]{x1D703}=\arctan (C_{lz}/C_{ly})$
is the angle between the force coefficients in the
 $y$
and
 $z$
directions.
In the reduced velocity range
 $3.5\leqslant U^{\ast }\leqslant 5$
, both
 $\overline{C}_{d}$
and
 $\overline{C}_{ly}$
were constant, consistent with negligible sphere oscillation. Indeed, these values were identical with the corresponding force coefficients of a rigidly mounted sphere at the same Reynolds number. The non-zero mean displacement of the sphere in this reduced velocity range is attributable to the non-zero mean lift. As expected, there was no force component in the
 $z$
direction over this
 $U^{\ast }$
range. Figure 9 shows the variation of the r.m.s. values of the force coefficients in the
 $x$
,
 $y$
and
 $z$
directions,
 $C_{d,rms}$
,
 $C_{ly,rms}$
and
 $C_{lz,rms}$
respectively, with the reduced velocity. Over this range, there were negligible fluctuations of forces in any direction. Therefore, in this non-resonance
 $U^{\ast }$
range, the sphere effectively behaved like a rigidly mounted sphere with no significant oscillatory motion, as discussed previously.
Variation of the force coefficients with the reduced velocity; panels (a,c,e,g,i) show the results for
 $U^{\ast }\in [3.5{-}100]$
and (b,d,f,h,j) show enlarged views for
 $U^{\ast }\in [3.5{-}25]$
: (a,b) mean drag coefficient,
 $\overline{C}_{d}$
, (c,d) mean lift coefficient in the
 $y$
direction,
 $\overline{C}_{ly}$
, (e,f) mean lift coefficient in the
 $z$
direction,
 $\overline{C}_{lz}$
, (g,h) mean lift coefficient,
 $\overline{C}_{l}=\sqrt{\overline{C}_{ly}^{2}+\overline{C}_{lz}^{2}}$
, and (i,j) mean lift angle,
 $\overline{\unicode[STIX]{x1D703}}$
, where
 $\unicode[STIX]{x1D703}=\arctan (C_{lz}/C_{ly})$
is the angle between the lift coefficients in the
 $y$
and
 $z$
directions.

Variation of the r.m.s. values of the fluctuation components of the force coefficients with the reduced velocity; panels (a,c,e) show the results for
 $U^{\ast }=3.5$
–100 and (b,d,f) show enlarged views for
 $U^{\ast }=3.5$
–25: (a,b) r.m.s. of drag coefficient,
 $C_{d,rms}^{\prime }$
, (c,d) r.m.s. of lift coefficient in the
 $y$
direction,
 $C_{ly,rms}^{\prime }$
, (e,f) r.m.s. of lift coefficient in the
 $z$
direction,
 $C_{lz,rms}^{\prime }$
.

As the sphere began to oscillate at
 $U^{\ast }=5.5$
, the mean drag coefficient,
 $\overline{C}_{d}$
, suddenly increased by
 ${\approx}30\,\%$
(see figure 8
a,b) from its pre-oscillatory value. Over the reduced velocity range
 $U^{\ast }\in [5.5{-}10]$
,
 $\overline{C}_{d}$
decreased gradually as
 $U^{\ast }$
increased, returning to the non-oscillatory value at the end of the range. A similar behaviour of
 $\overline{C}_{d}$
was reported by Behara et al. (Reference Behara, Borazjani and Sotiropoulos2011) in their study of VIV of a sphere in 3-DOF. In this velocity range, the mean lift coefficient in the
 $y$
direction,
 $\overline{C}_{ly}$
, dropped to zero, as shown in figure 8(c,d). This is consistent with symmetric sphere oscillations observed through its initial position in this regime. However, within this
 $U^{\ast }$
range, the forces in the
 $x$
and
 $y$
directions fluctuated with large amplitudes, as shown in figure 9(a–d) by the r.m.s. values of the fluctuation amplitudes of the force coefficients. This is evidence of the enhancement of sphere oscillations in this regime (branch A). As can be seen from figure 9(a–d), the r.m.s. values of the drag coefficient and the lift coefficient in the
 $y$
direction (
 $C_{d,rms}^{\prime }$
and
 $C_{ly,rms}^{\prime }$
respectively) increased suddenly at
 $U^{\ast }=5.5$
and then gradually decreased to zero as
 $U^{\ast }$
increased to
 $10$
. The analytical solution of the governing motion equation of the sphere (2.3) subjected to a periodic input force shows that the sphere oscillation amplitude is proportional to the fluctuation amplitude of the force,
 $C_{ly}^{\prime }$
, and is inversely proportional to the spring constant,
 $k=4m\unicode[STIX]{x03C0}^{2}/U^{\ast 2}$
. Therefore, the sphere oscillation amplitude,
 $A^{\ast }$
, is proportional to
 $C_{ly}^{\prime }\times U^{\ast 2}$
. The exponentially decaying
 $C_{ly}^{\prime }$
, as shown in figure 9(c,d) for increasing
 $U^{\ast }$
, leads to the amplitude response profile shown in figure 4(a,b), whereby there is a sharp drop of the maximum oscillation amplitude.
For the case of
 $U^{\ast }\leqslant 10$
, there was no force component in the
 $z$
direction, as expected. However, as
 $U^{\ast }$
increased beyond 10, surprisingly, a force component in the
 $z$
direction was found, indicating that the wake loses mirror symmetry in this range. Figure 10 shows the time histories of the force coefficients in the
 $y$
and
 $z$
directions at the points
 $A$
–
 $F$
marked in figure 4(a,b). As can be seen, for cases
 $B$
–
 $E$
(in the reduced velocity range
 $U^{\ast }\in [10.5{-}40]$
), a force component in the
 $z$
direction appears gradually with simulation time. The
 $y$
and
 $z$
components of the forces are of the same order of magnitude (see figure 8
c–f). Therefore, the influence of the
 $z$
component of the force is not negligible in this case. If the sphere were to be allowed to move in both the
 $y$
and
 $z$
directions, it might well orbit with an elliptical trajectory. For these reduced velocities, initially, forces in the
 $y$
direction were irregular, with a large oscillation amplitude. However, as the simulation time progressed, forces in the
 $y$
direction were attenuated and the oscillating amplitudes decreased. The behaviour of the forces is consistent with the behaviour of the sphere displacement. The sphere oscillation amplitude decreased as the fluctuation amplitude of the force in the
 $y$
direction decreased. Hence, there was a small oscillation amplitude for vibration branches B and C. However, the force component in the
 $z$
direction diminished with increasing
 $U^{\ast }$
for
 $U^{\ast }\geqslant 26$
, in terms of both the mean and the fluctuating amplitude (see figures 8
e,f and 9
e,f). The mean lift force in the
 $y$
direction approached that of a stationary sphere with increasing
 $U^{\ast }$
for
 $U^{\ast }\geqslant 26$
.
Time history of the force coefficients in the
 $y$
and
 $z$
directions (
 $C_{ly}$
and
 $C_{lz}$
respectively);
 $C_{ly}$
is shown with the orange colour (light) curves while
 $C_{lz}$
is shown with the black colour (dark) curves;
 $\unicode[STIX]{x1D70F}=tU/D$
is the non-dimensional time: (a) case
 $A$
at
 $U^{\ast }=7$
, (b) case
 $B$
at
 $U^{\ast }=10.5$
, (c) case
 $C$
at
 $U^{\ast }=15$
, (d) case
 $D$
at
 $U^{\ast }=20$
, (e) case
 $E$
at
 $U^{\ast }=28$
and (f) case
 $F$
at
 $U^{\ast }=75$
. See figure 4 for the locations of the points
 $A$
–
 $F$
on the sphere response curve.

As figure 8(c,d) shows, the lift force in the
 $y$
direction was not zero in the vibration branches B (
 $13\leqslant U^{\ast }\leqslant 16$
) and C (
 $26\leqslant U^{\ast }\leqslant 100$
). This non-zero lift force moved the sphere away from its initial position, whereupon vibration in branches B and C occurred about this modified position. This may be another reason for the small amplitude of vibrations for these branches. As
 $U^{\ast }$
increased from 26 to 100, the mean displacement of the sphere increased greatly, attaining a value of
 $5D$
at
 $U^{\ast }=100$
. However, the mean lift force in the
 $y$
direction increased only to the stationary sphere value. Therefore, the increase in the mean displacement of the sphere can be considered to be due to the effective decrease of the stiffness of the spring as the reduced velocity is increased.
For
 $U^{\ast }>10$
, even though the individual mean lift coefficients in the
 $y$
and
 $z$
directions varied with the reduced velocity, the mean value of the total lift coefficient,
 $\overline{C}_{l}=\sqrt{\overline{C}_{ly}^{2}+\overline{C}_{lz}^{2}}$
, interestingly remained constant and equal to that of a stationary sphere (see figure 8
g,h). This indicates that except for branch A, where large-amplitude vibrations were observed, the time-mean of the total lift force was essentially identical to its non-VIV value. The variation of the mean lift angle with the reduced velocity is shown in figure 8(i,j), where the angle of lift,
 $\unicode[STIX]{x1D703}$
, is
 $\arctan (C_{lz}/C_{ly})$
. The mean angle was almost
 $0^{\circ }$
for
 $U^{\ast }\leqslant 10$
. It was approximately
 $-45^{\circ }$
within the first desynchronization regime and in branch B, and approximately
 $-90^{\circ }$
in the second desynchronization regime. At the beginning of branch C, the mean lift angle was approximately
 $-45^{\circ }$
, and it approached
 $0^{\circ }$
as the reduced velocity increased, which is consistent with the variation of
 $\overline{C}_{lz}$
for branch C.
4.2.1 Phase between sphere displacement and forces
As Govardhan & Williamson (Reference Govardhan and Williamson2005) discussed, the total fluid force in the
 $y$
direction,
 $F_{total}$
, can be split into a potential force component,
 $F_{potential}=-m_{A}\,\ddot{y} (t)$
, which arises due to the potential added-mass force, and a vortex force component,
 $F_{vortex}$
, which is due to the dynamics of vorticity. This recognizes the fact that a flow solution can be constructed as a sum of a potential flow field plus a velocity field associated with vorticity in the flow (see, e.g., Lighthill Reference Lighthill1986). Here,
 $m_{A}$
is the added mass due to the motion of the sphere. Therefore, the vortex force can be computed from
 $$\begin{eqnarray}\displaystyle F_{vortex}=F_{total}-F_{potential}. & & \displaystyle\end{eqnarray}$$
Normalization of all forces by
 $0.5\unicode[STIX]{x1D70C}U^{2}\unicode[STIX]{x03C0}D^{2}/4$
gives
 $$\begin{eqnarray}\displaystyle C_{vortex}=C_{total}-C_{potential}. & & \displaystyle\end{eqnarray}$$
Govardhan & Williamson (Reference Govardhan and Williamson2005) observed a shift in vortex phase,
 $\unicode[STIX]{x1D719}_{vortex}$
, of
 $90^{\circ }$
in the transition between mode I and mode II. The total phase,
 $\unicode[STIX]{x1D719}_{total}$
, only increased slightly over the same
 $U^{\ast }$
range, but it increased towards
 $180^{\circ }$
at the reduced velocity close to the peak amplitude of the mode II range (Govardhan & Williamson Reference Govardhan and Williamson1997, Reference Govardhan and Williamson2005; Jauvtis et al.
Reference Jauvtis, Govardhan and Williamson2001; Sareen et al.
Reference Sareen, Zhao, Lo Jacono, Sheridan, Hourigan and Thompson2018). Those experiments also show that there is no desynchronized region between modes I and II for small-mass-ratio 1-DOF hydroelastic systems, although this is the case for light (
 $m^{\ast }<1$
) tethered sphere systems. Figure 11 shows the variation of the total phase and vortex phase with the reduced velocity. As can be seen from figure 11(d), over branch A, the vortex force gradually increased from
 $0^{\circ }$
to
 $180^{\circ }$
while the total phase stayed at
 $0^{\circ }$
. Therefore, at the beginning of branch A, the force/displacement phasing is consistent with mode I. The increase in total phase does not occur over the range covered by this branch, but instead occurs in branch B; however, this is not to conclude that branch B is analogous to the experimental mode II.
Variation of the total phase,
 $C_{total}$
, and vortex phase,
 $C_{vortex}$
, with
 $U^{\ast }$
; (b) and (d) show the zoomed-in view for small
 $U^{\ast }$
.
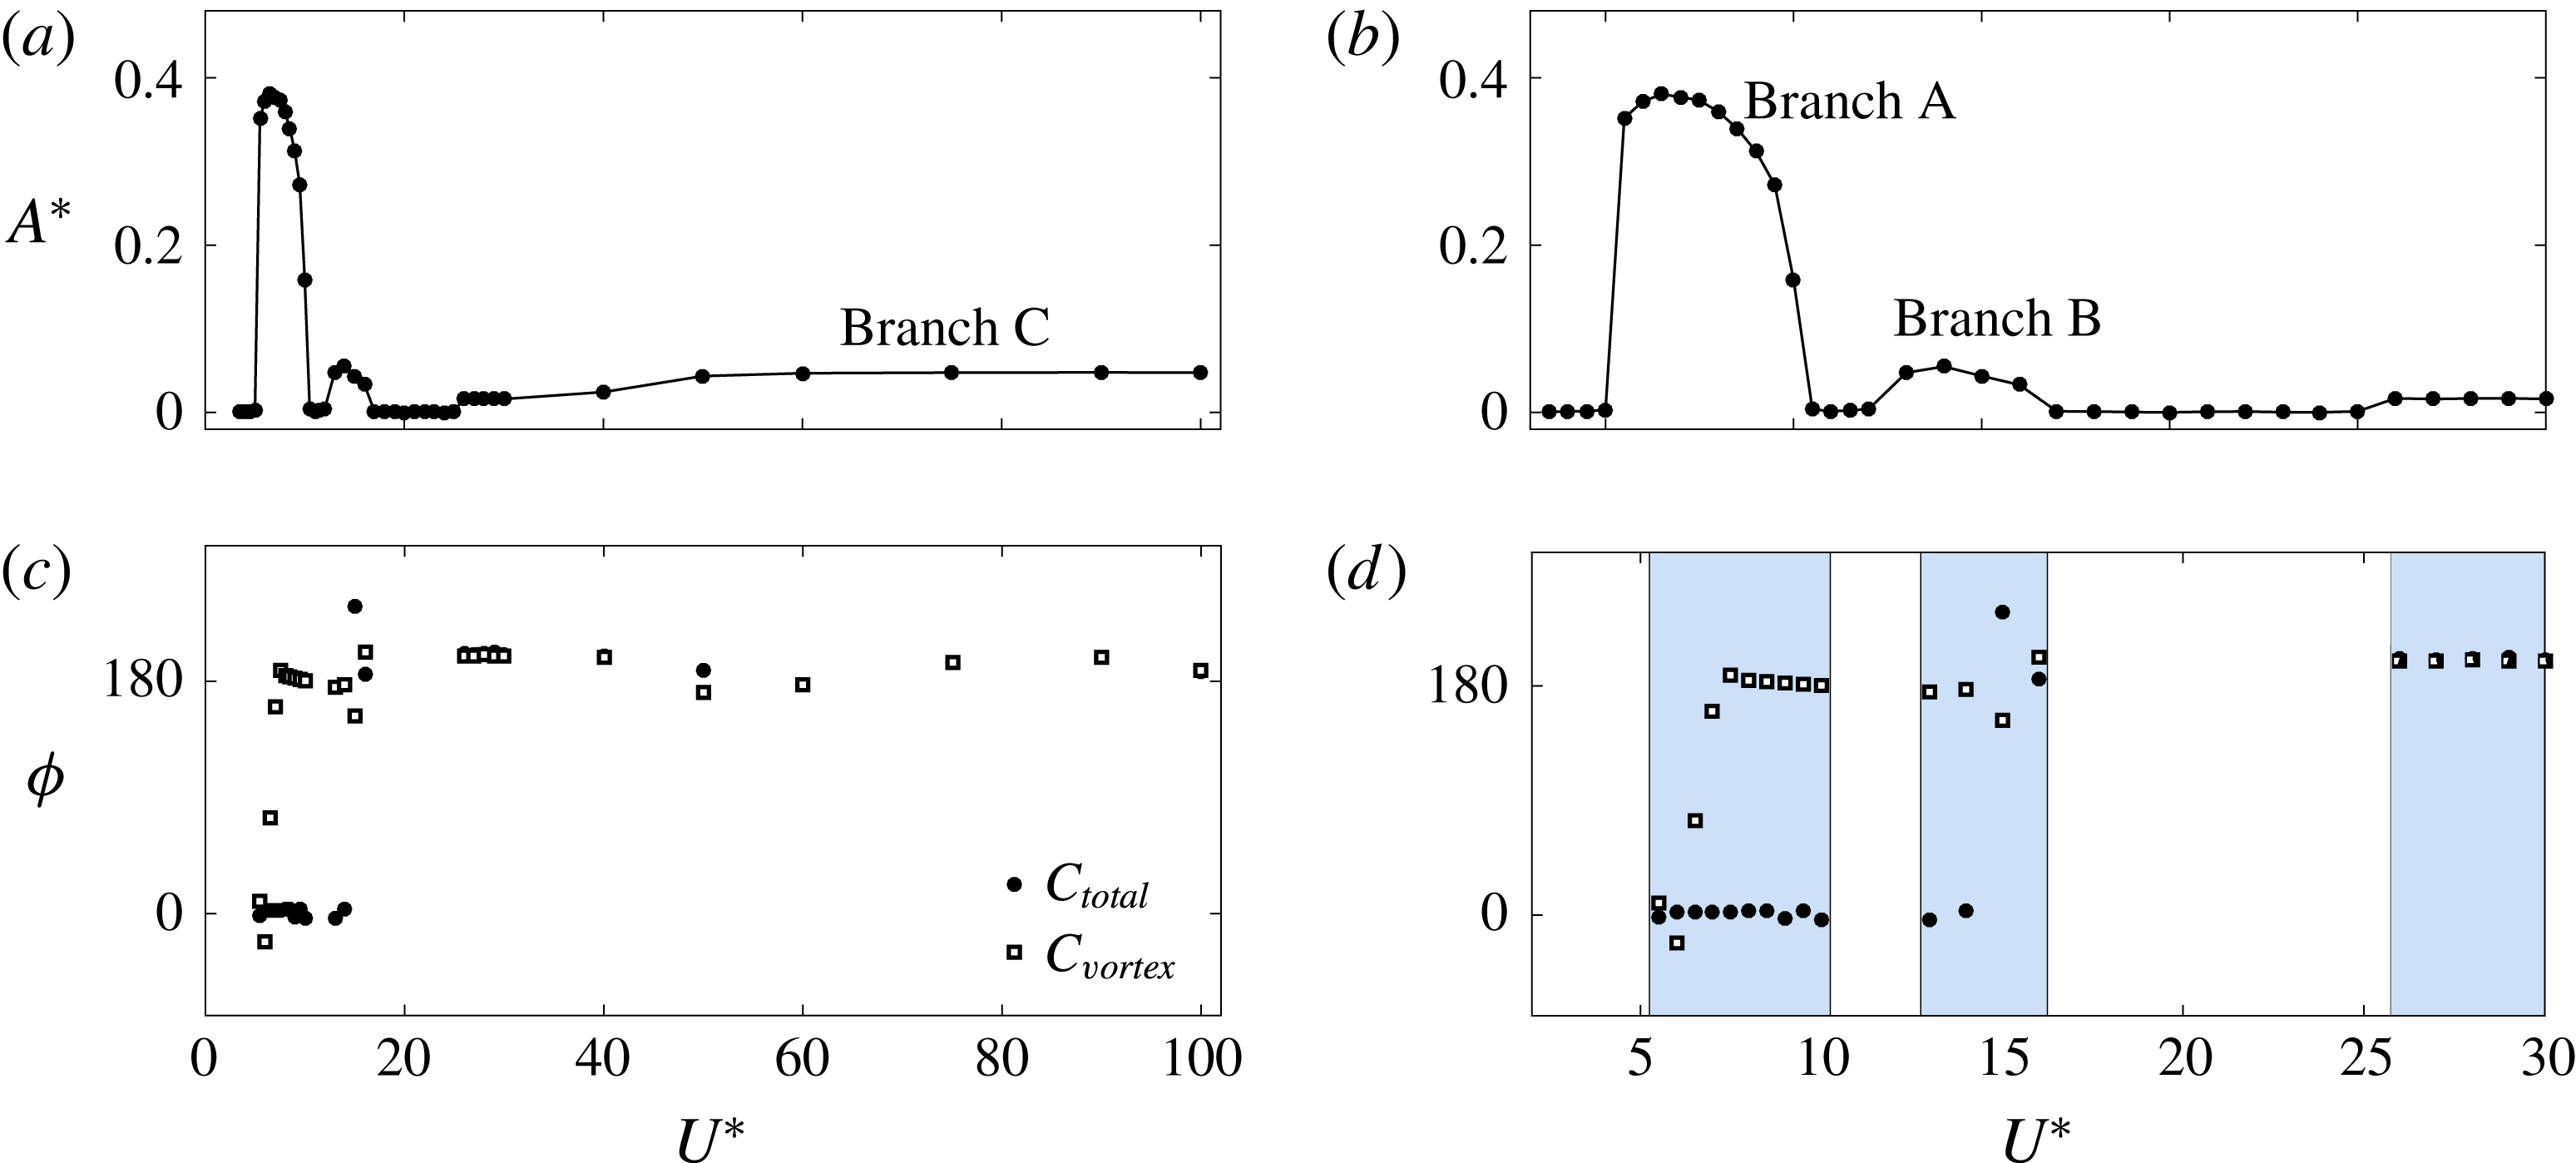
Figure 12 shows the variation of sphere displacement, total force,
 $C_{total}$
, and vortex force,
 $C_{vortex}$
, for two periods for branch A at the reduced velocities
 $U^{\ast }=5$
and
 $7$
respectively. As can be seen, the sphere vibration frequency was locked in with
 $C_{total}$
as well as with
 $C_{vortex}$
. As mentioned earlier, there is approximately
 $180^{\circ }$
phase difference between
 $C_{vortex}$
and
 $Y$
towards the end of branch A.
As the reduced velocity increased, for branches B and C,
 $\unicode[STIX]{x1D719}_{vortex}$
stayed at
 ${\sim}180^{\circ }$
(see figure 11). However,
 $\unicode[STIX]{x1D719}_{total}$
suddenly shifted from
 $0^{\circ }$
to
 $180^{\circ }$
within branch B. Indeed, from this point of view, branch B shows some similarities to mode II for light tethered systems, especially as the oscillation frequency follows a
 $(1/2)f_{vo}$
variation – see figures 4 and 7 of Govardhan & Williamson (Reference Govardhan and Williamson2005). Interestingly, branch C also follows this variation but with a difference in vortex and total phase of
 $180^{\circ }$
. On the other hand, mode III, observed in high-mass-ratio higher-Reynolds-number experiments (Jauvtis et al.
Reference Jauvtis, Govardhan and Williamson2001), is locked to the natural frequency of the system, with each oscillation period corresponding to 3–8 vortex shedding periods (Govardhan & Williamson Reference Govardhan and Williamson2005). This is certainly not the case for branch C here, where oscillation occurs at close to the subharmonic of the non-VIV vortex shedding frequency. Thus, branch C and mode III do not appear to be related.
Relationship between the total force in the
 $y$
direction,
 $C_{total}$
, and the vortex force in the
 $y$
direction,
 $C_{vortex}$
, in branch A: (a) at
 $U^{\ast }=5.5$
(mode I) and (b) at
 $U^{\ast }=7$
(mode II).

4.3 Wake structures
Vortical structures in the wake are depicted using isosurfaces of the second invariant of the velocity tensor (known as the
 $Q$
-criterion; see Hunt, Wray & Moin Reference Hunt, Wray and Moin1988). As figure 13 shows, for branch A, two regular streets of hairpin vortices form the wake. This structure resembles those in the wake observed by Govardhan & Williamson (Reference Govardhan and Williamson2005) for their mode I and II vibrations using DPIV to extract the vorticity field. The wake also appears identical to the hairpin-type wake observed by Behara et al. (Reference Behara, Borazjani and Sotiropoulos2011) for VIV of a sphere with 3-DOF at
 $Re=300$
; the current study extends the range of reduced velocity considered by an order of magnitude as well as extending the length of the simulations, leading to different evolved states in some cases. The wake observed for a rigidly mounted sphere (shown in figure 14) is modified considerably under vibration of the sphere. Vortex loops are stretched towards positive and negative
 $y$
directions as the sphere vibrates. In particular, a vortex loop sheds in the positive
 $y$
direction as the sphere moves to the negative
 $y$
direction. The evolution of the wake for branch A (
 $U^{\ast }=7$
) over one cycle is shown in figure 15. As can be seen, a vortex loop initiated from the outside sheds like a hairpin and ends from the inside. As a loop is shed, three tails form, one from the tip and two from the sides. Later, these three tails interconnect by creating two small loops. However, as the vortex loop moves further, the connection from the tip disappears and the tail forms a ‘U’-shape. The direction of the tail is the same as the direction of the streamlines upstream. The wake is symmetric in the
 $xy$
plane (see also figure 13, branch A in
 $xz$
plane). The upper and lower vortex streets are equal in strength as the sphere oscillation is symmetric through its initial position.
Instantaneous wake structures visualized by the
 $Q$
-criterion (
 $Q=0.001$
) of branch A (at
 $U^{\ast }=7$
), branch B (at
 $U^{\ast }=15$
) and branch C (at
 $U^{\ast }=75$
) vibrations.

Instantaneous wake structures for a rigidly mounted sphere at
 $Re=300$
.

Evolution of vortical wake structures behind the sphere with time for the maximum response case of
 $U^{\ast }=7$
. (a) The first half of the cycle with the sphere moving downwards, and (b) the second half of the cycle with the sphere moving upwards.

As figure 13 shows, the wake observed for vibration branch B is quite different. This wake resembles more closely that of a rigidly mounted sphere than the wake for branch A. The orientation of the wake is no longer aligned with the
 $xy$
plane, as also indicated by the non-zero lift angle shown in figure 9. A lift angle of
 $\unicode[STIX]{x1D703}\approx 50^{\circ }$
was found for branch B, and thus the wake for branch B is rotated by an angle of
 ${\approx}50^{\circ }$
. In contrast to the wake for branch A, the loops in the wake for this branch are interconnected and asymmetric.
The wake structures observed in vibration branch C (see figure 13) again more closely resemble the wake structures observed for a rigidly mounted sphere than the wake for branch A. However, the loops are elongated along the
 $x$
axis, and the non-dimensional shedding frequency is lower than for those structures in branches A and B. It should be recalled that in this branch, the oscillation frequency is half of the normal shedding frequency. In contrast to the vortical wake structures for branch B, the wake for branch C at higher
 $U^{\ast }$
values has the same orientation as for branch A and is symmetric through the
 $xy$
plane. This is reflected by the lift angle again decreasing at higher reduced velocities. However, the loops are oriented more towards the negative
 $y$
direction, due to the non-zero lift force in the
 $y$
direction.
Instantaneous wake structures in the
 $xy$
plane in the desynchronization regimes showing rotation of the wake alignment relative to the oscillation direction: (a) at
 $U^{\ast }=4\in [3.5{-}5]$
, (b) at
 $U^{\ast }=10.5\in [10.5{-}12]$
, (c) at
 $U^{\ast }=20\in [17{-}25]$
.

Figure 16 shows the wake structures observed in the desynchronization regimes where the sphere does not vibrate significantly. In each of these regimes, the wake structures strongly resemble those observed for a rigidly mounted sphere. However, their orientations are different. In the first desynchronization regime,
 $U^{\ast }\in [3.5{-}5]$
, the orientation of the wake is identical to that of the wake of a rigidly mounted sphere. However, in the second and third desynchronization regimes (
 $U^{\ast }\in [10.5{-}12]$
and
 $[17{-}25]$
), the wake has been rotated by angles of
 ${\approx}50^{\circ }$
and
 $90^{\circ }$
; again, this is consistent with the observed lift angle variation.
Overall, the wake structures observed in branch A are similar to those observed by Govardhan & Williamson (Reference Govardhan and Williamson2005) for their mode I and II vibrations and Behara et al. (Reference Behara, Borazjani and Sotiropoulos2011) for the hairpin response branch. However, the wake structures observed for branches B and C for the reduced velocity ranges
 $U^{\ast }\in [13{-}16]$
and
 $[26{-}100]$
, where the sphere oscillated with a small oscillation amplitude, are different from the wake structures for branch A as well as from the wake structures observed by Govardhan & Williamson (Reference Govardhan and Williamson2005) for mode III. This also explains why the vibrations observed in branches B and C are different from the large oscillation amplitudes reported in the experimental studies.
5 Flow-induced vibration of a sphere at Re
$\boldsymbol{ = }$
800

The investigation of FIV of a sphere was extended by increasing the Reynolds number to
 $Re=800$
. At
 $Re=300$
, even though higher reduced velocities were considered, the low-frequency vibration regimes observed by experimental studies with tethered spheres (mode III and IV vibrations investigated by Jauvtis et al. (Reference Jauvtis, Govardhan and Williamson2001)) were not able to be reproduced. Govardhan & Williamson (Reference Govardhan and Williamson2005) explained that mode III vibration response occurs for the normalized velocity regime
 $(U^{\ast }/f^{\ast })S=f_{vo}/f=3$
to 8, where
 $S$
is the Strouhal number. Furthermore, mode IV vibration appeared after mode III for
 $(U^{\ast }/f^{\ast })S$
approximately greater than 19. However, at
 $Re=300$
, the highest normalized velocity,
 $(U^{\ast }/f^{\ast })S$
, that could be attained was 2 since
 $f\approx (1/2)f_{vo}$
for higher reduced velocities (
 $U^{\ast }\geqslant 26$
). Therefore, to investigate the low-frequency regime and the effect of the Reynolds number in the laminar regime, the Reynolds number of the flow was increased to
 $Re=800$
. The mass ratio used was again
 $m^{\ast }=2.865$
. Similarly to the
 $Re=300$
case, the sphere was restricted to move only in the
 $y$
direction.
5.1 Sphere response at
$Re=800$

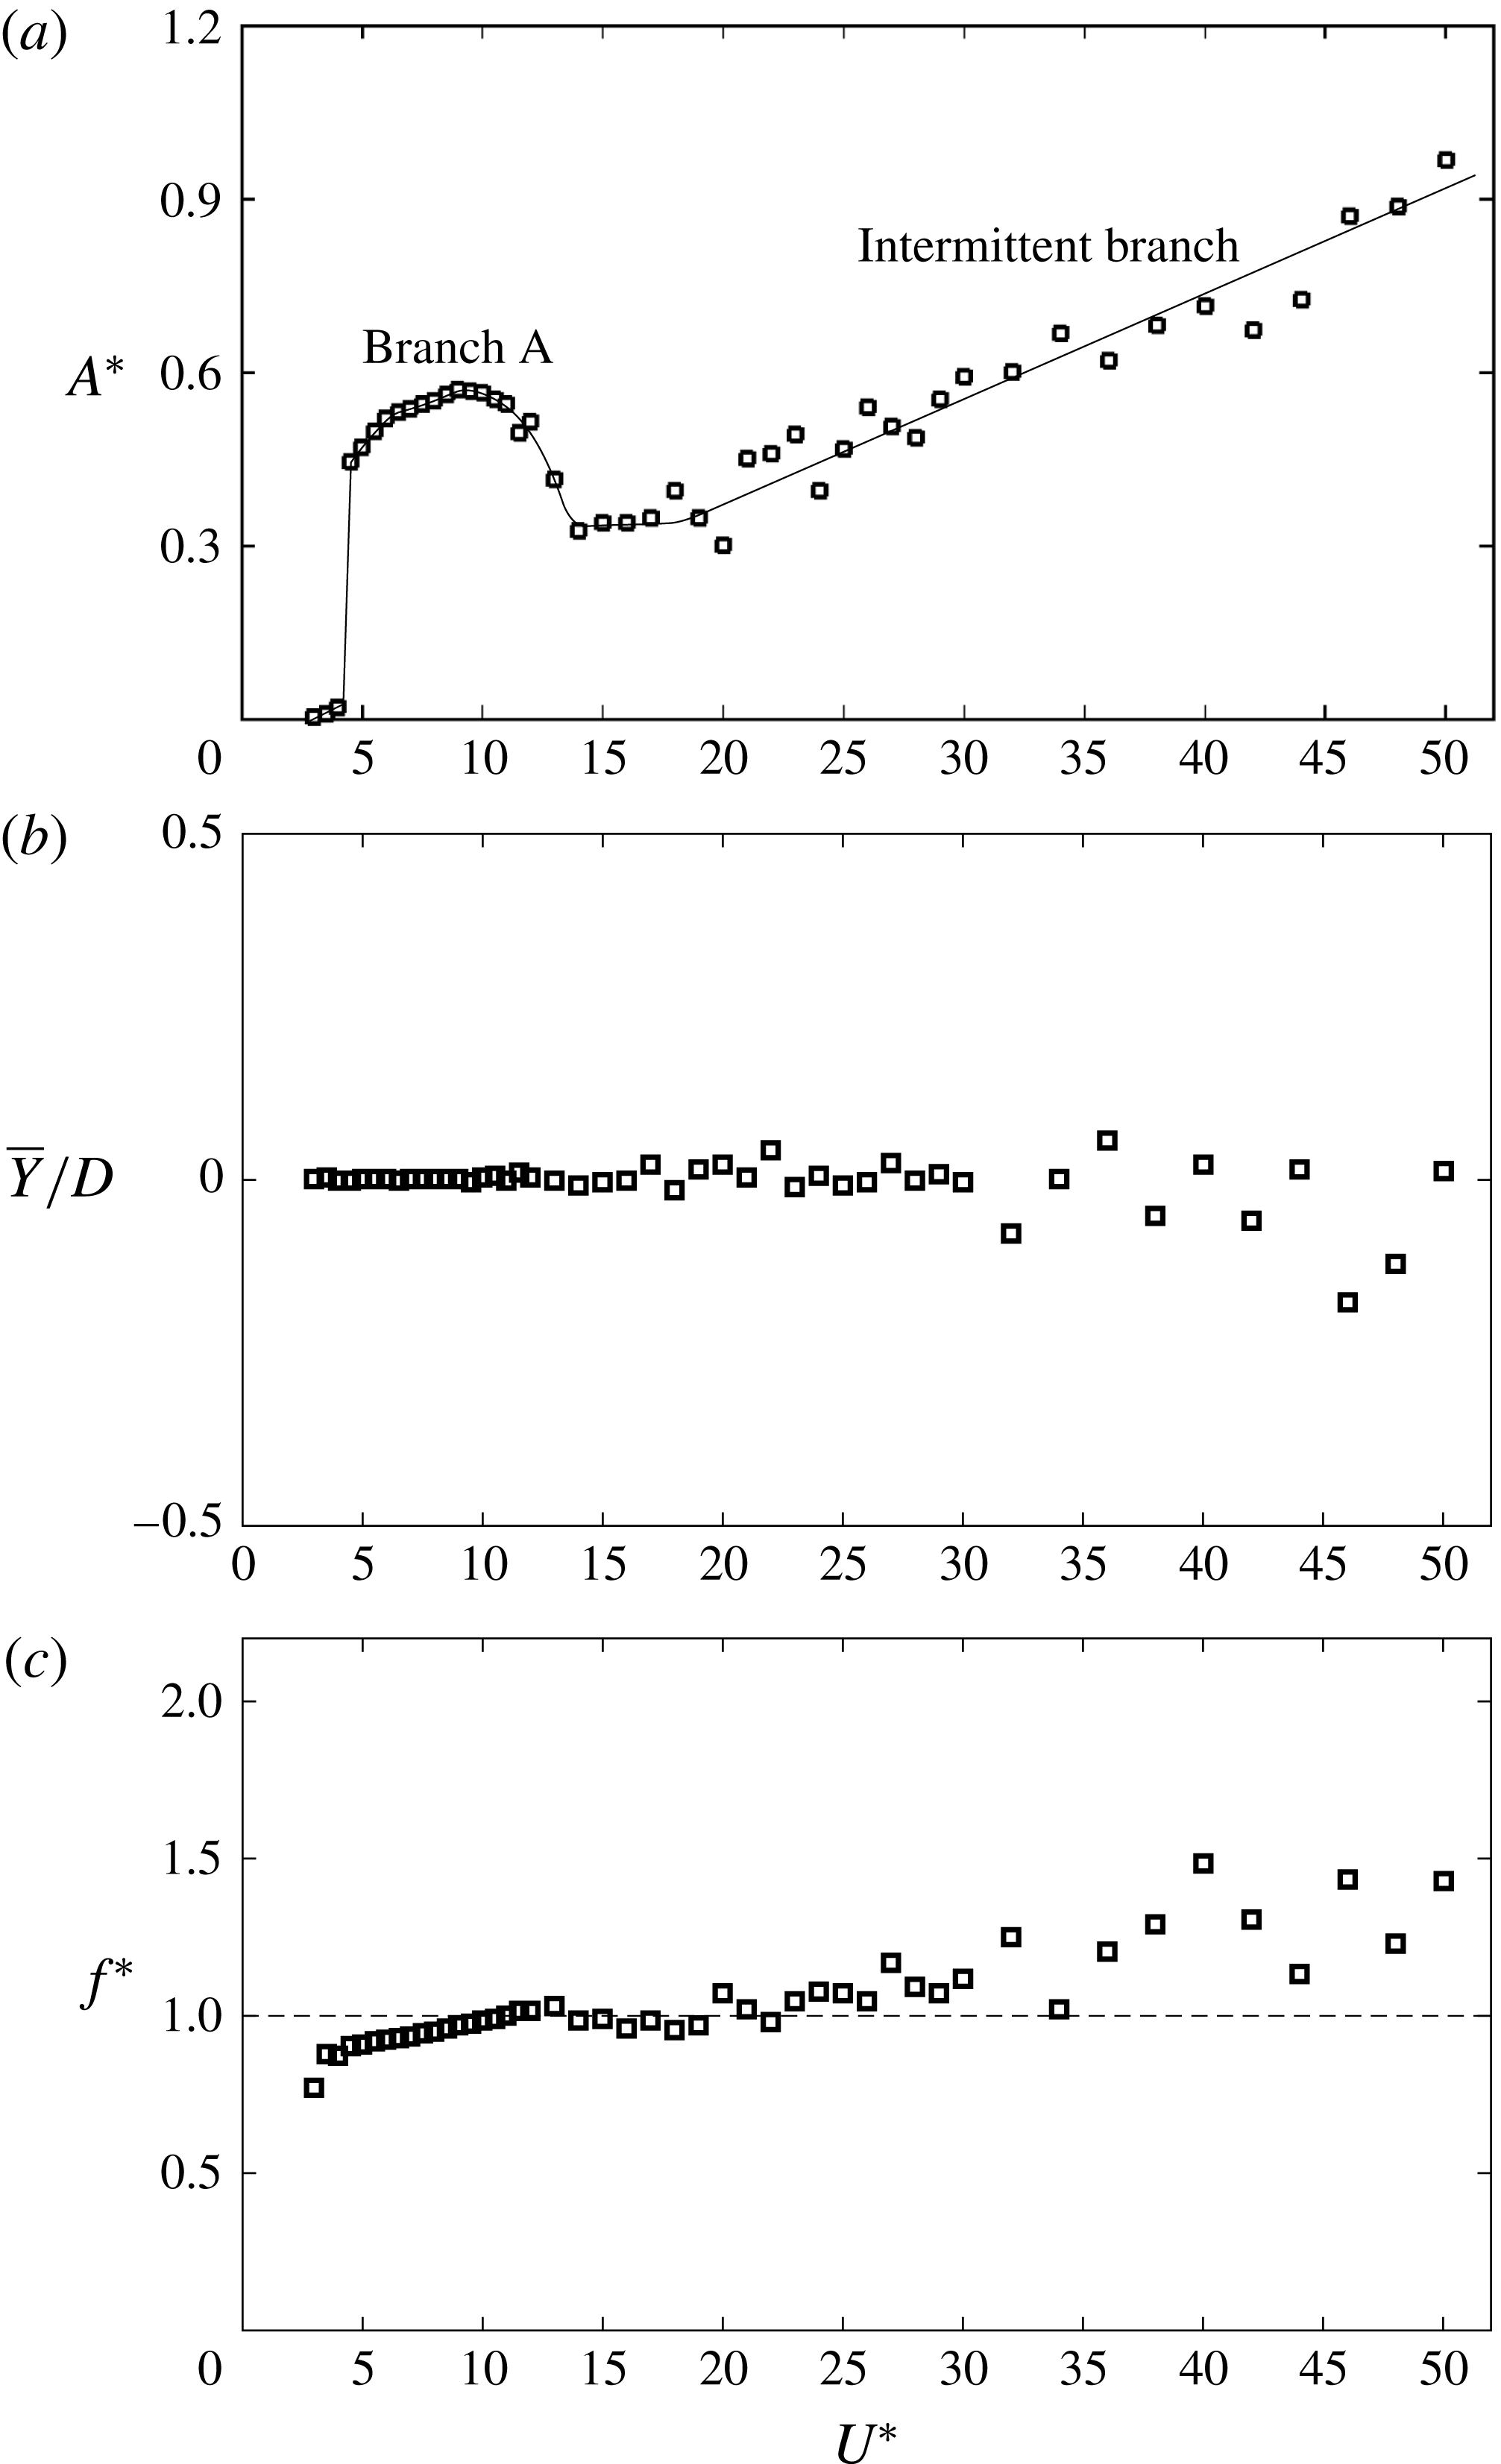
Figure 17 shows the characteristics of the FIV response of the sphere at
 $Re=800$
over the reduced velocity range
 $3\leqslant U^{\ast }\leqslant 50$
in terms of the sphere response amplitude,
 $A^{\ast }$
, the time-mean displacement of the sphere,
 $\overline{Y}/D$
, and the frequency ratio,
 $f^{\ast }=f/f_{n}$
. Similarly to the
 $Re=300$
case, the sphere suddenly began to oscillate as the reduced velocity increased to a value of 4.5. The sphere vibration amplitude maintained a bell-shaped curve with a highest oscillation amplitude of
 ${\approx}0.6D$
until
 $U^{\ast }=13$
. Then, the oscillation amplitude increased as the reduced velocity increased from
 $U^{\ast }=14$
to 50, yielding an amplitude of approximately
 $0.9D$
at
 $U^{\ast }=50$
.
Within the reduced velocity range
 $U^{\ast }=4.5$
–13, the sphere vibrated periodically about its initial position (
 $\overline{Y}/D=0$
in this velocity regime; see figure 17
b). Moreover, the amplitude response varied smoothly within this reduced velocity range. The sphere vibration frequency was synchronized with the vortex shedding frequency. Furthermore, it was identical to the natural frequency of the system (
 $f^{\ast }=f/f_{n}=1$
; see figure 17
c). Thus, these are indeed VIVs. This reduced velocity range can be identified as branch A introduced for the simulations at
 $Re=300$
. Moreover, branch A shows some aspects of behaviour similar to those seen in mode I and II vibrations observed in previous experimental studies. This will be elaborated later in the section discussing force measurements.
Response of an elastically mounted (on
 $y$
only) sphere as a function of the reduced velocity,
 $U^{\ast }$
, at
 $Re=800$
and
 $m^{\ast }=2.865$
: (a) sphere oscillation amplitude,
 $A^{\ast }=\sqrt{2}Y_{rms}/D$
, (b) time-averaged non-dimensional sphere displacement,
 $\overline{Y}/D$
, (c) sphere oscillation frequency normalized by the system natural frequency,
 $f^{\ast }=f/f_{n}$
.
Variation of the sphere response amplitude and the periodicity of the response,
 $\unicode[STIX]{x1D706}_{A}=\sqrt{2}Y_{rms}/Y_{max}$
, with the reduced velocity,
 $U^{\ast }$
.

Comparison of the dominant sphere oscillation frequency with the dominant vortex shedding frequency and the natural frequency of the system in branch A and the intermittent branch.

In contrast to the smooth amplitude response curve for
 $U^{\ast }=4.5$
–13, the measured r.m.s. amplitudes were scattered, with an overall increasing trend for
 $U^{\ast }\geqslant 14$
. This scatter is presumably due to insufficient sampling times for the amplitude signal. Moreover, for reduced velocities
 $U^{\ast }\geqslant 14$
, the sphere oscillations were not periodic as at lower reduced velocities. The periodicity of the amplitude response (Govardhan & Williamson Reference Govardhan and Williamson2005) is defined as
 $\unicode[STIX]{x1D706}_{A}=\sqrt{2}Y_{rms}/Y_{max}$
, where
 $Y_{max}$
is the maximum oscillation amplitude observed at each
 $U^{\ast }$
. According to this definition, the periodicity takes values between 0 and 1, with
 $\unicode[STIX]{x1D706}_{A}=1$
for purely sinusoidal signals. Figure 18 shows the variation of the periodicity of the sphere response with the reduced velocity. As can be seen from figure 18(b), for
 $U^{\ast }=4.5$
–11.5, the sphere response was purely sinusoidal. However, as
 $U^{\ast }$
was increased beyond 12, the sinusoidal nature of the signal decreased and the periodicity of the response dropped dramatically to a value of
 ${\approx}0.5$
at
 $U^{\ast }=14$
. For
 $U^{\ast }\geqslant 14$
, the sphere response was highly aperiodic. However, the periodicity of the response remained close to 0.5, although showing a slightly decreasing trend as the reduced velocity increased from
 $U^{\ast }=14$
. In this regime, the periodicity was also scattered, similarly to the amplitude response. Furthermore, the time-mean position of the sphere was scattered around the initial position of the sphere. These observations indicate that the sphere oscillation response was chaotic for
 $U^{\ast }\geqslant 14$
. However, in this regime, the main oscillation frequency component of the sphere was close to the natural frequency of the system, albeit it was not synchronized with the main vortex shedding frequency (see figures 17
c and 19). Thus, the vibration state in the intermittent branch is not VIV.
The vibrations observed in the intermittent branch resembled the mode IV vibration discovered by Jauvtis et al. (Reference Jauvtis, Govardhan and Williamson2001) with a tethered sphere of
 $m^{\ast }=80$
for
 $U^{\ast }\geqslant 100$
in wind-tunnel experiments. Even through Jauvtis et al. observed mode IV vibration with a high-mass-ratio sphere for very large reduced velocities (
 $U^{\ast }\geqslant 100$
), surprisingly, a very similar response was observed with a small-mass-ratio sphere and for quite low reduced velocities (
 $U^{\ast }\leqslant 14$
) at
 $Re=800$
. This may be an effect of zero structural damping, and it seems possible that an increased damping may reduce or even suppress these randomly induced vibrations.
The sphere response at
 $Re=800$
was much closer to that observed in experimental studies than the response at
 $Re=300$
. However, at
 $Re=800$
, intermittent vibrations (mode IV) were observed directly after the initial vibration response branch without an intervening range of mode III vibration. Again, this may be due to the effect of (zero) damping ratio, mass ratio or even Reynolds number.
Govardhan & Williamson (Reference Govardhan and Williamson2005) recognized that the streamwise vortex pair of a sphere creates a lift force analogous to aircraft trailing vortices. As the direction of the streamwise vortices switches according to the two-sided hairpin structures behind the sphere, it creates a periodic lift force that leads to vibration of the sphere and synchronization. Hence, VIV of a sphere (or other such three-dimensional bodies) can occur due to the streamwise trailing vortex pair formed behind it. According to Govardhan & Williamson (Reference Govardhan and Williamson2005), all of the first three modes of vibrations (modes I, II and III) occur due to the synchronization of sphere displacement with the vortex force (or streamwise vortex structures). Govardhan & Williamson showed that the sphere vibration phase aligns with the vortex force in mode I and lags in phase with the vortex force in mode II. Moreover, they observed multiple vortex loops shed per sphere vibration cycle in mode III. The mode III vibration state was identified as moment-induced vibration. It is possible that this state may not appear at low Reynolds numbers, or that it requires a higher mass ratio or a non-zero damping to stabilize it. This is difficult to investigate in a numerical parameter study because increase in the mass ratio requires considerably longer integration times to reach an asymptotic state.
Effect of the Reynolds number on the sphere response amplitude: ● at
 $Re=300$
, ▫ at
 $Re=800$
, ▵ experimental results from Sareen et al. (Reference Sareen, Zhao, Lo Jacono, Sheridan, Hourigan and Thompson2018) with no sphere rotation, for which the Reynolds number varies between
 $Re\simeq 5\,000$
and 30 000 over this
 $U^{\ast }$
range. (For the latter study,
 $m^{\ast }=14.2$
and the mass damping parameter
 $m^{\ast }\unicode[STIX]{x1D701}=0.0207$
.)

The recent experimental study of Sareen et al. (Reference Sareen, Zhao, Lo Jacono, Sheridan, Hourigan and Thompson2018) investigated the effect of sphere rotation on VIV of a sphere that is free to oscillate in the cross-flow direction. The amplitude responses of the sphere at Reynolds numbers of 300 and 800 are compared with the experimental results of Sareen et al. (Reference Sareen, Zhao, Lo Jacono, Sheridan, Hourigan and Thompson2018) for the case of a sphere with zero rotation in figure 20. At this point, it worth mentioning that there is a slight difference between our numerical study and previous experimental studies. In this study, the Reynolds number of the flow was kept constant while varying the spring constant to vary the reduced velocity. However, in experimental studies, the reduced velocity is generally varied by adjusting the flow velocity. Thus, the Reynolds number also varies with the reduced velocity. The Reynolds number in the study by Sareen et al. (Reference Sareen, Zhao, Lo Jacono, Sheridan, Hourigan and Thompson2018) was varied between 5 000 and 30 000. As can be seen from figure 20, at low reduced velocities (
 $U^{\ast }\leqslant 17$
), the peak sphere response amplitude increases with increasing Reynolds number. The shape of the amplitude response curves varies successively from
 $Re=300$
to 800 to higher Reynolds numbers. In particular, as the Reynolds number is increased, the transition from mode I to mode II in this branch is relatively clear even at
 $Re=800$
. At
 $Re=300$
, there is no indication of mode II response before reaching the end of the branch.
Comparison of the amplitude responses for Reynolds numbers of 800 and 300 shows a higher response amplitude at
 $Re=800$
at each reduced velocity. In addition, the range of reduced velocities that show large-amplitude periodic vibration (branch A) is widened as the Reynolds number is increased from
 $Re=300$
to 800. Moreover, at higher reduced velocities, the sphere response shows aperiodic intermittent vibrations (mode IV) at
 $Re=800$
, while it shows periodic vibrations with a very small amplitude at
 $Re=300$
. Unsurprisingly, these observations show the strong effect of the Reynolds number on FIV.
5.2 Force measurements at
$Re=800$

At the beginning of branch A (
 $4.5\leqslant U^{\ast }\leqslant 13$
), where the sphere vibrations are purely sinusoidal, the force components were also sinusoidal, as shown in figure 21(a) at
 $U^{\ast }=6$
. Not only the transverse force component in the
 $y$
direction but also the streamwise force component fluctuated with a significant oscillation amplitude. Moreover, the frequency of the streamwise force was twice the transverse frequency. Therefore, if the sphere were allowed to move in the streamwise direction, it would show streamwise vibration with a small oscillation amplitude, as reported in Govardhan & Williamson (Reference Govardhan and Williamson2005). In this regime, the force in the
 $z$
direction oscillated with a negligible amplitude compared with the force in the
 $y$
direction. Towards the end of this reduced velocity range, the drag and lift forces in the
 $y$
direction were less sinusoidal, yet still showed a strong periodic component, as shown in figure 21(b) at
 $U^{\ast }=12$
.
The time histories of the drag and lift (in the
 $y$
and
 $z$
directions) force coefficients,
 $C_{d}$
,
 $C_{ly}$
and
 $C_{lz}$
respectively, in branch A (a,b) and the intermittent branch (c,d) for 20 cycles of sphere vibration: (a)
 $U^{\ast }=6$
, (b)
 $U^{\ast }=12$
, (c)
 $U^{\ast }=30$
and (d)
 $U^{\ast }=46$
.

Variation of the total and vortex phases (
 $\unicode[STIX]{x1D719}_{total}$
and
 $\unicode[STIX]{x1D719}_{vortex}$
) with
 $U^{\ast }$
at
 $Re=800$
over branch A.

The relationship between the total force in the
 $y$
direction,
 $C_{total}$
, and the vortex force in the
 $y$
direction,
 $C_{vortex}$
, in branch A: (a) at
 $U^{\ast }=5$
and (b) at
 $U^{\ast }=12$
.

Power spectrum of the sphere response,
 $Y/D$
, total force,
 $C_{total}$
, and vortex force,
 $C_{vortex}$
, in branch A: (a) at
 $U^{\ast }=5$
and (b) at 12.

In branch A, the displacement signal of the sphere was locked to both the total and the vortex force signals (see figures 23 and 24). Figure 22 shows the variation of the total phase,
 $\unicode[STIX]{x1D719}_{total}$
, and the vortex phase,
 $\unicode[STIX]{x1D719}_{vortex}$
, with the reduced velocity up to
 $U^{\ast }=20$
. The vortex phase rises up to
 $180^{\circ }$
over the first part of branch A, consistent with the mode I behaviour seen in experiments (see figure 23
a). The total phase rises towards
 $180^{\circ }$
towards the end of the branch, which is also seen experimentally in the mode II region (also see figure 23
b). For low-mass-ratio tethered spheres, there is also distinct change in the frequency response across the mode I to mode II transition (Govardhan & Williamson Reference Govardhan and Williamson2005), clearly seen for
 $m^{\ast }=0.76$
, that is not seen here. It is not clear whether this is masked by the higher mass ratio of these simulations, which would mean that any frequency jump would be smaller.
Figure 25 displays the drag and lift (in the
 $y$
and
 $z$
directions) force coefficients in terms of time-mean values and r.m.s. of the fluctuating components. Similarly to the
 $Re=300$
case, the time-mean drag force coefficient suddenly increases by
 ${\approx}60\,\%$
from its pre-oscillatory value as soon as branch A vibration starts at
 $U^{\ast }=4.5$
(see figure 25
a). This increment decreases with the reduced velocity in the branch A regime and returns to the pre-oscillatory value at the end of the range. Similarly to
 $\overline{C}_{d}$
, the fluctuation amplitudes of both the drag force and the lift force in the
 $y$
direction show sudden jumps at the beginning of branch A, and then that increment decreases with increasing
 $U^{\ast }$
over branch A (see figure 25
b,d). These observations are consistent with the
 $Re=300$
case as well as with the experimental study of Sareen et al. (Reference Sareen, Zhao, Lo Jacono, Sheridan, Hourigan and Thompson2018).
In branch A,
 $C_{ly,rms}$
decreases rapidly as the reduced velocity increases. However, as
 $U^{\ast }$
passes beyond
 $11.5$
,
 $C_{ly,rms}$
begins to increase again and asymptotes to a value of
 $0.06$
at the end of the range. Simultaneously,
 $C_{lz,rms}$
also begins to increase towards the end of branch A and reaches a value of
 ${\approx}0.06$
. These observations again show a smooth transition between branch A and the intermittent branch.
Variation of the time-mean force coefficients (a,c,e) and the r.m.s. of the fluctuation components of the force coefficients (b,d,f) in the
 $x$
,
 $y$
and
 $z$
directions with the reduced velocity,
 $U^{\ast }$
, at
 $Re=800$
. The drag force is measured in the
 $x$
direction and the lift forces are measured in the
 $y$
and
 $z$
directions.

5.2.1 Intermittent branch
For the intermittent branch (
 $U^{\ast }\geqslant 14$
), no significant variation was observed for either the time-mean or the fluctuation force components with the reduced velocity. The mean drag coefficient,
 $\overline{C}_{d}$
, was flat at the pre-oscillatory value, while
 $\overline{C}_{ly}$
and
 $\overline{C}_{lz}$
were almost zero, as for branch A (see figure 25). All three force components showed a small fluctuation over the intermittent branch. In particular,
 $C_{d,rms}$
was
 ${\approx}0.02$
, while both
 $C_{ly,rms}$
and
 $C_{lz,rms}$
were
 ${\approx}0.06$
. The time histories of the forces in the intermittent branch for approximately 20 sphere oscillation cycles are shown in figures 21(c) and 21(d) at
 $U^{\ast }=30$
and 46 respectively. As can be seen, the forces were neither periodic nor locked in with the sphere vibration. Therefore, the intermittent vibration branch (mode IV) cannot be described by the classic lock-in theory, but nevertheless represents a response of substantial magnitude. Again, this intermittent response may be enhanced by the zero damping applied to the current set of simulations.
5.3 Wake structures at
$Re=800$

As Sakamoto & Haniu (Reference Sakamoto and Haniu1990) also found, the wake observed for a stationary sphere at
 $Re=800$
was irregular in strength and frequency (see figure 26). The wake became regular as soon as the sphere began to vibrate at
 $U^{\ast }=4.5$
. For branch A, similarly to the
 $Re=300$
case, the wake was formed with two streets of equal strength vortex loops, as shown in figure 27 at
 $U^{\ast }=6$
. The vortical structures were clearly two-sided hairpin loops near the sphere. However, as they moved downstream, the hairpin structures transformed into rings. Similarly to the
 $Re=300$
case, a tail was attached to each vortex loop. The vortex loops were slightly twisted in the
 $z$
direction; this may be due to the small-amplitude periodic force observed to occur in the
 $z$
direction in this regime. The sphere response and force measurements showed a smooth transition between branch A and the intermittent branch, as discussed in the previous two sections. However, the vortex structures were regular and the vortex shedding frequency was locked in with the sphere vibration frequency until the end of branch A.
Instantaneous wake structure of a stationary sphere at
 $Re=800$
.

Instantaneous wake structure in branch A (depicted at
 $U^{\ast }=6$
) at
 $Re=800$
.

Instantaneous wake structures characteristic of the intermittent branch (depicted at
 $U^{\ast }=30$
) and at
 $Re=800$
for a sphere starting at its lowest point and moving upwards over four consecutive steps.

In the intermittent branch (mode IV), where the sphere showed intermittent vibration, the wake was irregular in strength and frequency. Several vortex loops were observed during an oscillation cycle. Figure 28 shows wake structures, at five consecutive times during a cycle, observed at
 $U^{\ast }=30$
, for which the sphere vibrated with a large amplitude. In particular, the top wake structure in figure 28 was captured when the sphere was at its lowest point, while the last structure was captured when the sphere next returned to its lowest point. As can be seen, the sphere vibration was not locked in with the vortex shedding. For the intermittent branch, the vortex loop formation appeared to be chaotic, as was the sphere response.
6 Conclusions
The VIV of a sphere restricted to move in a transverse direction (
 $y$
direction) was studied numerically at
 $Re=300$
and 800 over the reduced velocity ranges
 $U^{\ast }\in [3.5{-}100]$
and
 $[3{-}50]$
respectively for a sphere of mass ratio
 $m^{\ast }=2.865$
. It was found that the effect of varying Reynolds number on FIV was significant, with the higher-Reynolds-number simulations showing more similarities with typical higher-Reynolds-number experimental responses.
At
 $Re=300$
, highly periodic and large-amplitude sphere vibration was observed within the reduced velocity range
 $U^{\ast }\in [5.5{-}10]$
. The sphere response amplitude curve,
 $A^{\ast }$
–
 $U^{\ast }$
, was approximately bell-shaped with a maximum oscillation amplitude of
 $0.4D$
. Over this range, the sphere oscillated at the natural frequency of the system, which also corresponded to the vortex shedding frequency, indicative of VIV. This large-amplitude VIV response was named branch A. This branch showed some similarity to the mode I state observed by Govardhan & Williamson (Reference Govardhan and Williamson2005), at least in terms of the jump in vortex phase over the initial part of the branch. The response curve was also similar to that observed by Behara et al. (Reference Behara, Borazjani and Sotiropoulos2011) in their numerical investigation of 3-DOF sphere VIV at the same Reynolds number and similar mass ratio (
 $m^{\ast }=3.8197$
) in the reduced velocity range
 $U^{\ast }\in [4{-}9]$
. Indeed, the effect of mass ratio on VIV response amplitude was found to be negligible (less than 2 %) for the range
 $1.2\leqslant m^{\ast }\leqslant 10$
. On increasing the Reynolds number to 800, a similar resonant response was observed within a wider reduced velocity range,
 $U^{\ast }\in [4.5{-}13]$
, but with an increased maximum amplitude of
 ${\sim}0.6D$
. Compared with the case of
 $Re=300$
, the sphere response amplitude was substantially higher and the synchronization regime was wider. Towards maximal response, the total phase also increased, consistent with the switch to mode II observed in experiments. However, no detectable jump in the frequency response was observed across the branch, as observed in low-mass-ratio experiments, where there is a distinct change in the frequency response at the transition.
At both
 $Re=300$
and 800, within branch A, a lift coefficient with a large fluctuation amplitude was observed in the direction of sphere motion. The fluctuating lift and drag coefficients both decreased with increasing reduced velocity. The magnitude of the mean drag coefficient also displayed the same trend as the fluctuating drag coefficient. Two streets of hairpin-type vortex loops were shed behind the sphere as it oscillated, with tails attached to each loop oriented in the streamline direction. This wake structure strongly resembled that observed by Govardhan & Williamson (Reference Govardhan and Williamson2005) for mode I and II vibrations, as well as the hairpin-type wake observed by Behara et al. (Reference Behara, Borazjani and Sotiropoulos2011).
As the reduced velocity was increased beyond the branch A regime, the sphere response was highly dependent on the Reynolds number. For
 $Re=300$
, over the reduced velocity ranges
 $U^{\ast }\in [13{-}16]$
and
 $[26{-}100]$
, the sphere vibrated at only a small amplitude (one order of magnitude less than seen in branch A). These states were named branches B and C respectively. In branch B, the sphere vibrated periodically at the system frequency. However, its time-mean position moved away from its initial position as a result of the non-zero mean lift force in the
 $y$
direction due to wake asymmetry. The alignment of the total lift was found to vary from the
 $y$
direction by
 ${\sim}50^{\circ }$
as the sphere vibration changed from branch A to branch B. This was matched by a change in the orientation of the vortical structures in the wake. The branch B wake resembled that of a rigidly mounted sphere with interconnected vortex loops. Based on these observations, branch B appears to be different from mode II observed in experimental studies, although there do seem to be similarities to the mode II oscillation.
For branch C, the sphere response was also periodic. However, besides the dominant frequency, the response showed an overlaid long-period oscillation. The dominant sphere vibration frequency was synchronized with the vortex shedding frequency. However, it was not close to the natural frequency of the system, as it was for branches A and B, but instead close to half of the vortex shedding frequency for a stationary sphere. The sphere oscillated about a mean position shifted from its branch A position. The shift increased as the reduced velocity was increased, reaching a value of
 $5D$
at
 $U^{\ast }=100$
. Physically, this shift can be associated with the reduction of spring stiffness as the reduced velocity is increased. A hairpin-type wake was observed for branch C as well. However, the vortex loops were more stretched in the streamwise direction due to the low frequency of shedding. Moreover, the vortex loops were one-sided.
At
 $Re=800$
, the sphere was found to vibrate intermittently over the reduced velocity range
 $U^{\ast }\in [14{-}50]$
immediately after branch A. This vibration state was named the intermittent branch. Even though the sphere response was aperiodic, interestingly, its main vibration frequency component was close to the natural frequency of the system. However, it was not locked in with the vortex shedding frequency, indicating a non-VIV response. The measured r.m.s. sphere response amplitudes were scattered, but with a linear increasing trend over this reduced velocity range. This sphere response resembles the aperiodic mode IV vibration discovered by Jauvtis et al. (Reference Jauvtis, Govardhan and Williamson2001) at higher reduced velocities for a heavy sphere (
 $U^{\ast }>100$
and
 $m^{\ast }=80$
). There was no sign of mode III occurring prior to the onset of the mode IV vibrations found in previous experimental studies. This may be an effect of the zero-damping ratio, possibly coupled with the lower mass ratio/Reynolds number. In the intermittent branch regime, the time-mean drag coefficient was flat at the pre-oscillatory value while the time-mean lift coefficient was almost zero. A small fluctuation was observed in the lift coefficients for the
 $y$
and
 $z$
directions and for the drag coefficient. In the wake, multiple vortices were shed during each sphere oscillation cycle. Moreover, the vortex shedding was irregular in strength and frequency, as for a stationary sphere at
 $Re=800$
. Therefore, the generation of this aperiodic vibration appeared to be a random process made possible by the large difference between the system and shedding frequencies.
With these observations, we can conclude that the characteristics of FIV of a sphere are highly dependent on the Reynolds number, particularly at high reduced velocities. At the higher Reynolds number studied of
 $Re=800$
, the initial oscillatory response branch bore a much stronger similarity to the response observed in the experimental studies of Sareen et al. (Reference Sareen, Zhao, Lo Jacono, Sheridan, Hourigan and Thompson2018) for a low-mass-damped 1-DOF elastically mounted sphere, but at Reynolds numbers more than an order of magnitude greater. The non-occurrence of mode III oscillations is puzzling, but the zero-system damping may contribute to this. It would be interesting to see how increased damping and mass ratio affect the response in the corresponding reduced velocity range.
Acknowledgements
The support from Australian Research Council Discovery Grants DP150102879 and DP170100275, and computing time available through Merit Project Grants n67 and d71 through the National Computational Infrastructure (NCI) and Pawsey Supercomputing Centre are gratefully acknowledged.



