Implications
Polymorphisms in the porcine proprotein convertase subtilisin/kexin type 1 (PCSK1) gene are associated with several economic traits including obesity-related traits, such as backfat thickness and visible intermuscular fat and cathepsin B activity. Exploitation of PCSK1 variants in pig breeding programmes is promising, providing that breed-specific effects are considered and further investigated.
Introduction
Fat deposition is a key issue in pig breeding as it affects production efficiency, consumer acceptance of pork, pork quality and suitability of pork for processing (Russo and Nanni Costa, Reference Russo and Nanni Costa1995). A large number of studies have reported quantitative trait loci (QTL) for different fat deposition traits in pigs (Hu and Reecy, Reference Hu and Reecy2007; Rothschild et al., Reference Rothschild, Hu and Jiang2007). Furthermore, analyses of candidate genes for fat deposition derived from studies in humans and mice have allowed the identification of several gene polymorphisms associated with fatness in different pig lines and breeds. Mutations in several human genes have shown important roles in determining or conferring risks of obesity and obesity-related traits (such as diabetes, cardiovascular diseases, etc.). Polymorphisms in the homologous pig genes have been associated with fatness and several other production and carcass traits. For example, among these genes it is worth mentioning a missense mutation in the melanocortin 4 receptor (MC4R) gene, which is associated with feed intake and backfat thickness (BFT) in several pig lines/breeds (Kim et al., Reference Kim, Larsen, Short, Plastow and Rothschild2000; Houston et al., Reference Houston, Cameron and Rance2004; Bruun et al., Reference Bruun, Jørgensen, Nielsen, Andersson and Fredholm2006; Fan et al., Reference Fan, Onteru, Plastow and Rothschild2009c). More recently, polymorphisms in the FTO (Fan et al., Reference Fan, Du and Rothschild2009a; Fontanesi et al., Reference Fontanesi, Scotti, Buttazzoni, Davoli and Russo2009 and Reference Fontanesi, Scotti, Buttazzoni, Dall'Olio, Bagnato, Lo Fiego, Davoli and Russo2010b), CTSK (Fontanesi et al., Reference Fontanesi, Scotti, Buttazzoni, Dall'Olio, Davoli and Russo2010c), TBC1D1 (Fontanesi et al., Reference Fontanesi, Colombo, Tognazzi, Scotti, Buttazzoni, Dall'Olio, Davoli and Russo2011a), TCF7L2 (Du et al., Reference Du, Fan, Zhao, Amoako and Rothschild2009) and TRIB3 (Fontanesi et al., Reference Fontanesi, Colombo, Scotti, Buttazzoni, Bertolini, Dall'Olio, Davoli and Russo2010a) genes among several others (Fan et al., Reference Fan, Onteru, Nikkilä, Stalder and Rothschild2009b; Switonski et al., Reference Switonski, Stachowiak, Cieslak, Bartz and Grzes2010) are associated with fat deposition traits in different pig breeds.
Another interesting candidate gene is the proprotein convertase subtilisin/kexin type 1 (PCSK1) gene. This gene encodes the prohormone convertase 1/3 enzyme that belongs to the subtilisin-like proprotein convertase family. PCSK1 is mainly expressed in neuroendocrine cells and its main function is to process prohormones into functional hormones that in turn regulate central and peripheral energy metabolism. In particular, this enzyme cleaves proinsulin, proopiomelanocortin, prorenin, proenkephalin, prodynorphin, prosomatostatin and progastrin, generating their corresponding bioactive peptides (Steiner et al., Reference Steiner, Rouillé, Gong, Martin, Carroll and Chan1996; Muller and Lindberg, Reference Muller and Lindberg1999; Zhu et al., Reference Zhu, Zhou, Dey, Norrbom, Carroll, Zhang, Laurent, Lindberg, Ugleholdt, Holst and Steiner2002; Scamuffa et al., Reference Scamuffa, Calvo, Chrétien, Seidah and Khatib2006). In addition, PCSK1 is required for processing the pre-pro-ghrelin into ghrelin in the gastric mucosa (Zhu et al., Reference Zhu, Cao, Voogd and Steiner2006). Ghrelin is involved in the control of feed intake and energy metabolism. This polypeptide is secreted from the stomach and circulates in the bloodstream under fasting conditions, transmitting a hunger signal from the periphery to the central nervous system (Kojima and Kangawa, Reference Kojima and Kangawa2005). In pigs, forced weaning practices of most modern production systems cause a period of voluntary feed deprivation and weight loss (Forbes, Reference Forbes1995) that represents an interesting model to evaluate the endocrine adaptation to the food deprivation response that involves the PCSK1-ghrelin control and regulation (Salfen et al., Reference Salfen, Carroll and Keisler2003).
As a proof of the important role of PCSK1 for the endocrine system, rare mutations in the human PCSK1 gene cause severe monogenic obesity (Jackson et al., Reference Jackson, Creemers, Ohagi, Raffin-Sanson, Sanders, Montague, Hutton and O'Rahilly1997; Farooqi et al., Reference Farooqi, Volders, Stanhope, Heuschkel, White, Lank, Keogh, O'Rahilly and Creemers2007). Common nonsynonymous variants in this gene confer risk of obesity in different human cohorts (Benzinou et al., Reference Benzinou, Creemers, Choquet, Lobbens, Dina, Durand, Guerardel, Boutin, Jouret, Heude, Balkau, Tichet, Marre, Potoczna, Horber, Le Stunff, Czernichow, Sandbaek, Lauritzen, Borch-Johnsen, Andersen, Kiess, Körner, Kovacs, Jacobson, Carlsson, Walley, Jørgensen, Hansen, Pedersen, Meyre and Froguel2008; Kilpeläinen et al., Reference Kilpeläinen, Bingham, Khaw, Wareham and Loos2009; Chang et al., Reference Chang, Chiu, Shih, Lin, Sheu, Donlon, Curb, Jou, Chang, Li and Chuang2010; Heni et al., Reference Heni, Haupt, Schäfer, Ketterer, Thamer, Machicao, Stefan, Staiger, Häring and Fritsche2010; Qi et al., Reference Qi, Li, Loos, Liu, Hu, Wu, Yu and Lin2010). Similar effects have been observed in mice in which a missense mutation leads to obesity, abnormal proinsulin processing and multiple endocrinological defects (Lloyd et al., Reference Lloyd, Bohan and Gekakis2006).
On the basis of these lines of evidence reported in humans and mice, we selected the porcine PCSK1 gene as a candidate gene for fat deposition and production traits in pigs. We re-mapped and re-sequenced this gene, identified polymorphisms, elaborated sequence information, analysed gene expression and showed that the porcine PCSK1 gene is associated with fat deposition and several other production traits in different Italian heavy pig breeds/lines.
Material and methods
Animals
All procedures involving animals followed Italian and European Union regulations for animal care and slaughtering or, if requested by the Italian legislation, were approved by the Ethical Commission of the University of Bologna for animal experiments.
The association study was conducted on five groups (1 to 5) of pigs from three different experimental approaches (a, b and c), as defined and listed below, for a total of 1221 animals.
The first four groups (1 to 4) included performance-tested pigs grown at the Test Station of the National Pig Breeder Association (ANAS). Performance test was conducted on triplets of siblings from the same litter (two females and one castrated male). Data were used for the genetic evaluation of a male from the same litter (sib-testing).
Experimental design ‘a’. Of these four groups of animals, two were not selected by any phenotypic or genotypic criteria (random groups).
(1-a) One of them was made up of 271 Italian Large White (ILW) pigs (180 females and 91 castrated males, from 78 different sires; Fontanesi et al., Reference Fontanesi, Davoli, Nanni Costa, Beretti, Scotti, Tazzoli, Tassone, Colombo, Buttazzoni and Russo2008b). Pigs of this group were slaughtered over 6 different days in 2002.
(2-a) The other random group was made up of 197 Italian Duroc (ID) pigs (128 females and 69 castrated males, from 91 different sires) slaughtered at 33 different days in the years 1995 to 2003.
Experimental design ‘b’. Two other groups came from the most extreme and divergent estimated breeding values (EBVs) for: (3-b) BFT (ILW); and (4-b) visible intermuscular fat (VIF; ID) among performance-tested pigs.
(3-b) ILW pigs were all females (n = 560) with no common parents, selected among ∼12 000 performance-tested pigs of this breed in the period 1995 to 2007 (280 with the lowest BFT EBV, mean and s.d. = −9.40 ± 1.60 mm; and 280 with the highest BFT EBV, mean and s.d. = +8.00 ± 5.95 mm).
(4-b) The group of ID consisted of 100 pigs (58 females and 42 castrated males from 62 different sires) selected among 1225 pigs of that breed (evaluated in same period 1996 to 1999; Fontanesi et al., Reference Fontanesi, Scotti, Buttazzoni, Davoli and Russo2009 and Reference Fontanesi, Scotti, Speroni, Buttazzoni and Russo2011b): 50 with the most negative (−2.35 ± 0.27) and 50 with the most positive VIF EBV (+2.17 ± 0.34). Details about traits and method of EBV calculation are reported below.
Experimental design ‘c’. (5-c) The fifth group was made up of 93 weaning pigs (ILW × Italian Landrace; 22 females and 71 castrated males) for which growth performances and feed intake were recorded during a trial of tryptophan supplementation in the diet with or without oral challenge with Escherichia coli K88 (Bosi et al., Reference Bosi, Gremokolini, Trevisi, Mazzoni, Bonilauri, Sarli and Casini2004; Trevisi et al., Reference Trevisi, Melchior, Mazzoni, Casini, De Filippi, Minieri, Lalatta-Costerbosa and Bosi2009; Trevisi et al., Reference Trevisi, Corrent, Messori, Casini and Bosi2010). This latter group of pigs was also used for quantitative PCSK1 gene expression analysis in the gastric oxyntic mucosa, considering the particular physiological state in this stressing period in which animals are voluntarily feed deprived.
Another group of 21 unrelated pigs of different breeds for which no phenotypic data were available was used for sequence analysis (sequencing panel; see below). Additional pigs of different breeds (20 Italian Landrace, 22 Belgian Landrace, 18 Hampshire, 30 Casertana and 12 Meishan) were used for allele frequency analysis of three tag single-nucleotide polymorphisms (SNPs). Phenotypic data were not available for these pigs. A castrated male pig of ∼160 kg live weight was used for collection of different tissues for qualitative PCSK1 gene expression analysis.
Genomic DNA was extracted from muscle, blood or hair roots using standard protocols.
Traits
Performance testing started when pigs were 30 to 45 days old and ended when animals reached 155 ± 5 kg live weight. The nutritive level was quasi ad libitum. Feed intake was recorded daily and BW was measured bimonthly, and then the daily gain and feed : gain ratio (FGR) was calculated. At the end of the test, the selected animals from two contiguous batches on trial were mixed at loading and transported to a commercial slaughterhouse located at 24.5 km away from the Test Station. After unloading, pigs were immediately stunned and bled in a lying position. Within 3 h post mortem at the slaughterhouse, BFT at the level of Musculus gluteus medius, weight of lean cuts (LC; necks and loins) and weight of hams were measured. Only for the ID pigs, visual evaluation of intermuscular fat content (VIF) was obtained on leg muscles based on a binary scale (presence/absence). These phenotypic traits were available for performance-tested pigs from the random groups and for the ID used in the selective genotyping experiment. Only for the 271 ILW pigs of the random group, measures of pH1 (at 2 h post mortem), pHu (at 24 h post mortem), glycolytic potential (GP), including glycogen and lactate content (30 min post mortem) and cathepsin B activity (Catb; 24 h post mortem), were obtained on Musculus semimembranosus as previously described (Fontanesi et al., Reference Fontanesi, Davoli, Nanni Costa, Beretti, Scotti, Tazzoli, Tassone, Colombo, Buttazzoni and Russo2008b; Russo et al., Reference Russo, Fontanesi, Scotti, Beretti, Davoli, Nanni Costa, Virgili and Buttazzoni2008). For the ILW of the selective genotyping experiment, only BFT measures were available.
Weaning ILW × Italian Landrace pigs were raised in single boxes at the experimental farm of the University of Bologna. BW and feed intake were measured daily for 2 weeks starting at weaning (21 to 24 days) and the values were averaged for the first and second week, respectively (Trevisi et al., Reference Trevisi, Melchior, Mazzoni, Casini, De Filippi, Minieri, Lalatta-Costerbosa and Bosi2009 and Reference Trevisi, Corrent, Messori, Casini and Bosi2010).
Sequencing and identification of polymorphisms
When we started this study, no complete porcine PCSK1 gene sequence was available in DNA databases. Therefore, BLASTN queries (http://blast.ncbi.nlm.nih.gov/Blast.cgi) with a porcine PCSK1 cDNA sequence (GenBank accession number NM_214038) against porcine sequences (including trace records) deposited in DNA databases were used to retrieve pig PCSK1 genomic sequences corresponding to all recognized exons (according to the comparative information available in human) and parts of intronic regions (data not shown). PCR primers were designed with PRIMER3 (http://fokker.wi.mit.edu/primer3/input.htm) in intronic regions (except for the last gene region) to amplify 14 fragments encompassing exonic sequences (Table S1) from 21 pigs of the sequencing panel (Table 1). PCR was carried out using a PTC-100 (MJ Research, Watertown, MA, USA) thermal cycler in a final volume of 20 μL that included 10 pmol of each primer 2.0 mM MgCl2, 2.5 mM each dNTP, 1 U AmpliBioTherm Taq DNA polymerase (Fisher Molecular Biology, Trevose, PA, USA). The PCR profile was the following: an initial step at 95°C for 5 min; 35 cycles of 30 s at 95°C, 30 s at the appropriate annealing temperature (Table S1) and 30 s at 72°C; the final extension step was for 5 min at 72°C. Sequencing reactions were produced for ExoSAP-IT® (USB Corporation, Cleveland, Ohio, USA)-treated PCR products using the same PCR primers and the Big Dye v3.1 kit (Applied Biosystems, Foster City, CA, USA). Sequencing products were electrophoresed on an ABI3100 Avant sequencer (Applied Biosystems). Using CodonCode Aligner (CodonCode Corporation, Dedham, MA, USA), all sequence chromatograms were aligned and visually inspected to identify polymorphisms.
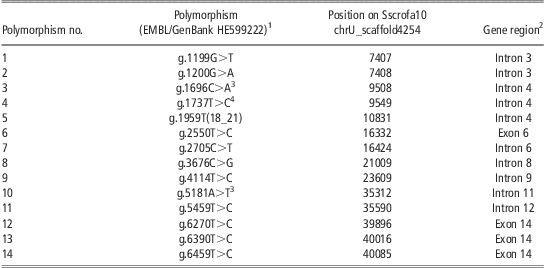
Polymorphisms identified in the porcine PCSK1 gene
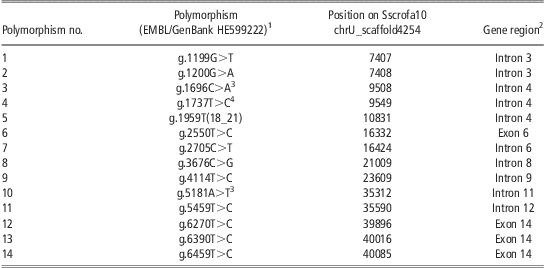
PCSK1 = proprotein convertase subtilisin/kexin type 1; ILW = Italian Large White; IL = Italian Landrace; ID = Italian Duroc; BL = Belgian Landrace; H = Hampshire; M = Meishan; SNP = single-nucleotide polymorphism.
1Haplotypes (H1-9) inferred from the sequencing panel were (in parenthesis are reported the number of haplotype copies observed in the analysed breeds: ILW, IL, ID, BL, H and M; SNP order is as reported in the table excluding the indel, polymorphism no. 5): H1, GGCTTCCTATTTT (5 H, 2 ILW, 1 BL, 1 ID, 1 IL); H2, GGCTTCGTATTTT (2 IL); H3, GGCTTCCTTTTTT (12 ID, 3 ILW, 2 IL); H4, TACTCCGTATTTT (1 IL); H5, GGATTCCTATTTT (1 ILW); H6, GAATTCCTATTTT (4 ILW, 1 BL, 1 ID, 1 M); H7, GGCTTTCTATTTT (2 M); H8, GGCTTCGCACCCC (1 M); H9, GGCCTCGCATCCT (1 H).
2According to the structure of the human PCSK1 gene (Ensembl ENSG00000175426).
3SNPs genotyped and used for association studies.
4SNP genotyped but not useful for association studies because not polymorphic in the analysed populations.
Sequence analyses
Phases including all detected polymorphisms in the sequenced panel were reconstructed with PHASE program version 2.1.1 (Stephens et al., Reference Stephens, Smith and Donnelly2001). Nucleotide diversity (π), haplotype diversity and Tajima's D were estimated using DNASP version 4.10.9 (Rozas et al., Reference Rozas, Sanchez-DelBarrio, Messeguer and Rozas2003). Tajima's D measures whether the observed frequencies of segregating mutations are compatible with the frequencies expected under a standard neutral model. Positive selection or the presence of weakly deleterious mutations, as well as population growth, tend to give an excess of low frequency variants, resulting in negative test values. Balancing selection or population contraction may cause an excess of intermediate variants and positive D values. Significance of the D tests was determined by coalescent simulations (Rozas et al., Reference Rozas, Sanchez-DelBarrio, Messeguer and Rozas2003). Phylogenetic analysis of the identified haplotypes of the PCSK1 gene was conducted with MEGA4 software version 4.0.2 (Tamura et al., Reference Tamura, Dudley, Nei and Kumar2007) with Kimura's two-parameter model and Neighbour Joining (NJ) tree. Standard errors were obtained from 1000 bootstrap replicates. The HAPLOVIEW program v.4.1 was used to determine the presence and length of haplotype blocks (using the four gamete rule option), and potential tag SNPs (Barrett et al., Reference Barrett, Fry, Maller and Daly2005).
Genotyping of SNPs
Three PCSK1 SNPs were analysed by PCR–RFLP. DNA extracted as reported above was amplified as previously described (Table S1). Digestion was carried out overnight at 37°C or 65°C in a final volume of 25 μl containing 1X enzyme reaction buffer, 5 μl of PCR product and either 2 U of AluI (MBI Fermentas, Vilnius, Lithuania) for SNP g.5182A>T or 2 U of TaiI (MBI Fermentas) for SNP g.1736C>T or either 2 U of TaaI (MBI Fermentas) for SNP g.1966C>A (reference sequence GenBank/EMBL HE599222). Digested DNA fragments were electrophoresed on 1X TBE 10% polyacrylamide/bis-acrylamide 29 : 1 gels and stained with ethidium bromide or 1X GelRed Nucleid Acid Gel Stain (Biotium Inc., Hayward, CA, USA). To evaluate precision of the three genotyping protocols, sequenced animals were genotyped. Both sequencing and PCR–RFLP analyses showed the same results.
Gene expression
Qualitative gene expression analysis: Isolation of total RNA from backfat, brain, heart, kidney, liver, lung, skeletal muscle, spleen, thyroid and gastric oxyntic mucosa (collected from a weaning pig) specimens (50 to 100 mg) was carried out using the RNeasy® Lipid Tissue kit (Qiagen, Duesseldorf, Germany; for backfat and brain), the RNeasy® Midi kit (Qiagen; for gastric oxyntic mucosa) or the FastPure™ RNA kit (Takara Bio Inc., Shiga, Japan; for all other tissues), following the manufacturers’ instructions. The purity and concentration of the total RNA extracted were checked using the Nanodrop ND 1000 spectrophotometer (Nanodrop Technologies Inc., Wilmington, DE, USA) and RNA integrity was controlled by agarose gel electrophoresis analysis. Then, approximately 1 μg of total RNA for each tissue was treated by RNase-Free DNase set (Qiagen) and 40 ng was retrotranscribed with ImProm-II Reverse Transcription System (Promega Corporation, Madison, WI, USA) using oligo (dT) primers and following the manufacturer's protocol. A fragment of 122 bp of the PCSK1 cDNA was amplified with the primers designed on the 3′-untranslated region (3′-UTR) of the PCSK1 cDNA (GenBank accession number NM_214038; Table S1) using the same PCR cycling conditions as reported above. GAPDH cDNA amplification, used as reference, was obtained with primer pair GAPDH_437 reported in Fontanesi et al. (Reference Fontanesi, Colombo, Beretti and Russo2008a). PCSK1- and GAPDH-amplified cDNA fragments were electrophoresed as reported above. All analyses were repeated three times.
Quantitative gene expression analysis (qPCR): This analysis was carried out on gastric oxyntic mucosa RNA extracted as described above from specimens collected from the weaning pigs. Total RNA was evaluated and RNase-Free DNase treated as reported above. After these steps, 1 μg of total RNA was reverse transcribed using the ImProm-II Reverse Transcription System (Promega). External PCR primers were used to amplify a fragment that served as the external homologous DNA standard of a known copy number (Table S1). This product was purified using the QIAquick PCR Purification Kit (Qiagen). The DNA quality and concentration were evaluated by the Nanodrop ND 1000 spectrophotometer (Nanodrop Technologies Inc.) and agarose gel electrophoresis. Then the fragment was serially diluted in 1 : 10 steps and a standard curve was created to perform an absolute quantitative analysis using internal primers (Table S1). The quantification reactions were performed in a Light Cycler instrument (Roche, Mannheim, Germany). The amplification was carried out in a 10 μL volume containing 2 μL of cDNA, 8 pmol of each primer and 5 μL of SYBR® Premix Ex Taq™ II (Perfect Real Time; Takara Bio Inc., Japan). The fast protocol was 40 cycles at 95°C for 5 s and 62°C for 20 s. The detection of the fluorescent product was set at the last step of each cycle. The specificity of each amplification was determined by melting curve analysis and electrophoresis on 1.2% agarose gels stained as previously reported. All amplifications were repeated three times and data were expressed as gene transcript copies/μl cDNA.
Radiation hybrid (RH) mapping
The INRA-Minnesota 7000 rads RH panel (IMpRH panel; Yerle et al., Reference Yerle, Pinton, Robic, Alfonso, Palvadeau, Delcros, Hawken, Alexander, Beattie, Schook, Milan and Gellin1998) consisting of 118 rodent-porcine hybrid cell lines was screened by means of PCR using primer pair indicated in Table S1. No PCR fragment was obtained from the control rodent genomic DNA. The PCR reactions were visualized on 10% polyacrylamide/bis-acrylamide 29 : 1 or 2% agarose gels. The results of RH PCR products were analysed with the IMpRH mapping tool accessible through the http://imprh.toulouse.inra.fr/ web address (Milan et al., Reference Milan, Hawken, Cabau, Leroux, Genet, Lahbib, Tosser, Robic, Hatey, Alexander, Beattie, Schook, Yerle and Gellin2000).
Association analyses
EBVs for average daily gain (ADG, expressed in g), LC (expressed in kg), BFT (expressed in mm) and FGR were calculated for both random groups of sib-tested Italian heavy pigs (1-a and 2-a). EBV for ham weight (HW, expressed in kg) was calculated for ILW pigs only (1-a). EBV for VIF was calculated for ID pigs only (2-a). EBVs for BFT and VIF were calculated for the two groups of pigs (ILW and ID, respectively) used in the selective genotyping analysis (3-b and 4-b). EBVs were calculated using a Best Linear Unbiased Prediction (BLUP)-Multiple Trait Animal Model with different models for each trait. Depending on the trait, models included the fixed effects of sex, batch on trial, inbreeding coefficient of the animal, interaction of sex by age at slaughtering, date of slaughtering and the random effects of litter and animal. Random Residuals (RRs) were calculated for all considered traits in the random groups (1-a and 2-a) of performance-tested ILW and in all ID pigs (ADG, LC, BFT, FGR and HW in ILW; ADG, LC, BFT, FGR, HW and VIF in ID). RRs were obtained by using liner fixed models including the same factors used for each trait in the BLUP-Multiple Trait Animal Model (Fontanesi et al., Reference Fontanesi, Speroni, Buttazzoni, Scotti, Dall'Olio, Nanni Costa, Davoli and Russo2010d).
Association analyses were carried out independently for the two random groups of sib-tested Italian pigs (1-a, ILW; and 2-a, ID). Associations between the two polymorphic PCSK1 SNPs (g.1736C>T and g.5182A>T) and EBVs or RRs were assessed by using the GLM procedure of SAS, release 9.2 (SAS Institute Inc., Cary, NC, USA). The models included only the fixed effects of individual marker genotypes. All other factors contributing to variability of the investigated traits were already considered in the calculation of EBV or RR. For meat quality traits in the performance-tested ILW pigs (1-a), the procedure MIXED of SAS was applied to a model that included date of slaughtering, sex and PCSK1 genotype for g.1736C>T and g.5182A>T SNPs. EBV and RR distribution (and their residuals) for BFT, ADG, LC and FGR traits in the sub-group of ID animals pigs with the extreme values of EBVs for VIF (4-b) did not differ from the normal distribution (Shapiro–Wilk test for these traits was P > 0.15). Therefore, to test the association between the genotypes at the PCSK1 gene and the calculated EBVs and RRs for BFT, ADG, LC and FGR, this sub-group of pigs (100 animals) was merged with the sub-group of pigs of the same breed not pre-selected by any phenotypic or genotypic criteria (197 animals), thus forming a group of 297 ID pigs (2-a + 4-b). Association between VIF and PCSK1 genotypes was carried out using only the 197 ID pigs not pre-selected in which VIF EBVs were normally distributed (2-a). In addition, haplotypes between the two PCSK1 genotyped SNPs were inferred using the PHASE program v. 2.0 (Stephens et al., Reference Stephens, Smith and Donnelly2001). Evaluation of the haplotype substitution effect on EBVs and RRs was obtained separately for the same two performance-tested Italian heavy pig groups (1-a and 2-a) using the PROC REG of SAS with a model including the number (0, 1, 2) of the haplotypes identified. As discussed in Russo et al. (Reference Russo, Fontanesi, Scotti, Beretti, Davoli, Nanni Costa, Virgili and Buttazzoni2008), to overcome the effects of multiple tests on nominal comparison-wise error rate P-values, significant threshold (independently for the single-marker analysis and for the haplotype analyses across the two random populations) was identified using the Proportion of False Positive (PFP) approach (Fernando et al., Reference Fernando, Nettleton, Southey, Dekkers, Rothschild and Soller2004). PFP thresholds were calculated as described in Bagnato et al. (Reference Bagnato, Schiavini, Rossoni, Maltecca, Dolezal, Medugorac, Sölkner, Russo, Fontanesi, Friedman, Soller and Lipkin2008). As reported below, the excess of significant tests caused a near coincidence of P-nominal value and PPFP for single-marker tests and a higher PPFP than the P-nominal value in haplotype association analysis, similarly as reported by Tal-Stein et al. (Reference Tal-Stein, Fontanesi, Dolezal, Scotti, Bagnato, Russo, Canavesi, Friedmann, Soller and Lipkin2010). Therefore, in both cases we adopted P-nominal value = 0.05 as the threshold for significant association and P-nominal value = 0.10 as the threshold to indicate suggestive association. In addition, additive genetic and dominance effects of the two PCSK1 SNPs were estimated for the two random performance-tested pig populations as it follows: additive effect, a = 1/2(BB − AA); dominance effect, d = AB − 1/2(AA + BB). Estimates of the effects were tested by t-test for significant deviation from zero. Ratio between the absolute values of d and  $$\[--><$>a\,(\left| {{d \mathord{\left/ {\vphantom {d a}} \right. \kern-\nulldelimiterspace} a}} \right|) <$><!--\]$$ were used to indicate possible gene effects:
 $$\[--><$>\left| {{d \mathord{\left/ {\vphantom {d a}} \right. \kern-\nulldelimiterspace} a}} \right| <$><!--\]$$<0.2, additive; 0.2<
 $$\[--><$>\left| {{d \mathord{\left/ {\vphantom {d a}} \right. \kern-\nulldelimiterspace} a}} \right| <$><!--\]$$<0.8, partial dominance; 0.8<
 $$\[--><$>\left| {{d \mathord{\left/ {\vphantom {d a}} \right. \kern-\nulldelimiterspace} a}} \right|<$><!--\]$$<1.2, dominance;
 $$\[--><$>\left| {{d \mathord{\left/ {\vphantom {d a}} \right. \kern-\nulldelimiterspace} a}} \right|<$><!--\]$$>1.2, overdominance (Stuber et al., Reference Stuber, Edwards and Wendel1987).
For the two groups of pigs chosen for selective genotyping based on extreme values of EBVs for BFT (3-b, ILW) and VIF (4-b, ID), respectively, Fisher's exact test of significance (two-tailed) or χ 2 test (where appropriate) of differences in allele frequency between the positive and negative groups were used.
For the weaning ILW × Italian Landrace pigs (5-c), association between PCSK1 gene expression in gastric oxyntic mucosa, growth performances and feed intake, and PCSK1 SNPs was analysed using the PROC GLM procedure of SAS with a factor design, including the PCSK1 g.1736C>T or the g.5182A>T SNPs, the diet, the susceptibility to E. coli K88, the trial and the litter within the trial. In the case of the g.5182A>T polymorphism, only two pigs carried the AA genotype, and therefore this genotypic class was excluded from the analysis.
In these two later studies (extreme divergent groups and weaning pigs), results with P-nominal value ⩽ 0.05 were considered significant. Other P-nominal values 0.05 < P < 0.10 were considered as suggestive for associations.
Results
Gene expression analyses
As information of the range of tissues in which PCSK1 is expressed was not available in pigs, we first tested its expression in 10 different tissues (Figure S1). PCSK1 expression was evident in most of the analysed tissues, with some differences in signal intensity, except in liver and spleen in which we did not obtain any amplified fragment. As expected from reports in other species (i.e. Gagnon et al., Reference Gagnon, Mayne, Mbikay, Woulfe and Chrétien2009) and according to the fundamental function of PCSK1 in processing key-gut/intestine prohormones (Zhu et al., Reference Zhu, Cao, Voogd and Steiner2006), gastric oxyntic mucosa showed a qualitatively higher level of PCSK1gene expression compared with the other tissues (Figure S1). Therefore, qPCR was used to precisely evaluate the level of expression of this gene in weaning pigs and to evaluate its association with PCSK1 SNPs (see below). Considering the data obtained in the analysed pigs, gastric oxyntic mucosa contained on average 996 ± 65 PCSK1 gene transcript copies per μl of cDNA.
RH mapping of the porcine PCSK1 gene
The porcine PCSK1 gene has already been assigned to porcine chromosome (SSC) 2 by RH analysis (Shimogiri et al., Reference Shimogiri, Kiuchi, Hiraiwa, Hayashi, Takano, Maeda and Yasue2006). In addition, a partial sequence with several gaps and assembling problems of the PCSK1 gene has been included in the Sscrofa9.2 version of SSC2, between nucleotides 92 001 906 and 92 024 579 (Ensembl entry: ENSSSCG00000014169). This is in agreement with comparative mapping between SSC2 and human chromosome (HSA) 5 in which this gene is localized (GRCh37: position 95.73 to 95.77 Mb), as indicated by several studies (Rink et al., Reference Rink, Eyer, Roelofs, Priest, Sharkey-Brockmeier, Lekhong, Karajusuf, Bang, Yerle, Milan, Liu and Beattie2006; Hamasima et al., Reference Hamasima, Mikawa, Suzuki, Suzuki, Uenishi and Awata2008). However, this gene has not been included in the Sscrofa10.2 version of SSC2, as BLAST analysis with the porcine PCSK1 cDNA sequence (NM_214038.1) did not reveal any significant match with any region in this updated SSC2 version, but only with an un-assembled scaffold (LOCUS NW_003540493, chrU_scaffold4254; data not shown). Therefore, we confirmed the previous assignments to SSC2 by RH mapping using the IMpRH panel. The retention fraction of the amplified PCSK1 fragment was 22% and the closest marker obtained by two-point analysis was S0226 (distance = 39 cR; LOD = 10.31), already placed on the RH map of SSC2 (Hawken et al., Reference Hawken, Murtaugh, Flickinger, Yerle, Robic, Milan, Gellin, Beattie, Schook and Alexander1999). This microsatellite is the same marker that was the closest one in the two-point analysis reported by Shimogiri et al. (2006). Multipoint mapping localized the PCSK1 gene between microsatellites SW1602 and SW1320 (74.8 and 76.9 cM, respectively, in the linkage map of the USDA database, http://www.marc.usda.gov/genome/swine/swine.html).
Polymorphisms, sequence statistics and haplotype diversity
As the porcine PCSK1gene sequence available on Sscrofa9.2 did not include sequence information from a few coding exons and a few others have been assembled in reverse complement position compared with most of the correctly defined Ensembl exons, we retrieved the lacking exons and defined the problematic ones mining trace records and aligning cDNA and genomic sequences. The resulting assembled sequence (EMBL accession no. HE599222) was compared with the sequence available in Sscrofa10.2 genome version that independently confirmed the correct assembly. Then, we re-sequenced 5180 bp in 21 pigs of different breeds, encompassing almost all coding sequence (CDS; 2062 bp, only a few bp of the last coding exon were not included) and parts of intronic and 5′-untranslated region (3118 bp; EMBL accession number HE599222). On the whole, we identified one indel (in a poly T stretch in intron 4) and 13 SNPs, four of which were synonymous polymorphisms in coding regions (one SNP every ∼515 bp of CDS), whereas all other polymorphisms were in introns (one every ∼312 bp of noncoding sequences; Table 1). In silico prediction of the effects of the identified polymorphisms did not report any strong signal of potential functional roles for the different variants (data not shown).
Computation of nucleotide diversity (π) for sequenced regions (Table 2) indicated a quite low level of variability in the Western pig breeds (ranging from 0.011% to 0.040%) compared with the Meishan (0.090%). Tajima's D (DT) values were not significant in any breed (P > 0.10) probably because of the low number of sequenced animals. However, it is interesting to note a positive value in ILW (+1.680), whereas in ID and Hampshire this parameter was negative (−1.278 and −1.337; Table 2).
PCSK1 gene statistics in the sequenced panel

PCSK1 = proprotein convertase subtilisin/kexin type 1; S = segregating single-nucleotide polymorphism sites; h = number of haplotypes; hD = haplotype diversity (standard deviation); π = nucleotide diversity (standard deviation); DT = Tajima's D.
Statistics were calculated at the breed level and considering together all sequenced animals.
1Two sequences for each animal.
2Including the sequenced Belgian Landrace pig.
Haplotypes were inferred using all SNPs but excluding the indel for the difficulties in determining the genotypes of the animals from sequences data. Inferred haplotypes (n = 9) with their occurrence in the sequenced pig panel are reported as a note to Table 1. Haplotype (H) 3 was the most frequent (17 out of 42 sequences) and it was almost fixed in ID (12/14). Haplotype 1 was the second most frequent in the sequenced panel (24%); it was in all Western breeds and was the most frequent in Hampshire (5/6). Haplotype 6 was the most frequent in ILW (4/10) but was also observed in one Meishan pig. Other Meishan sequences included haplotypes 7 and 8. Haplotype 9 was identified in one Hampshire pig. NJ tree of the haplotypes (Figure S2) clearly indicated differences between two groups of haplotypes. One included the most divergent haplotypes (H8 and H9) that might be of Asian origin, considering that H8 was identified in one Meishan. However, H9 identified in a Western pig (Hampshire) might be derived by introgression of Asian haplotypes into Western originated breeds. Signs of putative introgression of Asian haplotypes in European breeds could also be seen for H7 that was shared by Meishan, ILW, Belgian Landrace and ID.
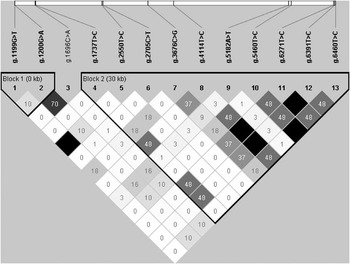
Figure 1 reports the linkage disequilibrium patterns (r 2) between polymorphism pairs across the porcine PCSK1gene. Two main haplotype blocks can be observed from the obtained data. The largest one, which includes the 3′ part of the gene, spans ∼30 kb (without including several unknown not sequenced intronic regions of the Sscrofa10.2 chrU_scaffold4254). Using the aggressive tagging algorithm of HAPLOVIEW (Barrett et al., Reference Barrett, Fry, Maller and Daly2005), 9 SNPs tests captured all variability (13 considered polymorphisms; mean max r 2 = 1.00).
Linkage disequilibrium (r 2) plot at the porcine PCSK1 gene. Single nucleotide polymorphisms were positioned on the Sscrofa10 chrU_scaffold4254 containing the porcine PCSK1 gene. The polyT indel was not included in the analysis.

Three tag SNPs detected by sequencing (g.1696C>A, g.1737T>C and g.5182A>T) were chosen for genotyping as they could be easily analysed by PCR–RFLP and were among the tagged SNPs identified as reported above. Allele frequencies of these three SNPs in a larger number of pigs of the same breeds used for SNP discovery, including also 30 Casertana pigs, are reported in Table S2. Results confirmed those obtained from the sequencing panel for the same polymorphic sites. For example, allele C of the g.1737T>C SNP was contained only in H9 identified in a Hampshire pig. This SNP resulted polymorphic only in the Hampshire breed (Table S2). For this reason, it was not considered for further genotyping and association studies.
Association analyses
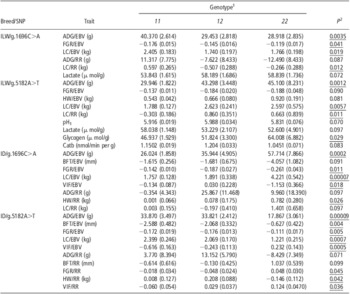
Results of the association analyses in the random groups of ILW and ID pigs (1-a and 2-a) between the two PCSK1 SNPs of interest (g.1696C>A and g.5182A>T) and meat production, carcass traits, growth performances and meat quality traits are reported in Table 3. An excess of tests with P-nominal value <0.10 is evident (33 out of 54 tests); therefore, P-nominal value of 0.05 corresponded to the PPFP significant threshold of 0.05. Both EBVs and RRs were considered in this analysis for ADG, BFT, FGR, HW, LC and VIF: for most traits for which association analyses with EBV produced P-nominal value <0.10, results obtained using RR confirmed in most case the same significance levels. In particular, for g.5182A>T in the ID population, 4 out of 5 significant EBVs resulted in a corresponding RR below P-nominal value of 0.10. In addition, HW RR (not available as EBV) showed a P-nominal value far below 0.10 (Table 3). For the other genotyped SNP (g.1696C>A), 5 significantly or suggestively associated trait/EBVs had two corresponding suggestively associated RR-based values (ADG and LC) plus HW RR with P < 0.05. In ILW pigs, the g.1696C>A genotypes with significant effects on ADG EBV (P < 0.01), FGR EBV (P < 0.05) and LC EBV (P < 0.02) were also suggestively associated, close to the suggestive threshold or significantly associated with the corresponding RR values (ADG RR, P < 010; FGR RR, P = 0.107; LC RR, P < 0.05). This polymorphic site was also suggestively associated with lactate content (Table 3). Effect on LC was also reported for the other marker (g.5182A>T) in both EBV (P < 0.01) and RR (P < 0.02). The genotypes of this SNP were suggestively associated or significantly associated with several meat quality parameters (pH1, lactate content and Catb: P < 0.10; glycogen content: P < 0.05). In the ILW population, BFT did not result to be significantly associated with g.1696C>A or g.5182A>T genotypes.
Association analysis between the g.1696C>A and g.5182A>T PCSK1 SNP genotypes and EBV and RR for meat production and carcass traits in ILW and ID pigs and phenotypic measures for meat quality parameters in ILW pigs

PCSK1 = proprotein convertase subtilisin/kexin type 1; SNP = single-nucleotide polymorphism; EBV = estimated breeding values; RR = random residuals; ILW = Italian Large White (random group); ID = Italian Duroc (random group + selective genotyping group, excluding for VIF); ADG = average daily gain; FGR = feed : gain ratio; LC = lean cuts; HW=ham weight; Catb = cathepsin B activity; BFT = backfat thickness; VIF = visible intermuscular fat; pH1 = pH measured at 2 h post mortem on M. semimembranosus.
Least square means are reported with their standard errors in parenthesis. Only results with P < 0.10 are reported.
1Allele 1 is C for g.1696C>A and A for g.5182A>T. The number of animals for each genotypic class was: ILW/g.1696C>A: CC, n = 100; CA, n = 85; AA, n = 86; ILW/g.5182A>T: AA, n = 204; AT, n = 57; TT, n = 10; ID/g.1696C>A: CC, n = 247; CA, n = 36; AA, n = 14 (for VIF: CC, n = 163; CA, n = 21; AA, n = 13); ID/g.5182A>T: AA, n = 67; AT, n = 142; TT, n = 88 (for VIF: AA, n = 57; AT, n = 97; TT, n = 43).
2Underlined when P < 0.05. Of the 54 tests, only results with P < 0.10 are reported. A complete list is available from the authors.
By observing the effects of the two genotyped SNPs on the significantly or suggestively associated traits in the two considered breeds, it appears an opposite effect (with some difference in additive or dominance effects) in ILW as compared with ID (Tables 3 and S3). For example, genotype CC of the g.1696C>A showed a positive effect in the ILW, whereas it was the less favourable in ID for ADG (Tables 3 and S3). And this was evident for most traits analysed in both breeds. The same was true for the g.5182A>T SNP. For example, genotype AA was associated with lower ADG in ILW, whereas in ID TT was the less favourable genotype (Tables 3 and S3).
Results of single-marker analysis were confirmed using haplotypes of these two genotyped SNPs (Table S4). All four possible haplotypes were inferred in both pig breeds, one of which ([g.1696A:g.5182T], indicated as [A:T]), was carried by few animals and was excluded from the association analyses (Table S4). The most frequent haplotype in ILW was [A:A] (∼46%), whereas in ID it was [C:T] (∼52%; Table S4). Considering the 63 tests reported in Table S4, more than 50% (33 out of 63) of the test showed a P < 0.10. This excess of tests in this bin class produced a PPFD = 0.05 that corresponded to a P-nominal value of ∼0.10. Therefore, in addition, for haplotype analyses we took the P-nominal value of 0.05 as the threshold for significance and the P-nominal value of 0.10 as the threshold for suggestive association. Haplotype substitution effects were highly significant for ADG EBV (P < 0.001) and significant for ADG RR (P < 0.05) for haplotype [A:A] in both breeds, but, as expected from the results of the analysis of the two separated SNPs, in the opposite direction (Table S4). For haplotype [C:T], substitution effect for 11 out of 21 trait/breed combinations were significant in the ID pigs. Haplotype [C:A] showed significant substitution effect in ID only (Table S4). Significant results were found for BFT and VIF for both EBV and RR in opposite direction as compared with the effects of haplotype [C:T] on the same traits (Table S4). This result confirmed the role of the g.5182A>T SNP in affecting BFT and VIF in ID breed.
An independent confirmation of the effect of this PCSK1 polymorphic site in affecting VIF was provided by the selective genotyping experiment in which two extreme and divergent groups for VIF EBV were genotyped (4-b; Table S5). Significant differences in allele frequencies between the two tails were reported considering all 50 + 50 pigs (P < 0.05). Suggestive differences (P < 0.10) were maintained considering only two-generation unrelated pigs (Table S5). Allele T was the most frequent in the positive group (VIF with higher value, which means higher content of VIF), confirming the effect of this allele from the previous analysis (Tables 3 and S4). As expected, no significant allele frequency difference was reported for the g.1696C>A SNP (Table S5). Results for the selective genotyping experiment for BFT in the ILW breed (3-b) confirmed the lack of effects of the g.1696C>A and g.5182A>T SNPs on this trait (Table S5).
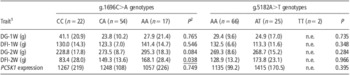
To further evaluate the effects of PCSK1, we genotyped the g.1696C>A and g.5182A>T SNP in 93 weaning ILW × Italian Landrace pigs (5-c) for which growth performances, feed intake and mRNA PCSK1 level in gastric oxyntic mucosa were measured (Table 4). Significant association (P < 0.05) between the g.1696C>A genotypes and daily feed intake during the second week of trial was identified, confirming the suggestive association (P < 0.10) with daily gain on the same period. Animals with genotype AA showed increased feed intake and growth rate, confirming, to some extent, the effect of this SNP on growth traits, already found in the performance-tested ILW and ID pigs (Table 3). However, the direction of the effect seems similar to that reported in ID in which animals with the same AA genotype had a higher ADG. No significant effects were evidenced for the g.5182A>T SNP on growth performance. Both genotyped SNP were not associated with PCSK1 gene expression level in the analysed tissue.
Effect of the g.1696C>A and g.5182A>T PCSK1 genotypes on growth, feed intake and PCSK1 mRNA expression level in oxyntic mucosa of weaning pigs

PCSK1 = proprotein convertase subtilisin/kexin type 1; n.e. = not estimated.
Least square means for each genotypic class are reported with their standard errors in parenthesis.
1DG-1W = daily live weight gain during the first week; DFI-1W = daily feed intake during the first week; DG-2W = daily live weight gain during the second week; DFI-2W = daily feed intake during the second week; PCSK1 expression = PCSK1 mRNA quantification in gastric oxyntic mucosa (expressed in copies/μl cDNA).
2Significant results are underlined.
Discussion
PCSK1, also known as PC1 or PC3, belongs to a family of serine proteinases that is responsible for processing secretory precursor proteins into their active forms, making this enzyme a key regulator of the secretory pathway in mammals. Several reports in humans have indicated that polymorphisms in this gene cause severe early-onset obesity or are associated with common obesity (e.g. Jackson et al., Reference Jackson, Creemers, Ohagi, Raffin-Sanson, Sanders, Montague, Hutton and O'Rahilly1997; Benzinou et al., Reference Benzinou, Creemers, Choquet, Lobbens, Dina, Durand, Guerardel, Boutin, Jouret, Heude, Balkau, Tichet, Marre, Potoczna, Horber, Le Stunff, Czernichow, Sandbaek, Lauritzen, Borch-Johnsen, Andersen, Kiess, Körner, Kovacs, Jacobson, Carlsson, Walley, Jørgensen, Hansen, Pedersen, Meyre and Froguel2008). Therefore, this gene is an interesting candidate to explain a quote of variability of fat deposition and other obesity-related traits in pigs.
Mapping of the porcine PCSK1 gene confirmed its position on SSC2. A few studies have reported QTL for growth rate at different stages in the chromosome region overlapping the positions of the microsatellites that bracket PCSK1 using a Berkshire × Yorkshire population (Malek et al. Reference Malek, Dekkers, Lee, Baas and Rothschild2001; Thomsen et al., Reference Thomsen, Lee, Rothschild, Malek and Dekkers2004) and a Wild Boar × Pietrain reference family (Lee et al., Reference Lee, Chen, Moran, Cepica, Reiner, Bartenschlager, Moser and Geldermann2003). To our knowledge, no fat deposition QTL with a peak in this region have been reported, even if 95% confidence intervals are usually very large. However, statistical analysis of SSC2 QTL seems quite complicated by the complex pattern of effects in different populations and by the large effects of the p-arm region (Fontanesi et al., Reference Fontanesi, Speroni, Buttazzoni, Scotti, Dall'Olio, Nanni Costa, Davoli and Russo2010d and Reference Fontanesi, Scotti, Speroni, Buttazzoni and Russo2011b). In addition, other reports have localized another important QTL region for BFT and, possibly, LC content, around 30 to 50 cM (Lee et al., Reference Lee, Chen, Moran, Cepica, Reiner, Bartenschlager, Moser and Geldermann2003; Liu et al., Reference Liu, Jennen, Tholen, Juengst, Kleinwächter, Hölker, Tesfaye, Un, Schreinemachers, Murani, Ponsuksili, Kim, Schellander and Wimmers2007; Tortereau et al., Reference Tortereau, Gilbert, Heuven, Bidanel, Groenen and Riquet2011).
The results of the association analyses indicated that two polymorphic sites in intronic regions of the porcine PCSK1 gene (g.1696C>A and g.5182A>T) are associated with several meat production, growth efficiency, carcass and meat quality traits in ILW, ID and in a commercial cross (Tables 3, 4, S3, S4 and S5). The findings obtained in the ILW and ID random groups (1-a and 2-a) for fat deposition traits have been confirmed by the results obtained in the selective genotyping experiment (3-b and 4-b) set up for VIF (ID) and BFT (ILW). The results obtained in the weaning ILW × Italian Landrace pigs confirmed the effects of the most polymorphic marker (g.1696C>A) in this population for growth performances, observed also in the random groups of the two performance-tested breeds.
PCSK1 is required for processing of pre-pro-ghrelin into ghrelin in the gastric mucosa (Zhu et al., Reference Zhu, Cao, Voogd and Steiner2006), which in turn plays a key role in the control of feed intake and energy metabolism (Wren et al., Reference Wren, Small, Abbott, Dhillo, Seal, Cohen, Batterham, Taheri, Stanley, Ghatei and Bloom2001). Thus, it was tempting to assume an association between the analysed polymorphisms and the level of expression of the PCSK1 gene in the key tissue for ghrelin production (gastric oxyntic mucosa). This was tested in weaning pigs (5-c) in which feed intake is in general limited by the weaning stress. However, the analysed polymorphisms were not associated with PCSK1 mRNA level in this tissue. The complexity of the factors related to the particular condition that the piglets are suffering after the end of sucking could mask differences in PCSK1 gene expression.
Interesting results have been obtained for a few meat quality traits. In particular, the g.5182A>T SNP was associated with glycogen content, and suggestively associated with pH1, lactate content and Catb in ILW pigs (1-a). As PCSK1 is expressed in skeletal muscle, even if at moderate level according to our raw qualitative analysis (Figure S1), and considering that the encoded enzyme has proteolytic functions, it could be possible that PCSK1 is involved directly in some biological processes determining variability on these traits. Quantitative analysis of PCSK1 mRNA expression in this tissue and its relationship with PCSK1 variability could provide additional information to clarify this question. Moreover, it is also worth pointing out that the g.5182A>T SNP is the first marker reported to have a possible effect on Catb of the muscle. This trait is important for the production of dry-cured hams as an excessive Catb is associated with excessive softness and other defects of the meat that are of particular concerns for the processing industry (Russo et al., Reference Russo, Buttazzoni, Baiocco, Davoli, Nanni Costa, Schivazappa and Virgili2000; Virgili and Schivazappa, Reference Virgili and Schivazappa2002). If this result is confirmed, it could provide important applications in this sector by using marker-assisted selection based on this SNP or, eventually, other PCSK1 polymorphisms.
In the association analysis carried out in the two random groups of the performance-tested ILW and ID pigs (1-a and 2-a), we used both EBVs and RRs for traits that are currently included in the national genetic evaluation (http://www.anas.it) of these breeds. It is worth mentioning that these traits have high heritability (>0.30) and high genetic correlations (Ciobanu et al., Reference Ciobanu, Lonergan and Huff-Lonergan2011; Clutter, Reference Clutter2011). Several studies, mainly in dairy cattle, have evaluated the properties of EBV in association studies, suggesting a lower, or at best equivalent, power in using EBV as compared with raw or adjusted phenotypic measurements (e.g. Thomsen et al., Reference Thomsen, Reinsch, Xu, Looft, Grupe, Kühn, Brockmann, Schwerin, Leyhe-Horn, Hiendleder, Erhardt, Medjugorac, Russ, Förster, Brenig, Reinhardt, Reents, Blümel, Averdunk and Kalm2001; Israel and Weller, Reference Israel and Weller2002). Other simulation studies have reported that using EBVs could produce a higher level of type I errors compared with other approaches (Ekine et al., Reference Ekine, Rowe, Bishop and de Koning2010), even if evaluation for the level of type II errors is not reported. In general, tests that used EBVs gave lower P-values than those based on RRs (Tables 3 and S4), confirming to some extent a possible overestimation of the effects and higher rate of false positives in these analyses. However, this possible bias seems reduced for traits with high heritability, but additional studies should be carried out to evaluate this issue. The combined use of RRs could, at least in part, prevent this problem and might indicate results that should be considered with caution (Fontanesi et al., Reference Fontanesi, Speroni, Buttazzoni, Scotti, Dall'Olio, Nanni Costa, Davoli and Russo2010d). The use of RRs produced 12 out of 20 tests with P-nominal value < 0.10 (60%) and the use of EBVs produced 17 out of 24 tests with P-nominal value below this threshold (71%), considering the single-marker tests (Table 3). In the association analysis with haplotypes, 20 out of 30 and 13 out of 33 tests for EBVs and RRs, respectively, had P-nominal value < 0.10. In single-marker and haplotype analyses, RR were at least suggestively significant only when EBV were below the 0.10 suggestive threshold, but the contrary was not true as it can be easily deduced from what indicated above. However, even if we consider the few differences between EBV and RR it is clear that the analysed markers are associated with several production traits in both ILW and ID pigs. Effects within breeds were consistent with the genetic correlation among recorded traits (Ciobanu et al., Reference Ciobanu, Lonergan and Huff-Lonergan2011; Clutter, Reference Clutter2011). However, comparing the results in these two breeds, the effects of both polymorphisms (and their haplotypes) was clearly in the opposite direction for all traits available in both groups (Tables 3, S3 and S4). This means that these PCSK1 markers are in different phases with (a) close causative mutation(s) affecting the analysed traits. By re-sequencing more than 5.1 kb of the porcine PCSK1 gene in 21 pigs of different breeds (for a total of about 1.09 Mb), we did not identify any putative causative mutation. Therefore, it could be possible that not identified regulatory mutations in this gene or in other close genes could be involved in determining the observed phenotypic effects.
Another striking difference between ID and ILW comes from the opposite values obtained calculating DT in the sequenced panel (Table 2). Even if not significant, the negative DT value in the ID might indicate a tendency towards directional selection, whereas the positive DT value in the ILW might indicate a tendency towards balancing selection. Confirmation of these values in a larger sample of pigs is needed before any conclusion but, in any case, it is tempting to match these preliminary indications with the results of the association study in which PCSK1 SNPs have opposite effects in the same two breeds. The explanation of one of these two genetic aspects could provide useful information to understand the other. For this reason, it is also important to consider that haplotype heterogeneity at this locus has only been partly considered in our study. A larger number of haplotypes than those actually used in the association studies have been identified (Tables 1 and 2, Figure S2), suggesting that we might have missed information that is worthy of further exploitation.
Results obtained in this study will guide further investigations to solve the case of different effects in different breeds enlarging the analysis of haplotype blocks by identifying and adding additional polymorphisms in the PCSK1 gene or in close regions and evaluating them in additional pig populations. Other functional studies could provide other data that may complement the results we already obtained.
Acknowledgements
We thank Dr M. Yerle (INRA) for providing the INRA-Minnesota 7000 rads RH panel and ANAS for providing samples and data. This work was supported by University of Bologna (FAGenomicH project) and Italian MiPAAF (Selmol and Innovagen projects).
Supplementary materials
For supplementary materials referred to in this article, please visit http://dx.doi.org/doi:10.1017/S1751731112001280