INTRODUCTION
Maize (Zea mays L.) is a major cereal crop in West and Central Africa (WCA). Since its introduction to WCA about 500 years ago, it has become a major staple crop with numerous varieties developed and released for the various agro-ecological zones. It is well integrated into the farming system and a number of maize-based cropping systems are prominent in WCA. It is presently produced in the drier traditional sorghum (Sorghum bicolor L.) and millet (Penisetum typhoides L.) agro-ecological zones largely due to the availability of extra-early (80–85 days to maturity) and early maturing (90–95 days to maturity) varieties (Enyong et al., Reference Enyong, Coulibaly, Adesina, Youri, Thé, Badu-Apraku, Fakorede, Ouedraogo and Quin1999; Fakorede et al., Reference Fakorede, Badu-Apraku, Kamaru, Menkir, Ajala, Badu-Apraku, Fakorede, Ouedraogo, Carsky and Menkir2003). Extra-early maturing varieties help to fill the hunger gap that occurs towards the end of the dry season in savanna agro-ecologies. The savannas of WCA offer a highly productive environment for maize because of low night temperature, high incident solar radiation due to low cloud cover and reduced incidence of pests and diseases as a result of low air humidity. However, soils of the savanna are low in fertility especially nitrogen (N), because they are mainly kaolinitic alfisols with low organic matter and cation exchange capacity (Jones and Wild, Reference Jones and Wild1975) and the use of inorganic fertilizers is low.
Because it is most limiting in tropical soils, low N availability reduces plant leaf area expansion if it occurs early in the life of the plant, as well as photosynthesis (Bänziger et al., Reference Banzinger, Edmeades, Beck and Bellon2000). Such nutritional stress causes severe damage if it occurs just before flowering when structures that determine yield, the ears and kernels are formed. The low level of nitrogen in tropical soils is a limitation to high productivity if fertilizers, organic or inorganic, are not applied. Inorganic fertilizer use in sub-Saharan Africa (SSA) is low due to the limited resources of farmers, lack of credit facilities and low availability, especially during the cropping season (Kamara et al., Reference Kamara, Menkir, Fakorede, Ajala, Badu-Apraku and Kureh2004). Available nitrogen is reduced by nitrogen taken up by plants, volatilization, leaching and losses through running water. Generally, maize plants differ in their capacity to absorb nitrogen and in their ability to mobilize photosynthates during nitrogen stress (Bänziger et al., Reference Banzinger, Edmeades, Beck and Bellon2000). Therefore, the development of maize germplasm with tolerance to low N is crucial for increased maize productivity.
Breeding for tolerance to low N offers the most economic and sustainable approach for increased maize yields by small-scale farmers who utilize low agricultural inputs in SSA. Low N tolerant cultivars are superior in the utilization of available N, either because of enhanced N-uptake capacity or more efficient use of absorbed N for grain production (Lafitte and Edmeades, Reference Lafitte and Edmeades1994). Bänziger et al. (Reference Banziger, Edmeades and Lafitte1999) reported that improvement for drought tolerance also resulted in specific adaptation and improved performance under low N conditions, suggesting that tolerance to either stresses involves a common adaptive mechanism. Thus, selection for improved partitioning of assimilates to the developing ear using drought stress at flowering as the selection criterion can simultaneously improve tolerance to low N. Andrade et al. (Reference Andrade, Cirilo, Echarte, Otegui and Slafer2000) reported that a common curve described the response of kernel number to crop growth rate around flowering whether the crop was stressed by inadequate water or by N deficiency. Selection for Striga resistance under low N could also result in concomitant increase in tolerance to low N, as suggested by Badu-Apraku et al. (Reference Badu-Apraku, Fakorede, Lum and Akinwale2009).
Performance of cultivars under contrasting N levels have been compared (Castleberry et al., Reference Castleberry, Crum and Krull1984; O'Neill et al., Reference O'Neill, Shanahan, Schepers and Caldwell2004) and revealed that genetic gains for grain yield under low and high soil fertility of 25 open pollinated and hybrid maize cultivars in the USA during the period between 1930s and 1980s were 0.051 and 0.087 Mg ha−1 year−1, respectively. In contrast, the USA hybrid (B73 × Mo17) widely grown during the 1970s produced 8% more yield under a deficit N treatment than hybrids released in the early and late 1990’s, while the latter had greater yield responses at high fertilizer N levels. Genetic gains in tropical maize under drought stress are not as well documented (Beyene et al., Reference Beyene, Semagn, Mugo, Tarekegne, Babu, Meisel, Sehabiague, Makumbi, Magorokosho, Oikeh, Gakunga, Vargas, Olsen, Prasanna, Banziger and Crossa2015; Edmeades et al., Reference Edmeades, Bolaños, Chapman, Lafitte and Bänziger1999). Genetic gains for grain yield of CIMMYT's Eastern and Southern Africa (ESA) early maturing open-pollinated varieties (OPVs) have been estimated at 0.11, 0.029, 0.085 and 0.193 Mg ha−1 year−1 under optimal conditions, random drought during the wet season, low N and maize streak virus (MSV) (Masuka et al., Reference Masuka, Magorokosho, Olsen, Atlin, Bänziger, Pixley, Vivek, Labuschagne, Matemba-Mutasa, Burguenõ, Macrobert, Prasanna, Makumbi, Tarekegne, Crossa, Zaman-Allah, van Biljon and Cairns2017a). In the intermediate-late maturity group, genetic gain under optimal conditions, random drought, low N and MSV was 0.079, 0.042, 0.053 and 0.109 Mg ha−1 year−1. No significant yield gains were made under managed drought stress for both maturity groups. Genetic gains for grain yield in CIMMYT's ESA hybrid maize breeding programme have been estimated at 0.109, 0.325, 0.227, 0.209 and 0.141 Mg ha−1 year−1 under optimal conditions, managed drought stress, random drought, low N and MSV, respectively, during the period 2000 to 2010 (Masuka et al., Reference Masuka, Atlin, Olsen, Magorokosho, Labuschagne, Crossa, Bänziger, Pixley, Vivek, van Biljon, Macrobert, Alvarado, Prasanna, Makumbi, Tarekegne, Das, Zaman-Allah and Cairns2017b). In WCA, genetic gain has only been determined for OPVs. A genetic gain of 0.4% year−1 for grain yield under optimal conditions was estimated for intermediate maturing maize OPVs released between 1970 and 1999 in the Nigerian savannahs (Kamara et al., Reference Kamara, Menkir, Fakorede, Ajala, Badu-Apraku and Kureh2004). A more recent study by Badu-Apraku et al. (Reference Badu-Apraku, Oyekunle, Menkir, Obeng-Antwi, Yallou, Usman and Alidu2013b) estimated genetic gain for early maturing OPV grain yield at 0.040 Mg ha−1 year−1 (1% year−1) under optimal conditions and 0.014 Mg ha−1 year−1 under managed drought stress between 1988 and 2010. Results of the only study conducted with early maturing maize cultivars under low N conditions in WCA have shown that grain yield improved from 2.28 Mg ha−1 during the first era (1995–2000) to 2.61 Mg ha−1 during the third era (2007–2012), an increase of 0.165 Mg ha−1 era−1 (Badu-Apraku et al., Reference Badu-Apraku, Fakorede, Oyekunle and Akinwale2015). Under high N, yield increased from 3.20 to 3.65 Mg ha−1, an increase of 0.225 Mg ha−1 era−1. The objectives of this study were to (i) assess the genetic gains in grain yield of extra-early maturing maize cultivars developed during the three breeding eras under low and high soil N; (ii) determine the trait associations for improved performance under low and high N in WCA; and (iii) identify the highest yielding and stable cultivars in WCA.
MATERIALS AND METHODS
Development of Striga-resistant, drought and low soil-nitrogen tolerant extra-early maturing populations and cultivars
Details on methodology and strategies adopted by the Maize Improvement Programme (MIP) of the International Institute of Tropical Agriculture (IITA) for the development of the extra-early maturing open-pollinated populations and cultivars used in the present study has been described by Badu-Apraku et al. (Reference Badu-Apraku, Yallou, Haruna, Talabi, Akaogu, Annor and Adeoti2016). During the first breeding era (1995–2000), the emphasis of the programme was on breeding for resistance to the MSV and high yield potential. During the development of the second era (2001–2006) cultivars, the major breeding emphasis was on recurrent selection for improved grain yield and Striga resistance in two extra-early-maturing source populations TZEE-W Pop STR (white) and TZEE-Y Pop STR (yellow). The populations were developed from materials selected on the basis of high grain yield, earliness and resistance to the MSV and above all adaptation to the heat and drought stresses, which are characteristic of the Sudan savannas in Burkina Faso, Mali, Mauritania, Ghana and Nigeria (Badu-Apraku et al., Reference Badu-Apraku, Oyekunle, Menkir, Obeng-Antwi, Yallou, Usman and Alidu2013c). However, there was no intentional selection for tolerance to low N even though the selection for Striga resistance was conducted using a sub-optimal fertilizer rate of 30 kg N ha−1. Starting from the third era (2007–2012), the source populations were subjected to improvement for tolerance to drought, low N and resistance to Striga, resulting in the development of several extra-early cultivars with combined resistance and/or tolerance to the three stresses (Badu-Apraku et al., Reference Badu-Apraku, Oyekunle, Menkir, Obeng-Antwi, Yallou, Usman and Alidu2013b; Reference Badu-Apraku, Yallou and Oyekunle2013c). Furthermore, genes for low N and/or drought tolerance from selected extra-early inbred lines were introgressed into the drought tolerant, Striga resistant and low N tolerant extra-early maturing populations undergoing the recurrent selection programmes to enhance the levels of tolerance of the populations and the derived cultivars to multiple stresses.
Screening for tolerance to low soil N
Screening for tolerance to low N involved the exposure of the genetic materials to two levels of N fertilizer, 30 and 90 kg N ha−1. The lower level was the testing rate while the higher level served as the control. The two levels were used for selection to ensure that selected low N tolerant genotypes were not necessarily mediocre in performance under high N. Soil tests were carried out and inorganic N fertilizer was added to make up the two levels. Two sites were used for low N screening: Ile-Ife in the forest agro-ecology; and Mokwa in the Southern Guinea savanna (SGS). The sites were depleted of inherent soil N as far as possible as indicated by soil tests. In addition to the specific low N screening sites, the Striga screening sites at Mokwa and Abuja also served as indirect screening sites for low N because only 30 kg N ha−1 was applied to the Striga-infested plots while the non-infested plots that received optimal recommended N rate (90 kg N ha−1) served as the control.
Evaluation of extra-early maize cultivars for response to low and high nitrogen
The 56 extra-early cultivars used in the present study comprised 14, 17 and 25 cultivars from eras 1, 2 and 3, respectively (Table S1, available online at http://dx.doi.org/10.1017/S0014479717000394; Badu-Apraku et al., Reference Badu-Apraku, Yallou, Haruna, Talabi, Akaogu, Annor and Adeoti2016). The cultivars were evaluated under low N (30 kg N ha−1) and high N (90 kg N ha−1) conditions in 2013 and 2014 at the Teaching and Research Farm, Obafemi Awolowo University, Ile-Ife (4°32′E, 7°28′N, 244 m asl, 1200 mm annual rainfall) in the forest agro-ecology and at Mokwa (9о18′N, 5о 4′E, altitude 457 m, 1100 mm annual rainfall), both in Nigeria. A randomized incomplete block design with two replications was used. A plot consisted of two rows, 4 m long, spaced 0.75 m apart with 0.40 m spacing between plants within the rows in all trials. Three seeds were planted per hill. The maize seedlings were thinned to two per stand about 2 weeks after emergence to give a final plant population density of 66 666 plants ha−1. The soil at Mokwa is a luvisol (Soil Survey Staff, 1999) with 0.27, 0.04 and 0.48% organic carbon, organic N and phosphorus concentrations (by volume). On the other hand, the soil at Ile-Ife is characterized as fine-loamy, isohyperthemic Plinthustalf (Soil Survey Staff, 1999) with 0.084% organic nitrogen. The experimental fields were depleted of N by continuously planting maize and removing the biomass after each harvest for a period of 2 years. Soil samples were taken each year before planting for all the test environments and N content was determined at the IITA soil laboratory at Ibadan. The total N in the soils was determined by Kjeldahl digestion and colourimetric determination on Technicon AAII Autoanalyser (Bremner and Mulvaney, Reference Bremner, Mulvaney, Page, Miller and Keeney1982). The soils of the sites used for the trials were very low in N, ranging from 0.84 to 0.87 g kg−1. Fertilizers were applied to bring the total available N to 90 kg ha−1 for the moderately high N field and 30 kg ha−1 for the low N field when the soil N was less than the target N rate. The N-fertilizer was applied in two equal splits at 2 and 4 weeks after planting. Also, single superphosphate (P2O5) and muriate of potash (K2O) were applied to both low and high N blocks at the rate of 60 kg ha−1 at 2 weeks after planting. The trial was kept weed-free with the application of herbicides and by hand weeding.
Data collection
Data were recorded on both low and high N plots for days to 50% anthesis (DA) and silking (DS) as the number of days from planting to when 50% of the plants in a plot had shed pollen and extruded silks, respectively. The anthesis–silking interval (ASI) was calculated as the difference between DS and DA. Plant height was measured as the distance from the base of the plant to the height of the first tassel branch and ear height as the distance to the node bearing the upper ear. Root lodging (percentage of plants leaning > 30° from the vertical), stalk lodging (percentage of plants broken at or below the highest ear node), disease reaction, plant and ear aspects (EASPs) were also recorded. Symptom severity of southern corn leaf rust incited by Puccinia polysora, Curvularia leaf spot incited by Curvularia lunata and MSV transmitted by Cicadulina leaf hoppers as well as Southern corn leaf blight incited by Bipolaris maydis were scored at Ile-Ife, a hot spot location for disease screening. Disease rating was on a scale of 1 to 5, where 1 = slight leaf infection and 5 = severe leaf infection. Ear number per plant (EPP) was obtained by dividing the total number of ears per plot by the number of plants harvested. Plant aspect (PA) was recorded on a scale of 1–5 based on the plant type, where 1 = excellent and 5 = poor. Husk cover was scored on a scale of 1–5, where 1 = husks tightly arranged and extended beyond the ear tip and 5 = ear tips exposed. EASP was based on a scale of 1 to 5, where 1 = clean, uniform, large and well-filled ears, and 5 = ears with undesirable features. In addition, stay green characteristic (STGR) were recorded at 70 days after planting on a scale of 1 to 10, where 1 = almost all leaves were still green and 10 = virtually all leaves were dead (Badu-Apraku et al., Reference Badu-Apraku, Fakorede, Oyekunle and Akinwale2015). Harvested ears from each plot were shelled to determine the grain weight and the percentage grain moisture for the low N experiments. Grain yield was adjusted to 15% moisture and computed from the shelled grain weight. In the high N plots, grain yield was computed based on 80% (800 g grain kg−1 ear weight) shelling percentage and adjusted to 15% moisture content.
Statistical analysis
The analysis of variance (ANOVA) was performed separately for each condition (i.e. low and high N) followed by a combined ANOVA across environments (E) for all measured traits with PROC GLM in SAS using a RANDOM statement with the TEST option (SAS Institute, 2011). In the combined ANOVA, the location–year combinations, replicates and blocks of each experiment were considered as random factors, while era and cultivars (G) were considered as fixed effects. Repeatability estimates of the traits (Falconer and Mackay, Reference Falconer and Mackay1996) under low N, high N and across environments were computed on cultivar-mean basis using the REML method in SAS MIXED procedure (SAS Institute, 2011). Subsequently, the yield data were subjected to genotype main effect plus genotype × environment interaction (GGE) biplot analysis to decompose the G × E interactions across environments (Yan, Reference Yan2001). The GGE biplot was used to identify outstanding single cross hybrids in terms of grain yield and stability across environments. The GGE biplot model equation is as follows:
 $$\begin{equation*}
{Y_{ij}} - {\beta _j} = {\lambda _1}{\xi _{i1}}{\eta _{j1}} + {\lambda _2}{\xi _{i2}}{\eta _{j2}} + {\varepsilon _{ij}}
\end{equation*}$$
where is the genetic value of the combination between Entry i and Tester j for the trait of interest; βj is the mean of all combinations involving Tester j; λ1 and λ2 are the singular values for PC1 and PC2; ξi1 and ξi2 are the PC1 and PC2 eigenvectors, respectively, for Entry i; ηj1 and ηj2 are the PC1 and PC2 eigenvectors, respectively, for Tester j; and εij is the residual of the model associated with the combination of Entry i and Tester j. In the GGE biplot, the thick single-arrow black line that passes through the biplot origin (intercept of the vertical and horizontal axis) and the average tester (centre of the inner-most concentric circle with an arrow) is referred to as the average-tester coordinate axis (ATC). The PROC REG procedure of SAS (SAS Institute, 2011) was used for regression analysis of grain yield on other independent variables under each research condition. Sequential stepwise multiple regression methodology proposed by Mohammadi et al. (Reference Mohammadi, Prasanna and Singh2003) was used to minimize multi-colinearity and organize the predictor traits into first-, second- and third-order paths on the basis of their respective contributions to the total variation in grain yield under low and high N environments. Furthermore, regression analysis was performed using means for grain yield and other traits of the maize cultivars as dependent variables, which were regressed on the year of breeding, the independent variable (expressed as number of years since 1995) to obtain regression coefficient (b-value) under low and high N environments. The relative genetic gain per year was computed as the coefficient of linear regression (b-value) divided by the intercept and multiplied by 100 (Badu-Apraku et al., Reference Badu-Apraku, Fakorede, Lum and Akinwale2009). Furthermore, the relationship between grain yield across environments was graphically analysed for each breeding period using scatter diagrams. For this purpose, the mean values of yield across low N environments were regressed on yield in high N environments and vice versa, using simple linear models.
RESULTS
Analysis of variance for grain yield and other traits
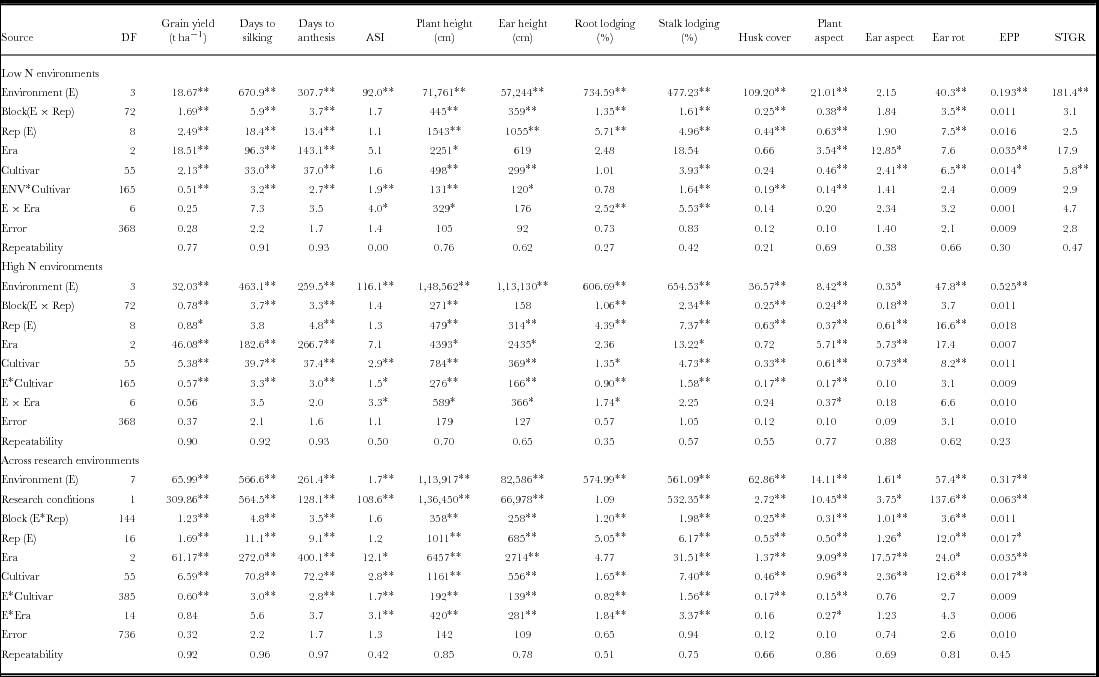
Except in a few cases, the ANOVA showed significant mean squares for each source of variation of the trial for grain yield and all other traits under each research condition (Table 1). A conspicuous consistent exception was the environment × era source of variation in which mean squares for most of the traits were not statistically significant under each condition, a clear indication of lack of variation among the eras under the four location–year environments used in the study. In addition, the environment × cultivar source of variation was not significant for EASP, ear rot (ER) and ears per plant (EPP) under low N, high N and across the two research conditions. Across research conditions, environment, cultivar and environment × cultivar sum of squares accounted for 26, 20 and 23% of the total sum of squares for grain yield, respectively (data not shown). The repeatability estimates of measured traits ranged from zero for ASI to 0.93 for days to anthesis under low N, 0.23 for EPP to 0.93 for days to anthesis under high N and 0.42 for ASI to 0.97 for days to anthesis across environments. The repeatability estimates of grain yield were 0.77, 0.90 and 0.92 under low N, high N and across environments, respectively (Table 1). High repeatability estimates (i.e. ≥ 0.60) were obtained for 50% of measured traits under low N, 62% under high N and 77% across environments.
Mean squares of grain yield and other agronomic traits of extra-early maize cultivars of three breeding eras evaluated under low N and high N environments and research environments at four locations in Nigeria during 2013 and 2014 growing seasons.

*, ** = Significant F test at 0.05 and 0.01 levels of probability, respectively; ASI= Anthesis–silking interval; EPP= ears per plant; STGR= stay-green characteristic.
Genetic improvements in grain yield and other agronomic traits
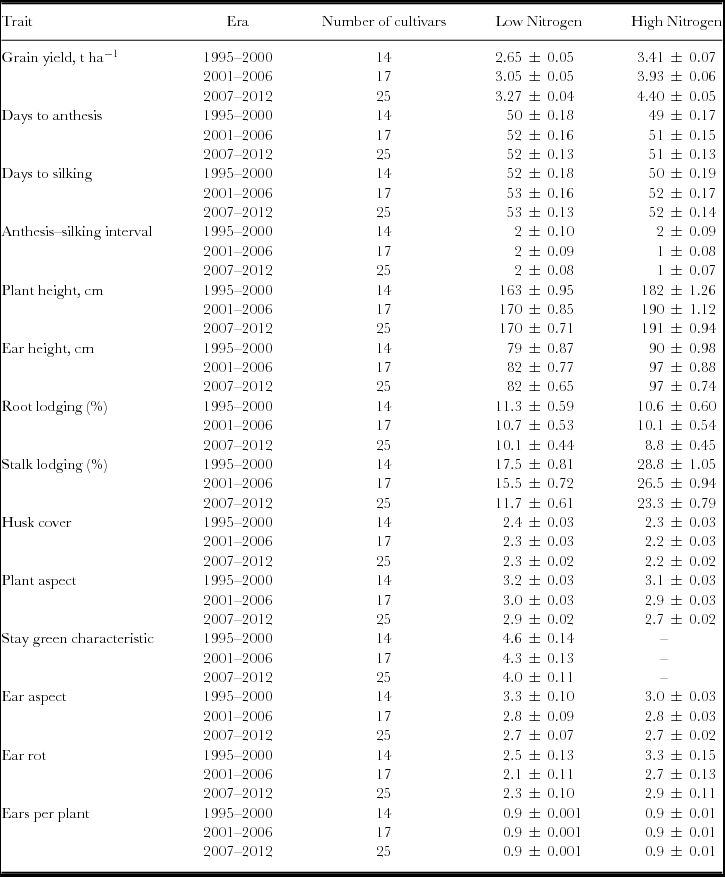
A substantial increase in the grain yield was observed in the third generation of extra-early maize cultivars (era 3) compared to those developed during the first two eras under low N and high N environments (Table 2). Under low N, grain yield increased from 2.65 Mg ha−1 during the first era to 3.27 Mg ha−1 during the third era (Table 2). Similarly, yield improved from 3.41 Mg ha−1 during the first era to 4.40 Mg ha−1 during the third era under high N. The mean grain yield under low N represented 76% of the yield in the same environments under high N. Thus, across environments, the average yield reduction under low N was 24%.
Grain yield and other agronomic traits of extra-early maize cultivars of three breeding eras evaluated under low and high Nitrogen conditions at four locations in Nigeria between 2013 and 2014 growing seasons.

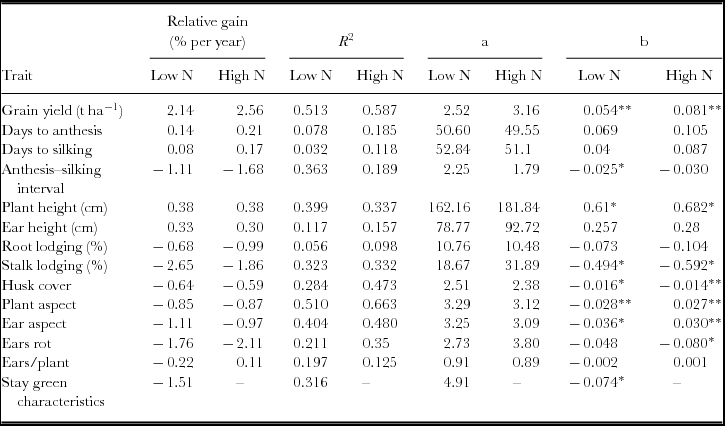
Results of regression analysis of grain yield on era showed that under both low and high N, grain yield increased from the first to the third breeding era with b-values (gain) of 0.3140 Mg ha−1 (13.29%) and 0.4930 Mg ha−1 (16.84%) per era (Figure S1). Moreover, when grain yields under low and high N environments were regressed each on the year of development of the cultivars, grain yield significantly (P ⩽ 0.05) increased by 0.054 and 0.081 Mg ha−1 year−1 corresponding to an annual genetic gain of 2.14 and 2.56%, respectively (Table 3). Significant gains in grain yield obtained under low N were associated with decrease in ASI and stalk lodging, increase in plant height and improved husk cover, plant and EASPs and STGR. However, increase in grain yield was associated with decrease in stalk lodging and ER, increase in plant height and improved husk cover, plant and EASPs under high N environments. It is striking to note that out of the five traits, EPP, ASI, PA, EASP and the stay-green characteristic used in the IITA maize programme base index for selection of low N tolerant cultivars, no improvement in EPP was associated with the genetic gains in grain yield under low N environments (Table 3).
Relative genetic gain, coefficient of determination (R 2), slope (a) and regression coefficients (b) of grain yield and other agronomic traits of 56 extra-early maize cultivars of three breeding eras evaluated under low N and high N conditions at four locations in Nigeria between 2013 and 2014 growing seasons.

*,**=Significantly different from zero at 0.05 and 0.01 level of probability, respectively.
Regression analysis showed that most of the cultivars developed during era 3 were higher yielding than those of the other two eras, except in a few instances where the mean grain yield of cultivars of the three breeding eras overlapped. The regression analysis showed that yield performance under low N closely predicted the yield under high N environments and vice-versa with a corresponding R 2 of 71% under both environments, although the b-value in the former was nearly three times the value in the latter (Figure S2).
Relationship between grain yield and other agronomic traits
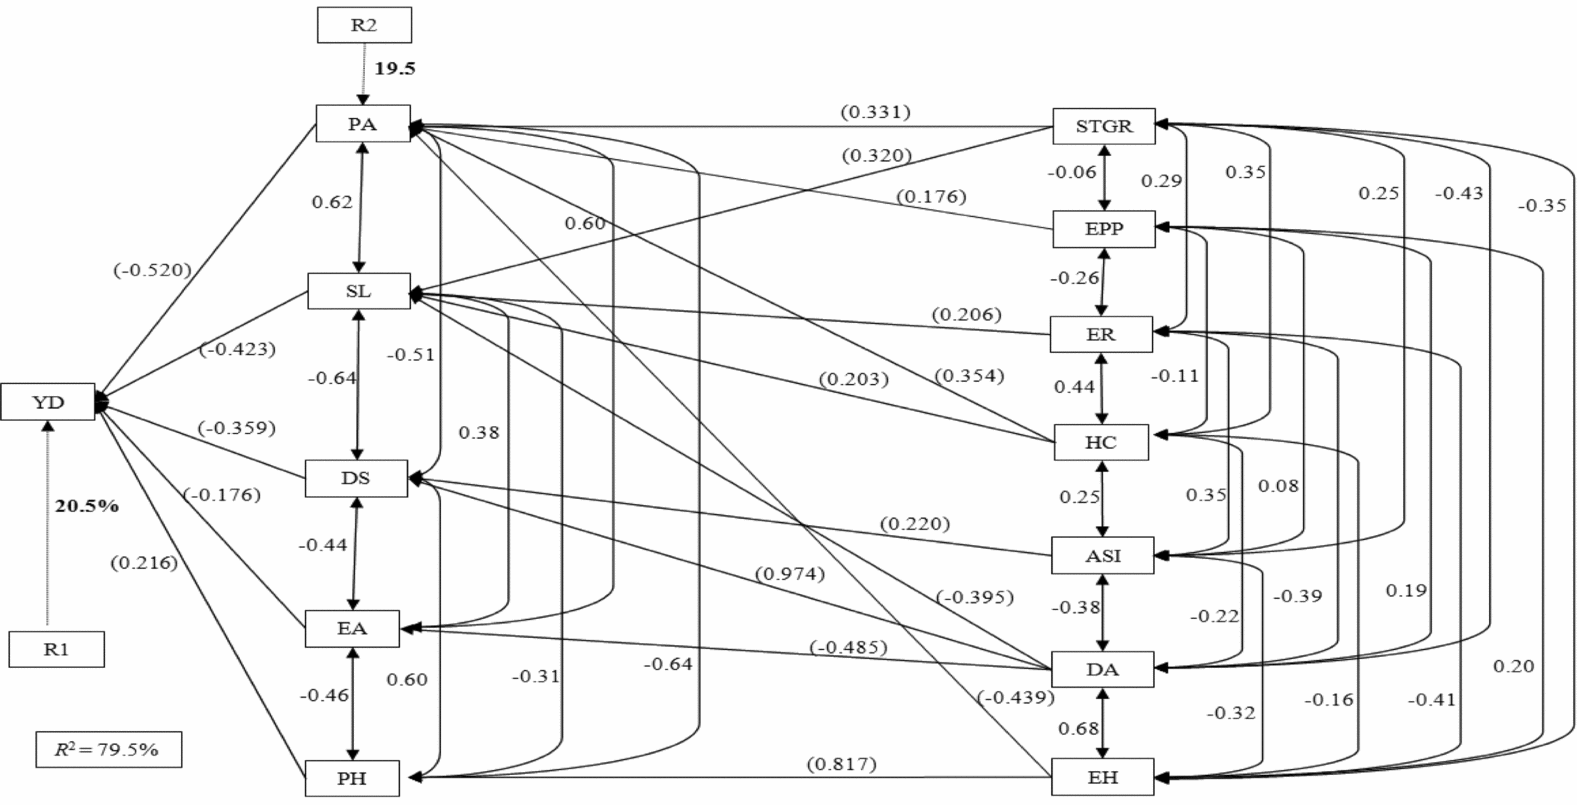
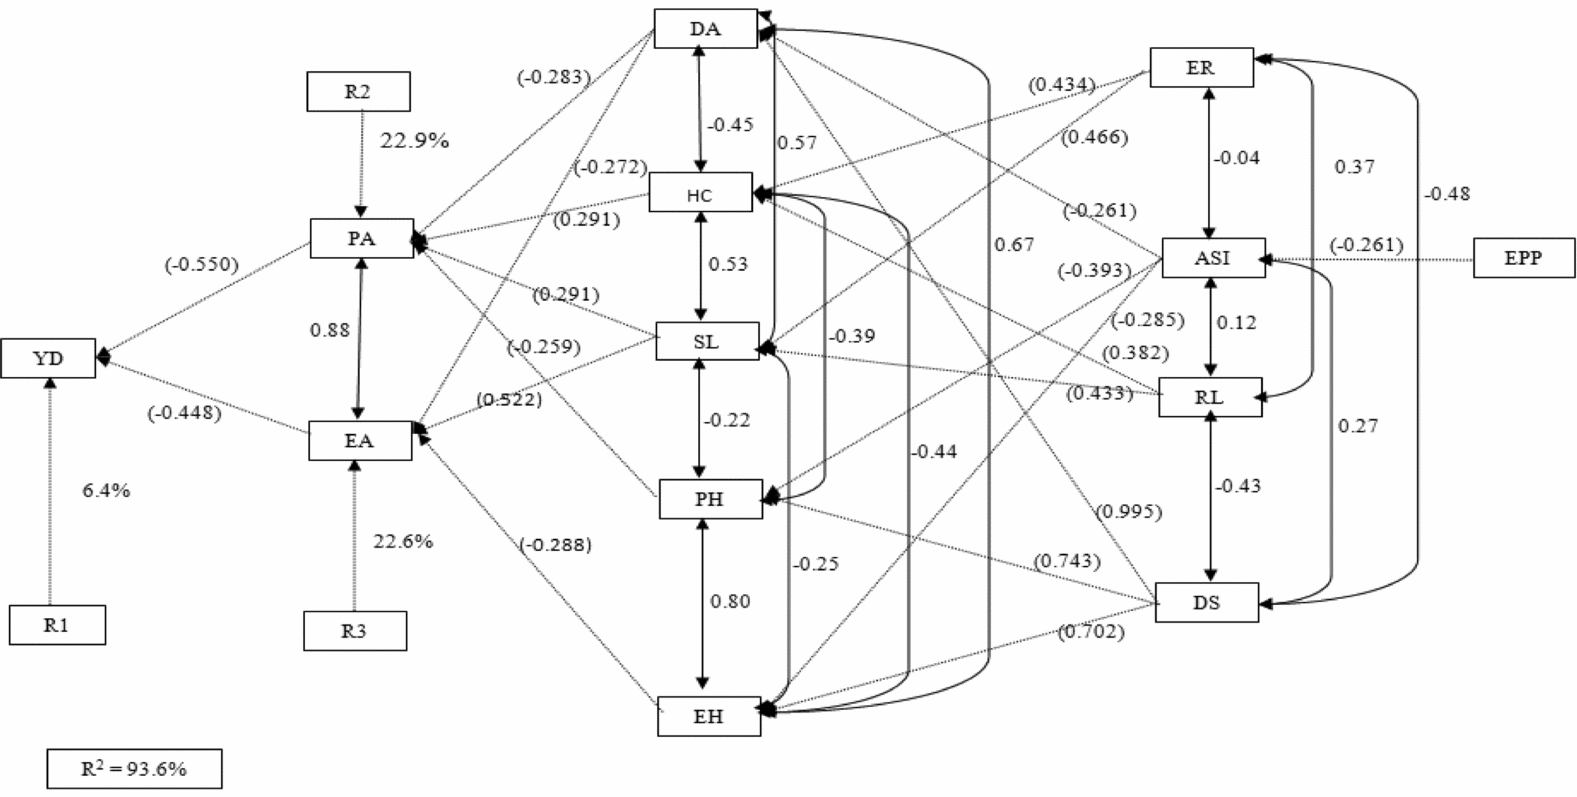
Path diagrams of the causal relationships among traits under each research condition are shown in Figures 1 and 2 for the two N environments, respectively. The pattern and structure of the path coefficients were strikingly different under the two groups of N environments. Whereas the independent traits were separated into two groups containing five and seven traits under low N (Figure 1), the same traits were separated into four groups of 2, 5, 4 and 1 traits under high N (Figure 2). Under low N, PA (P = −0.52), stalk lodging (P = −0.42), days to silking (P = −0.36), plant height (P = −0.22) and EASP (P = −0.18) had direct effects on grain yield that accounted for 79.5% of its total variation. The other seven traits influenced grain yield indirectly through one (EPP, ER and ASI), two (STGR, HC and EH) or three (DA) of the primary traits but none through all five primary traits. The path coefficients of the second group to the first group traits were mostly positive (9 of 12 cases) and relatively low (<0.4 also for 9 of 12 cases). However, the coefficients for DA on DS (P = 0.974) and EH on PH (P = 0.817) were large and positive. Under high N environments, only PA and EASP had direct effects on grain yield, both of which were negative (P = −0.55 and −0.45, respectively); accounting for 93.6% of total variation in grain yield (Figure 2). Only two of the second order traits (DA and SL) affected grain yield indirectly through more than one first order traits, unlike all of the third-order traits that affected first-order traits through two or three second-order traits. Here also, the effects of the coefficients for most of the second- and third-order traits were relatively low and negative. Some striking exceptions to this trend were SL through EA (P = 0.552) and DS through EH (P = 0.702), PH (P = 0.743) and DA (P = 0.995). ER in the third order also had modest effects through HC and SL in the second-order traits (P = 0.434 and 0.466, respectively). In this group of environments, EPP was the only trait in the fourth order and it had indirect effect through only ASI in the third order (P = −0.261).
Sequential path analysis showing relationship between grain yield and other agronomic traits of 56 maize cultivars evaluated under low N conditions at four environments in Nigeria between 2013 and 2014 growing seasons. Values in parenthesis indicate direct effects and those without parenthesis indicate correlation coefficients. ‘R’ means residual effects. Lines with single arrow head imply direct effects and double-arrowed lines indicate correlation between paired traits. YD = grain yield; PA = Plant aspect, SL = Stalk lodging; DS = days to silking; EA = ear aspect; PH = plant height; STGR = stay green characteristic; EPP = ears per plant; ER = ear rot; HC = husk cover; ASI = anthesis–silking interval, DA = days to anthesis and EH = ear height.

Sequential path analysis showing relationship between grain yield and other agronomic traits of 56 maize cultivars evaluated under high N conditions at four locations in Nigeria between 2013 and 2014 growing seasons. Values in parenthesis indicate direct effects and those without parenthesis indicate correlation coefficients. ‘R’ means residual effects. Lines with single arrow head imply direct effects and double-arrowed lines indicate correlation between paired traits. YD = grain yield; PA = Plant aspect, SL = Stalk lodging; DS = days to silking; EA = ear aspect; PH = plant height; EPP = ears per plant; ER = ear rot; HC = husk cover; ASI = anthesis–silking interval, DA = days to anthesis and EH = ear height.

Grain yield performance and stability of extra-early-maturing maize cultivars
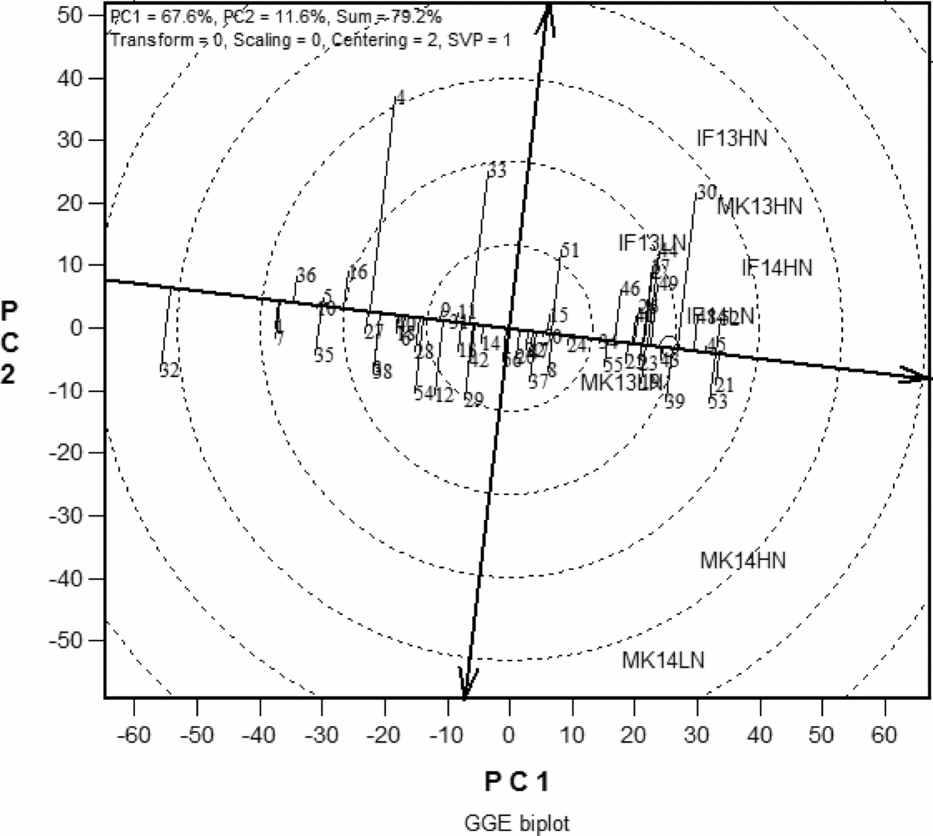
The performance in terms of grain yield and stability of the 56 extra-early maturing maize cultivars of the three breeding eras evaluated under low and high N environments is presented in the GGE biplot (Figure 3). The highly significant genotype and genotype × environment interactions for grain yield across test environments justified the need for the use of the GGE biplot to decompose the genotype × environment interactions and to examine the yield performance and stability of the cultivars across test environments. In the GGE biplot (Figure 3), the average performance of a genotype is approximated by the distance of the projection of its marker from the concentric circle. The double-headed arrow line (ATC ordinate) separates entries with below-average means (to the left side of the line) from those with above-average means. A set of lines representing the entries, run parallel to the ATC ordinate, spanning the whole length of the ATC, which grouped them based on their mean performances. The stability of the genotypes is measured by their projection onto the ATC y-axis single-arrow line (ATC abscissa). The greater the absolute length of the projection of a genotype, the less stable it is. Therefore, Cultivar 45, 2009 TZEE-OR2 STR of era 3 was the most stable, with competitive yield across environments. Other outstanding cultivars that were high-yielding but less stable included 21 (2004 TZEE-W Pop STR C4) from era 2, 48 (TZEE-W STR 104), 52 (TZEE-W STR 108) and 53 (2012 TZEE-W DT STR C5) from era 3.
The entry/tester genotype plus genotype × environment biplot based on grain yield of the 56 extra-early maturing maize cultivars of three breeding eras evaluated under low N and high N environments in Ile-Ife and Mokwa, Nigeria, 2013 and 2014.

DISCUSSION
This study had three objectives, which may be categorized into two broad groups. The first broad group was to assess the improvement in the performance of different extra-early-maturing maize cultivars developed at different times during a 25-year period, and identify the best one for WCA conditions. This group of objectives is most relevant from the farmers’ view point; although we scientists, our employers and donor agencies may derive some satisfaction if, from the results of the evaluation, it is apparent that positive returns to investment has accrued from the research effort. Several approaches were used to achieve this group of objectives, including the ANOVA, statistical comparison of means, regression analyses, specificity and stability of performance of the varieties resulting from the different eras of the study. To a large extent, this approach provided somewhat reliable solution to one major challenge faced by breeders in selecting superior maize cultivars for narrow or wide adaptation during multi-environment testing; that is, the presence of differential response of genotypes to varying environmental conditions. ANOVA is very effective in detecting this differential response and in our study, the presence of significant mean squares for grain yield and most other measured traits for environment (E) under both low N and high N indicated that the environments were unique in identifying superior cultivars. Also, significant genetic differences existed among cultivars within each environment as well as within and among breeding periods for most measured traits. Therefore, the relative ranking of the genotypes was greatly influenced by the complex environments and the era of development. Significant G × E interactions often reduce the correlation between genotypic and phenotypic values of cultivars evaluated under stress environments (Badu-Apraku et al., Reference Badu-Apraku, Oyekunle, Menkir, Obeng-Antwi, Yallou, Usman and Alidu2013c). The lack of significant G × E interaction of some traits was therefore of particular interest in this study. Prominent among the traits that had rather consistent non-significant G × E interactions within eras, among geographic environments and/or between N rates were EASP, ER, EPP and the STGR. The lack of G × E interaction could be attributed to the generally few testing sites used and the uniformity of crop management practices within each group of contrasting testing environments. However, the traits (apart from STGR not included) maintained non-significant G × E interaction even in the ANOVA for the across N environments that had much larger degrees of freedom. These findings implied that the methodology employed for screening genotypes tolerant to low N is effective and repeatable. In contrast, the presence of significant interaction among environments and eras × cultivar-within eras suggested differential responses of the genotypes and the need to identify high-yielding and stable genotypes across low and high N environments (Moghaddam and Pourdad, Reference Moghaddam and Pourdad2009). This result confirmed the need for extensive testing of cultivars tolerant to low N in multiple environments over years before recommending them for release and commercialization (Badu-Apraku et al., Reference Badu-Apraku, Fakorede, Oyekunle and Akinwale2011). The high repeatability estimates (≥60%) observed for most measured traits under each and across conditions suggested that the expression of the traits in the contrasting environments would be consistent.
The yield reduction of 24% under low N in the present study is comparable to the recommended 20% yield reduction required to elicit the differences among maize genotypes under low N environments (Banzinger et al., Reference Banzinger, Edmeades, Beck and Bellon2000). Despite the possible confounding effect of the G × E interaction for grain yield, impressive production improvement in era 3 relative to earlier eras was observed in the present study. For example, mean grain yield of era 3 genotypes was 24 and 29% higher than mean of era 1 under low and high N (Table 2). The mean genetic gains of 0.3140 and 0.4930 Mg ha−1 era−1 (0.054 and 0.081 Mg ha−1 year−1 or 2.14% and 2.56% per year) in grain yield under low and high N environments in the present study are substantially greater than the 0.165 and 0.225 Mg ha−1 era−1 (0.55 and 0.94% per year) gains reported by Badu-Apraku et al. (Reference Badu-Apraku, Fakorede, Oyekunle and Akinwale2015) for early maturing cultivars under low and high N environments, and the 0.41% per year reported by Kamara et al. (Reference Kamara, Menkir, Fakorede, Ajala, Badu-Apraku and Kureh2004) for late maturing maize cultivars developed from 1970 to 1999 in the West African savannahs. However, the gains of 0.054 Mg ha−1 year−1 obtained for the extra-early maize cultivars in the present study was lower than that of 0.085 Mg ha−1 year−1 reported by Masuka et al. (Reference Masuka, Magorokosho, Olsen, Atlin, Bänziger, Pixley, Vivek, Labuschagne, Matemba-Mutasa, Burguenõ, Macrobert, Prasanna, Makumbi, Tarekegne, Crossa, Zaman-Allah, van Biljon and Cairns2017a) for early maturing maize cultivars but comparable to the gains of 0.053 Mg ha−1 year−1 obtained under low N for the intermediate-late maturing maize cultivars of the CIMMYT ESA OPV breeding pipeline. Similar estimates obtained in the USA (for example, Castleberry et al., Reference Castleberry, Crum and Krull1984) was also much lower than those of the present study. Results of the present study and those of an earlier study involving the 56 extra-early cultivars evaluated under Striga-infested and Striga-free conditions, along with those obtained from studies involving 50 early maturing cultivars conducted under drought, Striga infested and optimum environments (Badu-Apraku et al., Reference Badu-Apraku, Oyekunle, Menkir, Obeng-Antwi, Yallou, Usman and Alidu2013b; Reference Badu-Apraku, Yallou and Oyekunle2013c) together led to three deductions: (i) early and extra-early maize respond favourably to selection under imposed abiotic and biotic stresses of SSA; (ii) selection for drought and/or Striga tolerance/resistance improves tolerance to low N but not as much as the response to direct selection for low N tolerance and (iii) selection under stress gives value addition to performance under the non-stress (or optimum) counterpart of the stress conditions.
The breeding approach used in the early and extra-early MIP of IITA is a type of tandem selection. During the first era, the major focus of the genetic enhancement programme was on the selection for drought tolerance and resistance to MSV disease. During the second era, the major breeding emphasis was on recurrent selection for improved Striga resistance with increased emphasis on selection for drought adaptive traits. Beginning from 2007 (the third era), selection for Striga resistance continued but, in addition, the source populations were subjected to improvement for tolerance to drought and low N. Usually, the best materials in one era formed the base populations for improvement in the next era. This strategy resulted in the development of several extra-early cultivars with combined resistance and/or tolerance to the three stresses (Badu-Apraku et al., Reference Badu-Apraku, Yallou, Haruna, Talabi, Akaogu, Annor and Adeoti2016). Improvements in the preceding era definitely made significant positive contributions to the performance of the next era, cumulatively resulting in the outstanding performance of era 3 cultivars compared with the eras 1 and 2 cultivars.
The GGE biplot revealed Cultivar 45, 2009 TZEE-OR2 STR of era 3 as high yielding and most stable cultivar across low and high N environments. In addition, cultivars 21 (2004 TZEE-W Pop STR C4) from era 2 and 48 (TZEE-W STR 104), 52 (TZEE-W STR 108) and 53 (2012 TZEE-W DT STR C5) from era 3 were identified as high yielding but less stable (Figure 3). These cultivars should be further tested on-farm in the sub-region.
Presented here is the report of the first extensive genetic research of extra-early maize in WCA, covering nearly a quarter of a century. Outstanding materials developed in each era have been submitted for international trials, and a number of them including 2000 SYN EE-W STR, 2000 SYNEE-W STR QPM, TZEE-Y POP STR C4, TZEE-W Pop STRC4, 2008 SYN EE-W DT STR, 2008 SYN EE-Y DT STR, 2012 TZEE-W DT STR C5, 2012 TZEE-Y DT STR C5, 2013 TZEE-W Pop DT STR and TZEE-W STR 104 BC2 have been released as varieties in the different WA countries. The genetic gains made in the study are quite encouraging, evidence that improved varieties can continue to be developed and released for commercial production in the near future. However, the breeders should not expect such high gains to continue, unless appropriate preparations are made and adequate precautions are taken to pre-empt decreased responses. Such preparations could include introgression of new sources of favourable alleles for the desired stress tolerance or resistance, study of the best strategy to sustain improved response, development of optimum stress screening sites, identification of secondary traits for improved response under stress, and development of efficacious methodology that would make research execution progress at minimum cost. Scientists at IITA, in collaboration with national scientists in WCA, have initiated investigations into nearly all of these areas, although more work needs to be done for perfection. For example, screening sites for drought, Striga and low N have been identified and are being used in our research, including the study reported here.
The second group of objectives of the present study, which may be considered a stand-alone objective, focused on one of areas cited above; that is, determination of trait associations for improved performance under low and high N in WCA. Here also, ANOVA was used to establish statistically significant genotypic and genotype × environment variation of the secondary traits. In addition, correlation, stepwise regression and sequential path-coefficient analyses were used to partition the secondary traits into groups and their level of influence on grain yield (the primary trait) under low, high and across N environments. The ANOVA showed significant genotypic variation and G × E interaction for most of the traits, thereby establishing the fact that selection can be done among the varieties under different environmental conditions. Regression analysis clearly showed that selection under low N improved grain yield of the selected material, not only under low N but even better under high N. This justified the breeders’ decision to select for tolerance to low N under 30 kg N ha−1. Similar trends have been found for Striga resistance and drought tolerance in some other studies (Badu-Apraku et al., Reference Badu-Apraku, Fakorede, Oyekunle and Akinwale2015).
In crop improvement, breeders need much information on causal-and-effect relationships among several traits, including the primary trait, which is grain yield in maize. Consequently, breeders use multivariate statistics to minimize the chances of misleading interpretations based on correlation coefficients alone. Sequential path coefficient analysis effectively led to clearer knowledge and understanding of the interrelationships among the traits evaluated in the present study (Figures 1 and 2). Apart from the STGR (assayed under only low N environments), the same traits were determined under low and high N. The structures of the path diagrams of the traits with grain yield were strongly influenced by N level. Whereas under low N, the secondary traits were only in two groups, they were in four groups under high N (Figures 1 and 2). However, two traits – PA and EASP were common to both N levels in the first group of secondary traits having direct effect on grain yield. In earlier studies, IITA scientists (Badu-Apraku et al., Reference Badu-Apraku, Fakorede, Oyekunle and Akinwale2011; Badu-Apraku et al., Reference Badu-Apraku, Akinwale and Oyekunle2013a) have reported that the STGR, plant and ear aspects, husk cover and plant and ear heights were the most reliable traits for selecting for improved grain yield in low N environments. Results of our study justify the use of some of these traits. The decrease in ASI, and improvement in EASP, PA and STGR, which were associated with the gains in grain yield under low N justifies the inclusion of the traits in the IITA base index for selecting for improved grain yield under low N environments. It is striking, however, that EPP, which has been used in the base index for selecting early maturing genotypes tolerant to low N (Lafitte and Edmeades, Reference Lafitte and Edmeades1994), was not among the traits associated with increased grain yield (Figure 2). Under low N, means for this trait had little or no changes from era 1 to era 3, whereas grain yield improved drastically among the eras. An important selection strategy for extra-early maize germplasm, therefore, is to keep the traits plant height, ear height and days to flowering (anthesis and silking) constant so that the extra-early cultivars do not become unnecessarily later maturing and/or taller.
In conclusion, substantial progress has been made in breeding for high yielding and low N tolerant cultivars during the past three decades. The outstanding cultivars identified in this study should be extensively tested in on-farm trials in WCA and promoted for adoption to contribute to food security in the sub region.
Acknowledgements
The financial support of the Drought Tolerant Maize for Africa (DTMA) Project and the International Institute of Tropical Agriculture (IITA) for this study is appreciated. We are grateful to all staff of IITA maize programme, Ibadan and of Obafemi Awolowo University Teaching and Research farm for the technical assistance.
SUPPLEMENTARY MATERIALS
For supplementary material for this article, please visit https://doi.org/10.1017/S0014479717000394.