


Introduction
The 15 year CLIVAR research programme (WCRP, 1995) has now begun. It has as one of its aims “to describe and understand the physical processes responsible for climate variability and predictability on seasonal, interannual, decadal, and centennial time-scales, through the collection and analysis of observations and the development and application of models of the coupled climate system". Until recently, most studies of variability on these time-scales were focused on the tropics, but it is now clear that the Antarctic region exhibits great variability in these temporal windows, though wc still have no comprehensive picture of the mechanisms driving this variability. Some of this variability can be traced back io the tropics (e.g. remote effects of the El Nino-Southern Oscillation (Reference Smith and StearnsSmith and Stearns, 1993; Simmonds andjacka, 1995; Reference Karoly, Hope and JonesKaroly and others, 1996)), while other aspects appear to be related to the high-latitude interactions of atmosphere, ice. ocean and bottom water formation (e.g. Reference Manabe and StoufferManabe and Stouffer, 1996).
In keeping with the spirit of CLIVAR, in this paper we discuss some observational and model analyses pertaining to multi-decadal variability in the sub-Antarctic region. The low-frequency variations in surface pressure, cyclone behaviour, sea ice and the semi-annual oscillation (SAO) are connected by complex physical processes, and aspects of these associations are addressed in this paper. We also report on some model experiments which were undertaken to reveal the natural variability displayed by the SAO in a long simulation, and its sensitivity to the removal of Antarctic sea ice.
Variability and Trends in Pressure Over The Sub-Antarctic
In exploring this topic, we have made use of the daily global meteorological analyses performed by the European Centre for Medium-range Weather Forecasts (ECMWF) (the operational analyses, and not the re-analysis set). These analyses are presented on a 2.5° x 2.5° latitude-longitude grid and are available at 00 and 12 UTC. Trenbcrth (1992) performed an evaluation of this dataset, and documented changes which have occurred in the assimilation system which produced them. We have here made use of the analyses for the period 1 January 1980 to 31 August 1996.
Trends in summer (December- February) MSLΡ determined from the ECMWF dataset for the period 1980-96. The contour interval is lhPa per decade, the zero line is bold, and negative contours are dashed. Regions over which the trends differ significantly from zero (at the 95% confidence level) are indicated by stippling.

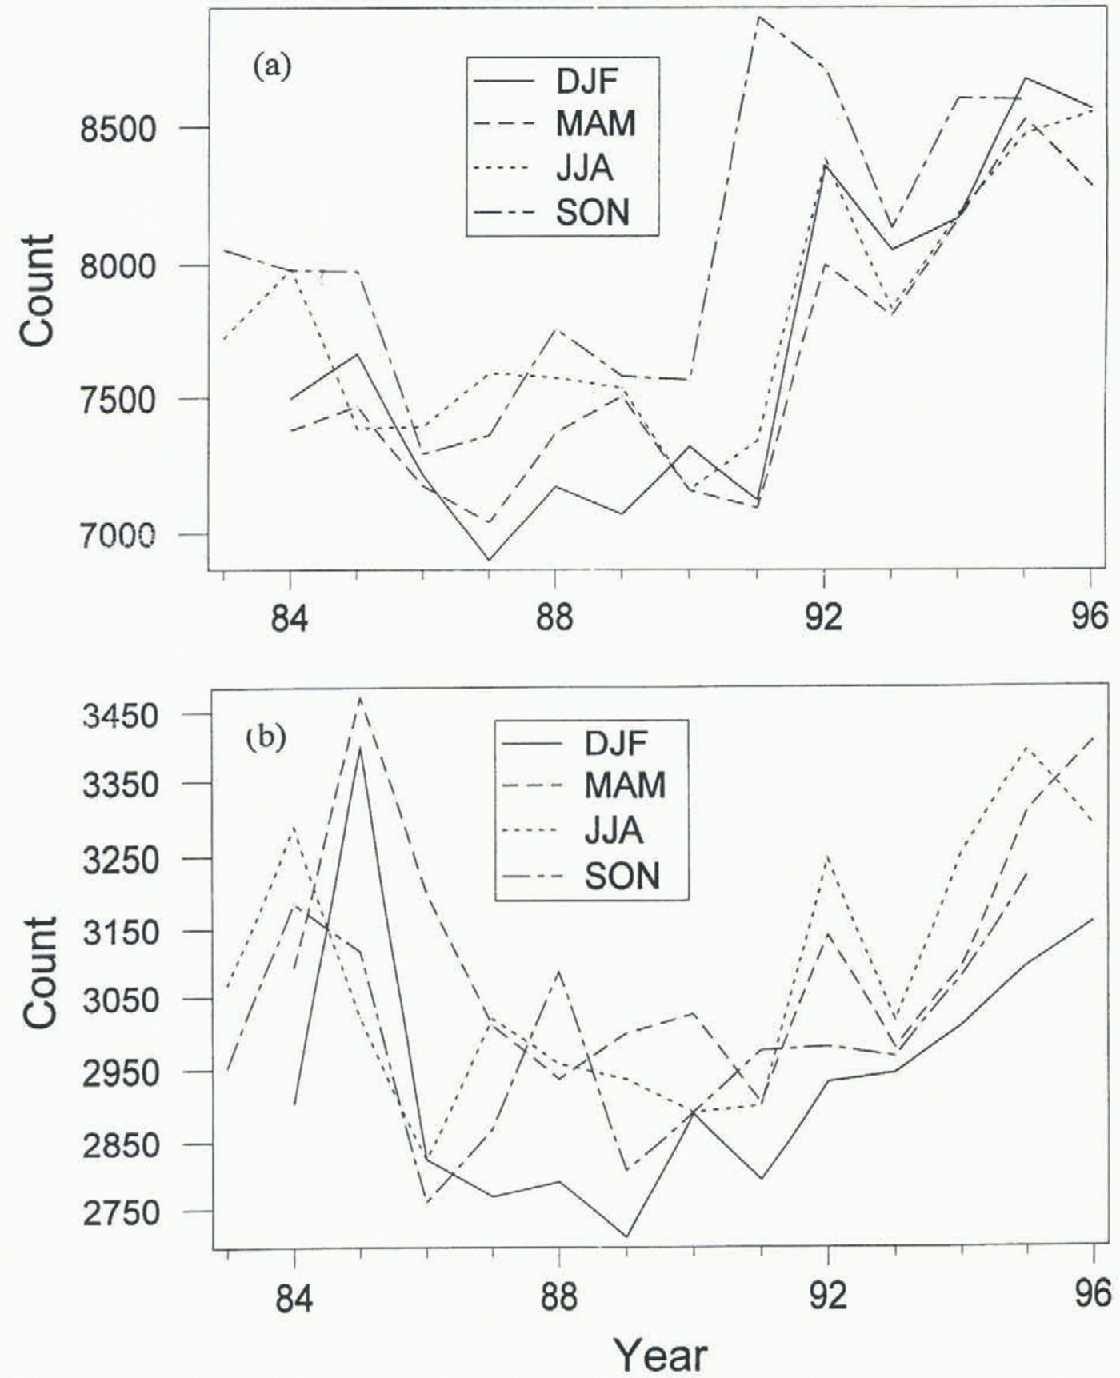
Total cyclone-position counts (number of cyclones identified overa specified region over all the analyses considered) from the ECMWF twice-daily analyses for the period 1 June 1983 to 31 August 1996. The counts have been performedfor the four seasons and for (a) the entire Southern Hemisphere, and (b) 50~70° S.
To set the scene for the ensuing discussion, we present in Figure 1 the trends in summer (December-February) mean sea-level pressure (MSLP) over the period. We can see that the greatest trends revealed over the Southern Hemisphere (SH) occur in the sub-Antarctic region (and exceed 5 h Pa per decade in the eastern Ross Sea and 3hPa per decade near 50° S in the eastern Pacific). It is natural to ask whether these and other trends can be regarded as “real” or are a manifestation of the improved observational data base and better quality-analysis techniques. We shall comment on this below, but, for whatever reason, our “best guess” of the structure of the atmosphere in the sub-Antarctic region shows considerable variability.
A distinctive aspect of the atmosphere in the mid- to high latitudes of the SH is the presence of large numbers to intense, mobile cyclonic systems. These are linked with daily “weather” over a significant fraction of the hemisphere and, particularly, in the coastal regions of Antarctica. These systems are associated with considerable southward fluxes of heat and moisture, and hence play an important role in the maintenance of the global energy and hydrological cycles (see, e.g., Reference Peixoto and OortPeixoto and Oorl, 1992). The study of these systems is an important component of understanding the workings of SH weather and climate and, in particular, the Antarctic environment. Because these systems influence, and are influenced by, the background climate, it is important to quantify the extent to which the behaviour of cyclones has shown variability over this period. To examine this, we have applied the objective Melbourne University cyclone-tracking scheme to the twice-daily ECMWF analyses for the 16 year period. The scheme used is described in Simmonds and Murray (in press) and is an enhanced version of the original Reference Murray and I.Murray and Simmonds (1991) algorithm. That scheme has been applied to a variety of problems associated with synoptic behaviour in extratropical regions (Jones and Simmonds, 1993; Simmonds and Wu, 1993; Reference Murray and SimmondsMurray and Simmonds, 1995; Simmonds and Law, 1995; Godfrcd-Spcn-ning and Simmonds, 1996; Walland and Simmonds, 1997).
For our purposes here, we present information on the total ryclone position count (i.e. we sum the number of cyclones identified over a specified region over all the analyses considered and note, in particular, that a given cyclone system will be counted as many times as it appears in the twice-daily analyses). figure 2a shows the time series of this count for the four seasons, where the counting is performed over the entire SH. (The figure has made use of the cyclone data only after April 1983. Our analysis, and that of Reference SinclairSinclair (1994), revealed a marked increase in the total number of cyclones present in the ECMWF analyses after this time, which coincided with the date that the ECMWF model was changed from a gridpoint to a spectral model with envelope topography.) The numbers exhibit considerable interannual variability, as well as longer-term variations. When the count of cyclone positions is performed only over the sub-Antarctic region (here defined as the latitude range 50-70° S) the numbers displayed in figure 2b are obtained. It will be observed that of all the positions identified over the SH, between one-third and one-half of these are found in this 20° latitude bell. The high density of cyclones in (his latitude range has been found by many other authors, and appears in the recent comprehensive study of Reference Turner, Marshall and Lachlan-GopeTurner and others (1998). The sub-Antarctic region displays even more variability, on both interannual and longer time-scales, than did the count over the whole hemisphere. There is a suggestion of a positive (rend in the last decade of the series, although the most recent values are comparable with those diagnosed in the mid-1980s. It is interesting to note that Jones and Simmonds (1993) found that the mean central pressure of sub-Antarctic cyclones identified in the Australian analyses assumed its lowest values in the second half of the 1980s, a period which appears to show more modest numbers in the ECMWF analyses.
Links With Sea Ice
It is natural to ask whether the variability exhibited here in the cyclone numbers is related to that seen in the sea-ice extent around the continent. The notion of such an association has strong intuitive appeal. Sea ice has a strong modulating effect on latent- and sensible-heat fluxes and on the position and strength of baroclinic zones in the high southern latitudes. Any of these factors has the potential to alter cyclone characteristics. A number of studies have appeared in the literature which appear to support these connections, but many of these were undertaken over specific regions or with short periods of ice and cyclone data. Some recent studies have demonstrated the spontaneous effects of individual warm-air incursions and storm activity on sea-ice extent. For example, Reference Jacobs and ComisoJacobs and Comiso (1993), Reference KingKing (1994) and Walkins and Simmonds (1995) have shown that 5 day numerical forecasts (and, in particular, modelled cyclone behaviour) in the Antarctic region are sensitive to the nature of the sea-ice specification. However, such findings may connote little about the connections between the interannual (or longer) variability of cyclones (and possibly climate) and sea ice. It is now becoming well established that the nature of the relationship between climate parameters may change according to the time-scales considered.
Godfrcd-Spenning and Simmonds (1996) undertook the first comprehensive analysis of relationships between the interannual variability of cyclone characteristics and Antarctic sea-ice extent. They found, at best, very weak signals across the 18 years they analyzed.
Variations in Strength of Semi-Annual Oscillation
A fundamental characteristic of the high-southern-latitude circulation which has been shown to exhibit considerable decadal variability is the semi-annual oscillation (SAO; e.g. Reference Van Loon, J. W. and MullanVan Loon and others, 1993; Reference Hurrell and van LoonHurrell and Van Loon, 1994). This oscillation is understood to have its origins in the annual march of the tropospheric temperature differences between the southern oceans and the Antarctic continent (e.g. Reference Van LoonVan Loon, 1967, Reference Van Loon1972; Reference MeehlMeehl, 1991). The oscillation itself results from the complex thermodynamics and dynamics of the SH ocean-atmosphere-ice system. This leads to meridional temperature gradients (and hence baroclinic regions) in the middle troposphere between 50° S and the Antarctic continent that exhibit a significant half-yearly periodicity. A number of authors (e.g. Meehl, 1991; Reference TrenberthTrenberth, 1991; Jones, 1994) have explored the association between the SAOs of the pressure and transient eddy activity. There are good reasons to believe that temporal changes in the SAO of pressure would be accompanied by changes in the seasonality of cyclone properties, Reference Enomoto and OhmuraEnomoto and Ohmura (1992) drew attention to the complex relations between year-to-year differences of the seasonal cycle of sea ice and the SAO of pressure.
Because the reliable instrumental record covers less than a century at high southern latitudes, assessment of the degree of variability of climate parameters at very low frequencies cannot be undertaken directly. Models have been useful in extending our understanding of the characteristics of variability. A number of research groups are now running long experiments with their coupled models; the 1000 vear integration of the state-of-the-art Geophysical Fluid Dynamics Laboratory (GFDL) model is an example (Stouffer and others, 1994). We have examined the temporal behaviour of the SAO in this long run, with a view to quantifying its magnitude of variability and the time-scales associated with it. The model SAO displays temporal variability on interannual and decadal time-scales which is similar to that present in the observational record, strongly suggesting that the model has the appropriate physics to simulate the SAO variability with some realism.
To highlight the modelled very low-frequency oscillations in the amplitude of this phenomenon, we have computed the second seasonal harmonic based on calendar-month data smoothed using a 50 year running mean (average of the 50 sequentialjulys for example). The zonal means of the surface pressure for these series are given in Figure 3 (for clarity, only every tenth value is plotted). in agreement with the observations, the greatest amplitudes are simulated in the region south of 60°S. The simulation of the maxima in mid-latitudes is not so impressive. Simmonds and Walland (1998) have shown that the model produces little semblance of the peak in the South Indian Ocean, whereas the maximum in the South Atlantic is simulated somewhat too far north and is weaker than observed. It should be mentioned, however, that due to low-frequency variations and/ or different data qualities, the published SAO climatologies show very large differences in the mid-latitudes (e.g.
Time latitude series of the zonal-average amplitude of the SAO in surface pressure in the GFDL 1000year integration. Harmonics are computed from data that have been smoothed with a 50year running mean. The contour interval is 0.5 hPa, and regions over which the values are > 1.5 hPa are stippled.
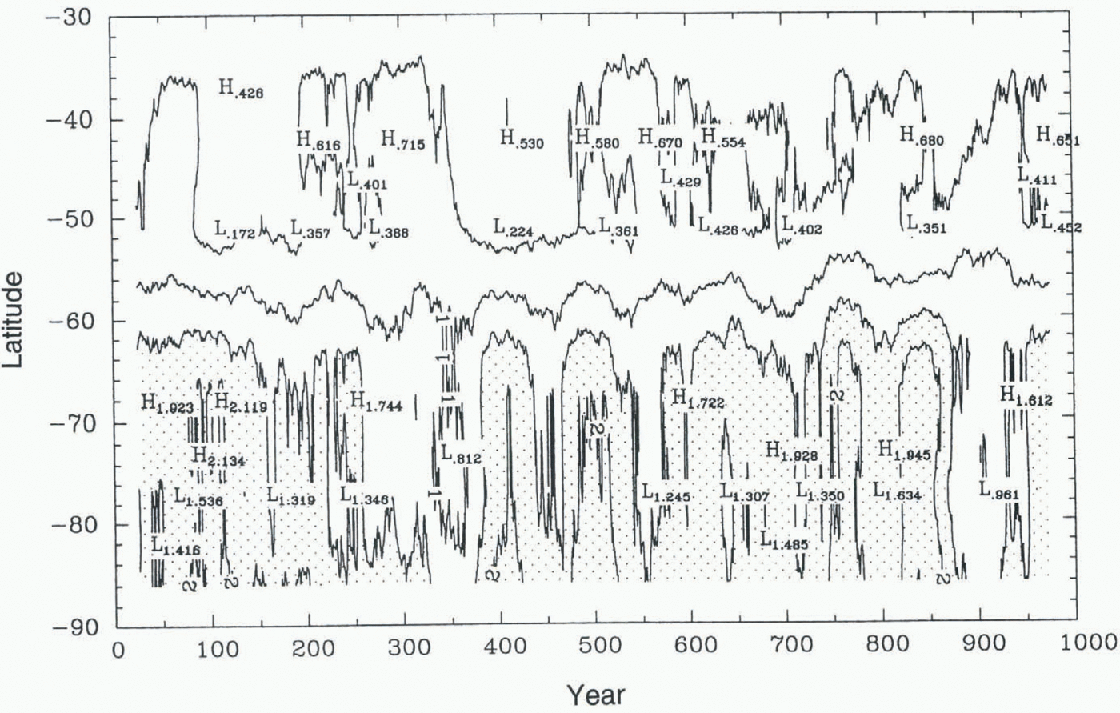
Simmonds and Walland, 1998, fig. 1; Van Loon, 1972, fig. 4.7; Hurrell and Van Loon, 1994, Tigs 5 and 6), so it is not clear against which wc should evaluate the 1000 year integration.
A striking feature in the plot is the significant amount of temporal variability on these long time-scales. There are long periods where the semi-annual component of the surface pressure is quite strong, and others where it becomes weak. Specifically, the amplitudes for the first 200 years are large. This is followed by a period of about 200 years where the half-yearly wave is much smaller and which, in turn, is succeeded by intervals in which the strength of the SAO oscillates. Hence, there are significant variations in the amplitude of the SAO on a broad spectrum of time-scales in a realistic coupled model, and the variations are comparable with those observed as far as the limited amount of observational data will allow.
We have commented above that the SAO in surface pressure owes its existence to the differing thermal characteristics of the climate system at about 50°S and to the south, To obtain a greater feeling for the sensitivity of the SAO (and to allow some appreciation of flow it may have behaved during epochs over the Earth's history when the climate was very different from today's), we performed a numerical experiment to test the response of this feature to the elimination of the Antarctic sea ice. The model used in the study was the Melbourne University global climate model (GCM) (see, e.g., Simmonds and Law, 1995). For the experiments conducted here, use was made of the R21L09 version, and the annual cycle of sea-surface temperatures was prescribed. The “control” was obtained from a 20 year integration of the model. in the anomaly experiment all sea ice was removed at all times of the year and replaced by open water at -1.8°C; this case was run for 6 years.
The spatial distribution of the amplitude of the SAO simulated in the control run is presented in figure 4a. The model is able to simulate the structure of the SAO with reasonable verisimilitude, particularly in the environs of the Antarctic coast. When the sea ice is removed, the spatial structure of the SAO (fig. 4b) is considerably changed. It will be noticed that a strong SAO signal has invaded the interior of the Antarctic continent. in addition, the amplitude of the semi-annual wave has increased considerably everywhere south of 60° S, and maxima in excess of 4hPa are found to the north of Byrd Land and Wilkes Land. These results demonstrate a very strong response of the SAO to changes in sea ice, and this has implications for periods when the sea-ice distribution did not resemble today's.
Discussion and Concluding Remarks
As we pointed out earlier, one of the aims of CLIVAR is to describe and understand the processes responsible for climate variability on a range of time-scales, through the analysis of observations and application of models of the coupled climate system. Our task here has been to highlight the spectra of both observed and modelled variability of some important climate parameters in the sub-Antarctic region.
Spatial distribution of the amplitude of the semiannual oscillation as simulated in the Melbourne University GCM for (a) the control simulation and (b) the case where all Antarctic sea ice had been removed. The contour interval is 0.5 h Pa and regions over which the values are > 1.5 hPa are stippled.

We have seen that the number of cyclone positions in the 50-70° S latitude band shows considerable interannual variability, as well as changes on longer time-scales. Some of the implications of this for the Antarctic region have been raised by Cullathcr and others (1996) in connection with the mass balance of the continent. We have pointed out the connection between the semi-annual oscillation and the seasonal distribution of cyclones. The recent work cited above shows that the SAO undergoes considerable temporal variation. We have examined this phenomenon in a 1000 year run of the GFÜL coupled model. The spectrum of SAO variability shows “red” characteristics, in that there is enhanced variability in the very low frequencies. We are confident that the nature of the variability exposed here is a faithful representation of what occurs in the real atmosphere. Firstly, the characteristics of modelled SAO variability on decadal time-scales are similar to those displayed in the available observations. Secondly, the results have been produced by a comprehensive and reliable coupled ocean-Atmosphere-sea-ice model. The mechanisms which generate the SAO are intimately tied up with the characteristics and interaction of these three media, and it is clear that studies of the sort undertaken here can be expected to give a guide to actual climate behaviour if these elements are treated in a realistic manner. Manabe and Stouifer (1996) reported on a very red signal and considerable multi-centennial variability in the surface temperature exhibited in the dataset used here (and such behaviour is seen in other climate models (e.g. WCRP, 1995, fig. 4.5)). They compared this with another simulation, with the same atmospheric model coupled to a simple mixed-layer ocean model. It was found that the two models produced relatively similar temperature temporal variability over most of the globe, except in the high southern latitudes. This implies that to simulate variability realistically in this climatologically complex region of the world a genuine coupled ocean atmosphere ice model is required.
Finally, we comment on the caution which must be exercised when analyzing variability and trends in the sub-Antarctic region. in the Brst place, it is a region over which few climatological data are collected. in addition, the domain is host to very complex physical processes which have yet to be treated in a fully integrated fashion in numerical models. It is clear that, for example, the number and distribution of sub-Antarctic cyclones is influenced significantly by the sophistication of the scheme which produces the operational analyses. Such analysis schemes are becoming more refined and are producing a more accurate picture of the atmosphere. However, while this progress has been taking place over the last few decades, so too have advances in the quantity and quality of data which have been inserted into them. (One may mention the quality and resolution of remotely sensed products, the interpretation of imagery, buoy data, automatic weather stations, etc.). The degree to which variability in cyclone numbers, for example, can be attributed to these “artificial” effects is difficult to assess. The products of the various “re-analysis” projects will provide useful material in this determination.



