I. INTRODUCTION
Fuel cells are electrochemical devices that convert the energy of a chemical reaction directly into electricity, with heat as a by-product.Reference Li1 The fuel and oxidant (oxygen or air) are supplied externally and this enables them to continue operating as long as they are fed with oxidant. In other words, fuel cells are devices that convert the chemical energy of a fuel directly into electricity and operate without a quantum jump in the energy-conversion efficiency with virtual elimination of pollution. The cell requires no emission–control devices as used in conventional energy-conversion devices.Reference Arico, Shukla, Kim, Park, Min and Antonucci2 Fuel cells are a rapidly developing energy-conversion technology, which offers higher efficiencies than conventional technologies and they also operate quietly. Their modular construction means they can be economically and easily scaled down to small sizes to fit many applications.Reference Thomassen, Borresen, Scott and Tunold3 According to Gangeri et al.,Reference Gangeri, Centi, La Malfa, Perathoner, Vieira, Pham-Huu and Ledoux4 fuel cells have received increasing attention recently because they are able to convert chemical energy directly into electricity in an efficient way without environmental pollution. The fuel cell process is very similar to the electrochemical process by which a battery generates power; at one electrode, a fuel such as hydrogen is oxidized, and at the other electrode an oxidant such as oxygen is reduced. The reactions exchange ions through a solid or liquid electrolyte and electrons through an external circuit. There are typically two principal differences between a fuel cell and a battery. The first is that, in a fuel cell, the electrodes themselves are not chemically changed during the reaction. The second is that fuel cells are open systems, with fuel and oxidant flowing through the cell, whereas batteries are typically closed systems containing a set amount of fuel and oxidant that are gradually consumed via chemical reaction.Reference Siegel5 Fuel cells can therefore provide power continuously as long as the reactants are supplied and this feature makes them highly useful in situations where the duration of a power outage is uncertain.Reference Choi, Howze and Enjeti6 The fuel cell ionic current varies with fuel cell type: in solid oxide cells, for instance, oxygen ions travel from cathode to anode.
Several processes are involved in the operation of a fuel cell. The processes can be summarized as: gas transfer to the reaction sites, electrochemical reaction at those sites, transfer of ions and electrons and their combination at the cathode. Gases must diffuse through the electrode leaving behind any impurities which may disrupt the reaction whereas liquid produced at the surface of the electrolyte, or added through humidification must be either added to the electrolyte for hydration, or drawn away from the reaction sites so as not to block reaction sites. Gases move toward the reaction sites based on the concentration gradient between the gas channel (high concentration) and the reaction sites (low concentration). Platinum is used as an electrocatalyst in most fuel cells. Since it must be physically supported to allow minimum concentrations (to reduce the cost), the support and the platinum become the electrode. The concentration gradient refers to the difference between the concentration of free flowing gas in the channels and the concentration at the platinum reaction sites. This gradient varies depending on the pressure and temperature of the gases and the diffusion coefficient of the electrode material. When the gas comes near the reaction sites, the flow is dominated by a capillary action based on the reaction rates at the sites.Reference Hirschenhofer, Stauffer and Engleman7
Two main electrochemical reactions occur in a fuel cell: one at the anode and the other at the cathode.
At the anode:

and at the cathode:

which together give the result:

At the anode, the reaction releases hydrogen ions and electrons whose transport is crucial to energy production. The ions build up on the anode creating a positive potential, which pushes the outer ions away from the anode. The ions transfer through the electrolyte either by remaining connected through an attraction to a water molecule that travels through the electrolyte, or by transferring between water molecules. The hydrogen side of the water molecule contains a slight positive charge, which attracts the ions and may become attached to it, but the attraction is weak so any bindings that are made are easily broken. The actual method of transfer varies, but is based on the thickness of the membrane, the amount of water in the membrane and the number of ions transported. Thus, the anode contains a net positive charge whereas the cathode, toward which the ions drift, contains a negative potential.
Acid in the electrolyte serves to provide structure for the electrolyte as well as a barrier to electrons. It is conducive for electrons to flow through materials whose electrons are held loosely (conductive materials) because of the process of electron transport. Thus, electrons move from the reaction sites on the anode through the gas diffusion section of the electrode, through the anode current collector, through a load to do work, across the cathode current collector, through the gas diffusion section of the electrode on the cathode and then to the catalyzed reaction sites on the cathode. The electrons do not move through the electrolyte because the acid chains hold their electrons tightly and thus constitute an electric insulator. Other criteria for selecting an electrolyte are its structural stability, low resistance to ionic movement and low porosity. If the fuel cell were perfect in transferring the energy resulting from the formation of water, it would create 1.20 volts with little heat. Since the theoretical voltage is a function of the number of electrons, the free energy of the fuel involved and the temperature of the reaction, the voltage may be increased using a higher temperature. Unfortunately, there are some inefficiencies that tend to reduce the actual voltage. These are: ohmic, activation and concentration.Reference Larminie and Dicks8
The losses in galvanic elements in the delivering of current are determined by the kinetics of the electrode reactions, the physical structure (geometry) of the cell and the type of electrolyte used. These losses are called “polarization” since the early days of electrochemistry.Reference Keith, Meiser and Sanctuary9–Reference John, Petrucci, McCreary and Perry12 Polarization summarizes a multitude of phenomena, which are related to the kinetics of the electrode reactions and to the state of the dynamic equilibrium. Specifically, they are influenced by the ionic mobility of the reaction partners (by the mass-transport situation in porous structures), and even respond to factors in the cell design. The predominant cause of the difficulties in attaining high-energy efficiencies and high power densities in low-to-medium-temperature fuel cells is the low electrocatalytic activity of most electrode materials for an oxygen electrode reaction. The hydrogen electrode shows a linear relationship of its half-cell potential versus current density plot from zero to the highest value of current density in the fuel cells. Thus, at low current densities (100 mA/cm2), the entire loss in fuel cell potential from the reversible value is due to activation overpotential at the oxygen electrode. That reversible potential is not attained even at zero current density, for this reaction is very slow compared with the reaction (for example, oxidation at platinum electrocatalyst). The net result is that the open circuit potential is a mixed potential which is lower than the reversible potential for the H2–O2 fuel cell reaction by about 0.1–0.2 V. Thus, even at close-to-zero current densities, the efficiency of a cell is lower than its theoretical value by 8–16%. This relation may be expressed as a cell potential E, versus current density i, from a current of zero to the value at the end of the linear region as shown in Eqs. (4) and (5).

where, 

The parameters b and io are the Tafel slope and exchange current density for the oxygen reduction reaction respectively. R and ηohm (ohmic polarization, mV) account for the linear variation of overpotential (predominantly ohmic) with a current density that is observed in the intermediate range. The relationship between the current delivered by an electrode and its change in potential under that load is sometimes discussed as transfer polarization (overvoltage). However, the theoretical treatment of the situation can be based on consideration of an equilibrium state where the current flow is a function of a voltage difference. The overvoltage difference determines the amount of current flow. If not, another overvoltage type is present, which is the case if a current is small. If so, then the deviation from the equilibrium state is also small.
In this study, samples of membrane electrode assembly (MEA) were prepared using various loadings of platinum catalyst electrodes and sulfonated membrane at constant conditions of duration, temperature and pressure. The performance of the MEA samples was studied in a single proton exchange membrane (PEM) fuel cell with reference to the catalyst loading, whereas the durability of this material was also tested over a period of 600 min. The kinetic behavior of the cell was studied and compared using Tafel and Hirschenhofer equations.
II. MATERIALS AND METHODS
A. Preparation of the electrodes
Platinum (Pt) nanoparticles were impregnated on carbon nanotubes (CNTs) using incipient wet impregnation method to form the platinum–carbon nanotube (Pt–CNT) catalyst, which was used to prepare the electrodes. The preparation and characterization of the Pt–CNT catalyst had been reported elsewhere.Reference Afolabi13, Reference Afolabi, Abdulkareem, Iyuke, Coville and Pienaar14 A low–pressure spray apparatus was used to prepare the catalyst electrodes. This apparatus was used to deposit the Pt–CNT catalyst on the carbon paper. Carbon paper of 310 μm thickness was cut into 5 × 5 cm taking into consideration that the reaction surface area was 25 cm2. Different platinum loaded CNT catalyst samples were stirred with nafion solution for 12 h to form a homogeneous ink. This mixture was poured into the spraying equipment and fitted with argon at 1.5 MPa pressure. The spraying was done to ensure an even spread of the catalyst ink on one side of the carbon paper. The resulting catalyst electrode sample was allowed to dry at room temperature before it was coupled with a sulfonated membrane to make the MEA unit.
B. Fabrication of the MEA
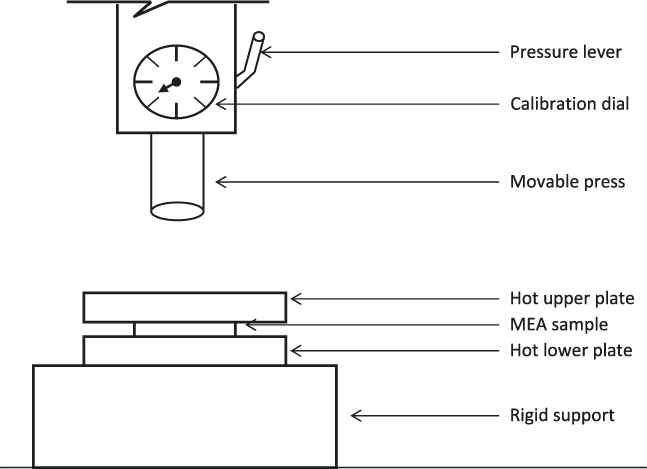
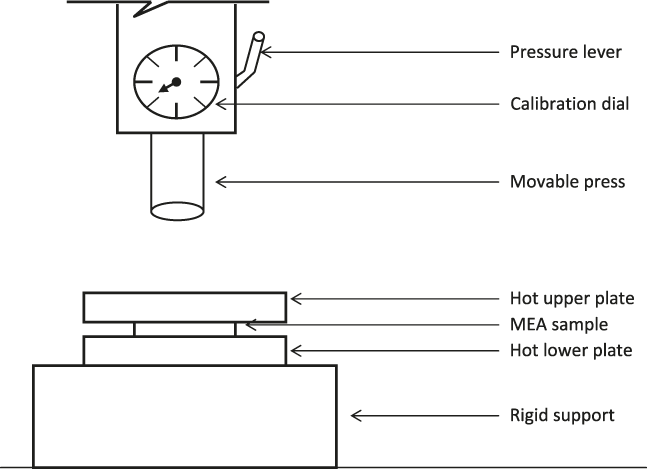
The conventional hot–press technique was adopted for the fabrication of the MEA used in this work. The hot press equipment shown in Fig. 1 (Svenska Nanometerfabriken, Stockholm, Sweden) was used for the fabrication of this unit. The sulfonated electrolyte membrane used in this study was synthesized by other researchers in this laboratory as reported elsewhere.Reference Abdulkareem15, Reference Idibie16 The sulfonated electrolyte membrane was pretreated by immersing it in boiling 3% hydrogen peroxide in water for 1 h. This was followed by immersing it in boiling sulfuric acid for another 1 h to ensure full protonation of the sulfonate groups as much as possible. The membrane was rinsed in boiling deionized water for another 1 h to remove any traces of acid The treated membrane was then sandwiched with the coated surfaces of two electrodes and hot–pressed at 100 °C and pressure of about 1196 kN/m2 for 3 min. The resultant unit was allowed to cool to room temperature.
Hot press equipment for the fabrication of MEA.
C. Testing of MEA
The fabricated MEA was tested using a single PEM fuel cell. The major components of this unit consisted of two graphite plates, the fabricated MEA, gaskets containing the gas inlet and outlet, and ribbed-grooved channels for distribution of the fuel gases behind the porous gas–diffusion electrodes. The MEA was placed between the two graphite plates with the Teflon-coated gasket placed between the membrane and each of the graphite plates to prevent leakage, and to avoid excessive compression of the electrodes. Copper wires were used as current collectors and were positioned behind the graphite plates. Two stainless steel end-plates with bolts and nuts were used to compress the overall assembly, with Teflon sheets for electric insulation placed between the single cell and the end-plates.
The single cell was installed in a fuel cell testing apparatus equipped with gas sources, temperature control, gas flow-rate control rotameters, back pressure regulators for both hydrogen and oxygen, and a load of resistant box. High purity (99.99%) hydrogen and oxygen gases (Afrox, Johannesburg, South Africa) were used in the operation as fuel and oxidant respectively. Hydrogen was passed through a humidifier at room temperature to wet the gas and this gas was fed into the anode at an excess flow rate of 712 mL/min and 20 kPa whereas humidified oxygen entered the fuel cell through the cathode at an excess flow rate of 433 mL/min and 15 kPa. The electrons generated from the anode were connected to a digital multimeter (1906 Competing Multimeter), with an external variable resistance to measure the current and voltage produced by the cell. The multimeter was used to measure the voltage and current with an accuracy of ± 0.001 V and ± 0.001 A, respectively. The cell performance of each MEA was determined from its polarization curve, plotted between voltage and current density. The power density was also calculated.
III. RESULTS AND DISCUSSION
A. Analysis of the catalyst electrodes
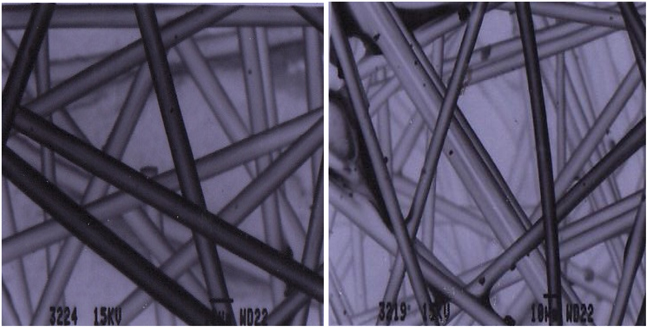
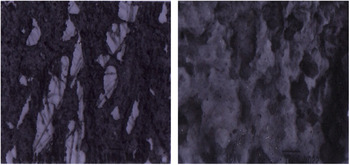
Carbon fiber paper (or carbon cloth) has been used both as an effective electrode substrate and as a catalyst support in fuel cells due to its network-like and highly porous structure.Reference Wang, Waje, Wang, Tang, Haddon and Yan17–Reference Tzeng, Hung and Ko22Figure 2 shows the SEM images of the carbon paper used for the preparation of catalyst electrodes in this work. It is seen that the paper is made of woven carbon fibers, which are themselves made from graphitized polysaccharide or pitch fibers. The SEM images of the carbon paper coated with catalyst ink (the electrodes) are shown in Fig. 3.
SEM images of carbon paper used in this study.
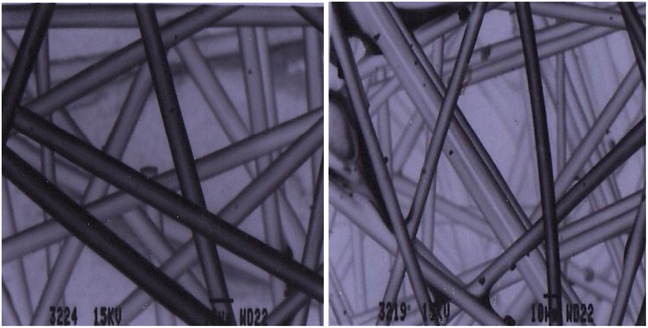
SEM images of the electrode samples.

Figure 3(a) shows the electrode with a single layer catalyst coating whereas Fig. 3(b) is the electrode with a double layer catalyst layer coating. The thickness of the coating determines the platinum loading on the electrodes.
B. The performance of MEA in a single PEM fuel cell
Coupling of membrane and electrode together to form a single unit is the final step in the fabrication of the MEA. The performance of an MEA depends critically on the activity of the anode and cathode electrocatalysts. Hence, the procedure and preparation of the MEA play an important role in the distribution, efficiency and electrocatalytic activity of the electrocatalysts, with direct consequences on the fuel cell performance.Reference Song and Pickup23–Reference Frey, Friedrich, Jorissen and Garche25 A typical MEA used to test the performance of the electrodes has the following composition and dimensions:
Carbon paper support = 310 μm
Diffusion layer = 530 μm
Catalyst layer = 220 μm
Solid polymer electrolyte = 220 μm
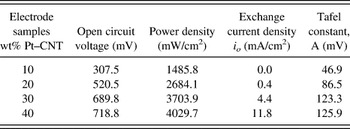
The characteristics of the fabricated electrodes for a single PEM fuel cell (25 cm2) operated at 25 °C are shown in Table I. In the running of the cell, the fuel gases (hydrogen and oxygen) diffused through the porous backing layer whereas at the gas/electrolyte interface the gases dissolved and then diffused to the electrolyte/electrode interface. Electrocatalytic reaction on the catalyst layer preceded the gas adsorption at the electrode surface whereas ionic transport occurs in the electrolyte but electronic transport takes place in the electrode. The polarization curve in Fig. 4 shows the behavior of MEA samples in terms of cell potential and current density. It can be observed from the figure that higher potential and corresponding higher current densities are obtained at higher loadings of the electrode. This indicates that the performance of the electrodes improves with increase in Pt loading in the catalyst layer when made by the same fabrication process and run at the same operating conditions. This higher performance of the cell at the higher current densities of these electrodes can be attributed to the smaller particle size and lower agglomeration of the Pt particles in these catalysts.Reference Afolabi, Abdulkareem, Iyuke, Coville and Pienaar14 The relative performance of PEM fuel cell depends strongly on the electrical conductivity of the CNT support as well as the ability of the catalyst support to transport electrons to the current collector of the MEA. The large voltage drops recorded in the polarization curve in the region of low current densities indicates the slow kinetics of the oxygen reduction reaction at the cathode of the cell.
Polarization curve of a single cell operated at 25 °C with H2:O2 ratio of 1:2.

Characteristics of the fabricated electrodes.

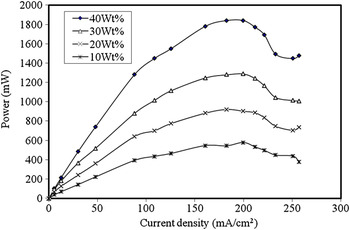
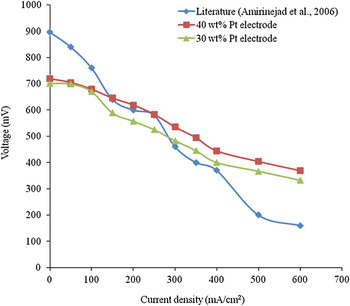
The power density values of the electrodes are plotted in Fig. 5 as a function of the current density. From the figure, it is seen that the power density increases with Pt loading on the electrodes. Thus, the power density increases from 23.12 mW/cm2 in the 10 wt% electrode sample to 36.83 mW/cm2 in 20 wt% electrode sample, and from 51.58 mW/cm2 in 30 wt% to 73.68 mW/cm2 in 40 wt% electrode sample. The values of voltages and corresponding current densities obtained in this cell were recorded at room temperature of about 25 °C. Most authors operate their cells at elevated temperature to obtain slightly higher values of voltages and current densities.Reference Liu and Norskov26–Reference Song, Tang, Zhang, Zhang, Wang, Shen, McDermid, Li and Kozak31Figure 6 shows the comparison between the polarization curves for Amirinejad et al.Reference Amirinejad, Rowshanzamir and Eikani29 single cell, which was operated at 50 °C with the experimental curves obtained in this work. It is observed from the figure that the open circuit voltage from the literature (897 mV) is slightly higher than the experimental open circuit voltages obtained (718 mV for 40 wt% Pt and 700 mV for 30 wt% Pt) in this study. This difference can be attributed to the slightly higher temperature (50 °C) used in the former study since all other conditions of the two cells were the same. The temperature effect, which affects the output of fuel cells, is caused as a result of activation losses in the cell.
Power density versus current density for a single cell (25 cm2) for electrodes operated at 25 °C.

Polarization curve showing the open voltage for experimental and literature in a single cell operated with H2:O2 ratio of 1:2.

Activation losses, which are those losses associated with the initial dramatic voltage losses in PEM fuel cells, are usually high when PEM fuels are operated at low temperatures.Reference Rayment and Sherwin32 These losses are basically representative of a loss of overall voltage at the expense of forcing the reaction to completion, which is forcing the hydrogen to split into electrons and protons, and for the protons to travel through the electrolyte, and then combine with the oxygen and returning electrons. This loss is often termed overpotential, and is essentially the voltage difference between the two terminals. Therefore, it can be predicted that the performance of this cell would have been higher if operated at higher temperature since the activation loss at high temperatures is minimal. This is due to the fact that the value of exchange current density (io) increases almost two orders of magnitude over the span of operational temperatures used. Also increase in the operational pressure will reduce the activation losses since the higher the pressure at the cathode the quicker the reaction will be “forced” to take place.
The effects of humidification of inlet gases on the fuel cell performance were not fully studied in this work, but both the anode and cathode were humidified during the reaction. The temperature of the cell was constant at 25 °C and the humidification temperature is equal to the cell temperature when humidified fuel and oxidant were used. It was observed that low voltages and corresponding current densities were obtained when dry inlet hydrogen gas was used which indicates that humidification of the fuel gas has a considerable effect on the performance of the cell. This behavior can be explained by the lower ionic conductivity of the membrane in dry conditions. The proton must be transferred from the anode side through the membrane to the cathode side of the cell and humidified anode side can enhance this operation. In the same vein, full hydration of the membrane is necessary to enhance its ionic conductivity and according to Abdulkareem,Reference Abdulkareem15 the water uptake of the sulfonated membrane is very high and takes about 96 h for full hydration of the membrane. This further explains why both inlet gases were humidified. The thickness of the membrane was uniform at 220 μm as conductivity is directly related to the membrane thickness.
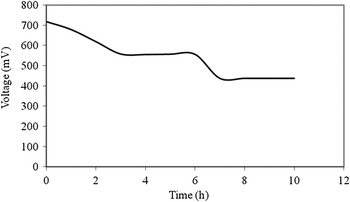
An attempt was made to investigate the long-term testing of the MEA in the cell. This experiment could not be properly conducted due to practical constraints. However, the cell was run for 600 min and the result obtained is presented in Fig. 7. From this figure, it is seen that the cell voltage decreases gradually from the open circuit voltage value of 718 mV until some stability was attained between 555 and 558 mV for about 180 min before it finally decreases to 438 mV after 420 min and this value is maintained for the final duration of the experiment.
Performance durability of a single cell (25 cm2) for electrode operated at 25 °C.

The efficiency of a PEM single cell for a particular electrode is given by Larminie and DicksReference Larminie and Dicks8 in Eq. (6) as:

where μf is called fuel utilization coefficient = mass of fuel reacted in cell/mass of fuel inputed to the cell.
Based on the stoichiometric ratio of hydrogen to oxygen in the PEM fuel cell system, 2 mol of hydrogen are required for 1 mol of oxygen to produce 2 mol of water as stated in Eq. (3). This is however, not the case in the practical PEM fuel cell, as not all the hydrogen passed into the cell is completely consumed by oxygen. The exchange current density has been identified as the major parameter controlling the performance of electrons in a PEM fuel cell.Reference Iyuke, Mohamad, Kadhum, Daub and Rachid33 Therefore, an increase in this parameter results in an increase in efficiency of the cell. From Table I, it can be observed that the values of the exchange current density increase with increase in Pt loading on the catalyst. In other words, the electrode efficiency decreases in the order: 40 wt% > 30 wt% > 20 wt% > 10 wt%.
C. Kinetics of the PEM fuel cell
In fuel cells, the overvoltage, ΔV, due to kinetics of the reaction is a function of the current density (which is directly proportional to the rate of reaction) and is often described by the Tafel equation given in Eq. (7) as;
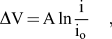
where, A is the Tafel constant (volts), io is the exchange current density (mA/cm2), which is the value on the Tafel plot when the current begins to move away from zero.
The Tafel equation was therefore used to model and predict the voltage of this PEM fuel cell system at room temperature of about 25 °C. The theoretical maximum voltage of most fuel cells is usually taken as 1200 mV. This is called the “open circuit voltage”. In this cell, the open circuit voltage is 718 mV and any deviation from this maximum value is termed overvoltage. This deviation allows useful statements to be made about the kinetics of the fuel cell reactions. For every cell system there is a critical current called the “exchange current density” (io). When the current densities i < io , the cell voltage is equal to the theoretical value and for current densities i < io , there is a rapid fall in cell voltage, due to a slow reaction rate constant (kinetics). Therefore, it is important to have as high a value of io as possible, and as rapid kinetics as possible.
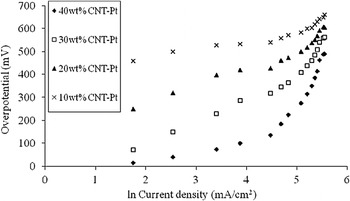
Figure 8 shows the Tafel plot obtained from the polarization curve of the MEA fabricated with varying Pt loading on the electrodes. The best–fit lines of the points obtained from the figure are stated in Eqs. (8)–(11) as:
For 40 wt% catalyst electrode:

Tafel plot for overpotential of a single cell operated at 25 °C.

For 30 wt% catalyst electrode:

For 20 wt% catalyst electrode:

For 10 wt% catalyst electrode:

From the Tafel plot in Fig. 8, using the open circuit voltage of 718 mV obtained during the experiment (and not the theoretical value of 1200 mV), it is observed that an MEA fabricated with 30 and 40 wt% catalyst electrodes obeys the Tafel equation. This is due to the fact that the Tafel equation is not obeyed at high values of overvoltage.Reference Keith34 Therefore the two catalysts that obey the Tafel equation are suitable for modeling the performance of the catalyst electrode in the cell.
Comparing Eq. (7) with the linear equation obtained in polarization plot of 40 wt% catalyst in Fig. 4, [i.e., Eq. (8)] gives:

Eq. (8) can be re written as:

Solving the Eqs. (12) and (13) above yields A, value equals to the slope of Eq. (13) and equation obtained in MEA fabricated with 40 wt% Pt catalyst electrode.
Therefore, A = 125.9 mV(0.1259V).
To solve for i o, the intercept of Eq. (13) is equal to—A ln io, so that A ln io = 311, 125.9 ln i0 = 311, so that ln i 0 = 2.4702
i o = 11.8 mA/cm2.
Substituting the values of A and io in Eq. (12) gives;
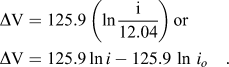
Therefore, Eq. (14) can be used to model the performance of 40 wt% Pt catalyst electrode used in the cell, whereas the cell voltage can be obtained from the overpotential value of the electrode. Thus:


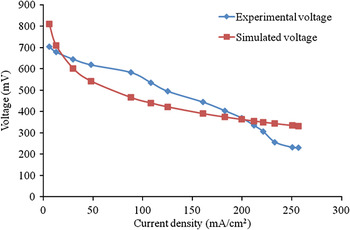
Equation (16) above is used to simulate the performance of this electrode and the result is compared with experimental voltage as shown in Fig. 9.
Experimental and simulated polarization of 40 wt% Pt catalyst electrode.

It is noted that the deviation of the voltage from ideal value of 1200 mV is fairly high when compared to the values measured in the laboratory. This is suspected to be due to ohmic losses within the cell, which might have been caused during MEA fabrication. To improve the model, the expression of Hirschenhofer et al.Reference Hirschenhofer, Stauffer and Engleman7 shown in Eq. (17) can be used to predict the voltage of the cell.
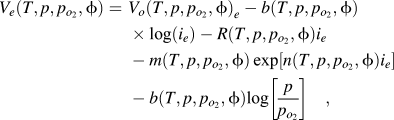
where Ve = cell voltage (mV), T = temperature (°C), p = total pressure (kPa), pO2 = partial pressure of oxygen (kPa), Vo = open circuit voltage (mV), b = Tafel constant (mV), io = current density (mA/cm2), and R = membrane resistance (Ohm/cm2), m = fitting constant which is taken as flooding constant of the cell and n = oxygen concentration (mol/dm3).
Equation (17) provides more accurate information on the cell voltage since it incorporates the inefficiencies of the activation polarization, ohmic polarization, and the concentration polarization. The constants: Vo, b, R, m and n, depend on the type of MEA, the type of oxidant, and the local pressure, temperature, humidity and oxygen concentration for the elemental unit. The simplified form of Eq. (17) can be written as:

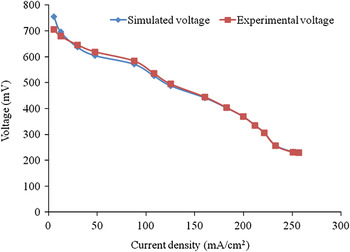
where Vcell is the simulated cell voltage, b = Tafel constant, R = resistance of the membrane, p = total pressure (kPa) and pO2 = partial pressure of oxygen (kPa). The fitting constant has an exponential relationship with the current density i.e., m = 193.4 exp−13.9io and the resistance of the membrane, R = 0.57344 Ohm/cm2.Reference Abdulkareem15, Reference Idibie16 The cell performance in relative to the electrode is modeled by substituting the cell data for 40 wt% Pt catalyst electrode in the Eq. (18) and the results obtained were compared with the experimental voltage as shown in Fig. 10.
Hirschenhofer’s model of voltage of 40 wt% Pt catalyst electrode.

It is seen from Fig. 10 that the Eq. (18) gives a good model of the performance of the 40 wt% Pt catalyst electrode in the cell with correlation factor, R2 = 0.996. The good conformity of this model can be attributed to other dependent factors, which were incorporated in the model. This is in contrast to the performance obtained in the Tafel model (Fig. 9) in which conditions such as ohmic resistance and activation polarization were not incorporated in the model.
IV. CONCLUSIONS
The analyses of results obtained from the MEA operated in the PEM fuel cell showed that the performance of the cell improved with increase in the loading of the catalyst on electrodes. Thus, the MEA fabricated with 40 wt% catalyst electrode produces the maximum potential, exchange current density, Tafel constant and power density values. The cell maintained stability for 600 min at 438 mV and its efficiency increased with increase in the catalyst loading on the electrode and the exchange current density. The MEA fabricated with 30 and 40 wt% Pt catalyst electrode conformed to the Tafel equation whereas the remaining MEA fabricated with 10 and 20 wt% catalyst samples did not obey the Tafel equation due to large values of their overpotential. Hirschenhofer and Tafel equations were used to model the performance of the catalyst electrode in the cell and the simulated voltages obtained from the former showed a better conformity with the experimental voltage compared with the latter.
ACKNOWLEDGMENT
The financial support provided by the National Research Foundation (NRF) is highly appreciated.