Introduction
The combined effects of demographic changes, including the ageing of populations, and increasing fiscal costs have motivated public policy across most of the developed world to give greater attention to pensions and pension policy reform. One result of this has been a shift towards private pension provision, generally intended to complement social insurance based state pension payments in retirement, and providing associated taxation supports to encourage individuals to contribute to these pension products (Orenstein, Reference Orenstein2008: 14; EC, 2012: 12-13; OECD, 2015: 9, 27-29; OECD, 2017a: 144).
These supports, notably classified by Titmuss (Reference Titmuss1958) as ‘fiscal welfare’, are expensive, in terms of revenue forgone, with the latest estimates suggesting they cost a total of more than $200 billion (£160bn; €180bn) per annum across the twenty-one OECD member states where data is available (OECD, 2017a). Previous research, summarised later in the article, has consistently found these tax expenditures to have regressive distributive outcomes, with their benefits concentrated among those with the highest incomes in society. This is a significant distributive policy finding, given the scale of funds involved and the recurring nature of this policy. However, little is known about the gendered impact of these fiscal welfare supports: do they favour males over females or are they skewed towards women who will, on average, live longer and thereby require greater resources to support retirement?Footnote 1
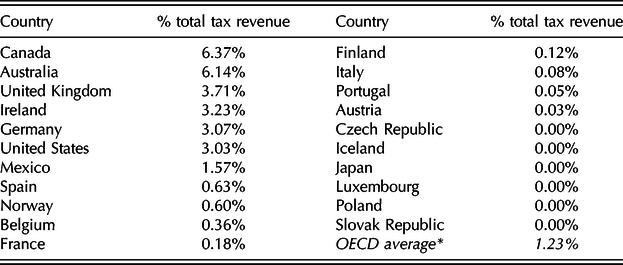
As a means of addressing this deficit, this article considers the effectiveness of private pension taxation supports from a gender perspective in one OECD state. Ireland is chosen as a case-study for a number of reasons. First, it is one of six member states that spend the equivalent of more than 3 per cent of total annual taxation revenue on pension tax breaks (see Table 1). Such supports, albeit part of what Howard (Reference Howard1997: 26) called the ‘hidden welfare state’, represent a large and frequently ignored area of social policy provision in these nations. Second, it is an exemplar of states with a liberal pension system who have prioritised non-state provision via supports for the occupational and private pillars of pensions (Ebbinghaus and Whiteside, Reference Ebbinghaus and Whiteside2012: 275; Hughes and Maher, Reference Hughes, Maher, Murphy and Dukelow2016). Similarly classified nations (Canada, Australia, United Kingdom and the United States) feature alongside it in Table 1 reflecting their pursuit of a pensions policy pathway which asserts the importance of private markets in pensions provision (Pierson, Reference Pierson and Pierson2001: 432; OECD, 2014, 2018a: 19; Bridgen, Reference Bridgen2019: 19).Footnote 2 Third, it has the advantage of available and detailed individual and household data on income, earnings, pension contributions and socio-economic characteristics which facilitate a detailed empirical engagement with the aforementioned deficits.
Tax Breaks for Private Pensions in OECD States, as a % of total tax revenue for 2013

Note: *Data available for 21 OECD member states
Source: Calculated by author from OECD (2017a: 145) and OECD online database
This article adds to the existing literature in a number of ways. First it extends a gender lens to considerations of fiscal welfare via an assessment of one of the largest categories of social supports delivered through the taxation system. Despite a growth of interest in gender proofing fiscal policies (gender budgeting) across numerous countries (OECD, 2016; Doorley et al., Reference Doorley, Bercholz, Callan, Keane and Walsh2018; Women’s Budget Group, 2019), a detailed empirical engagement with this issue has been absent from the taxation and pensions literature to date. In doing so, the article also provides further distributive insights into ‘the hidden world of fiscal welfare’ (Sinfield, Reference Sinfield2018: 105), one that is ‘a frequently ignored part of the welfare state’ (Ebbinghaus and Whiteside, Reference Ebbinghaus and Whiteside2012: 275) and remains ‘largely uncharted territory’ in the European research literature (Morel et al., Reference Morel, Touzet and Zemmour2016: 3). Finally, through an analysis of employee, employer and personal pension contributions, it also provides a new insight into the effectiveness of current approaches to private pension supports and highlights a discontinuity between the performance of current policy and the future needs it is attempting to address.
The remainder of the article is organised as follows. The next section outlines the nature of the Irish pensions system and the tax supports provided for private pension contributions. It also reviews the existing evidence on the distributive outcomes of these policies and considers the relatively new concept of a gender pension gap, arguing that assessments of pension contributions are relevant to understanding the emergence of that gap and the performance and effectiveness of current fiscal welfare supports. The article then details the data and methods used in the analysis before reporting on its results. Finally, the article concludes by exploring the broader policy implications of these findings.
Background
Ireland’s pension system
Despite changes over the last century, the underlying nature of Ireland’s pension system is rooted in that which was inherited upon independence from the United Kingdom in 1922 (Hughes and Maher, Reference Hughes, Maher, Murphy and Dukelow2016: 94). It is a Beveridgean type system with three pillars: a flat-rate social-insurance based pension financed on a pay-as-you-go basis (pillar one); a private occupational pension system (pillar two); and a voluntary private personal pension system where individuals contribute to their own pension fund (pillar three).
Tax supports are provided to encourage the participation of employers and individuals in pillars two and three and these supports for private pension saving are the focus of this article. Similar to most OECD countries, the tax treatment of pension savings takes an EET approach with contributions exempt (E) on the way into the fund, investment income and capital gains exempt (E) within the fund and pension payments taxed (T) upon drawdown (OECD, 2018a: 23). Collins and Hughes posit that the Irish system is better characterised as possessing an EEpT structure where pension funds are ‘partially taxed’ upon withdrawal. This reflects the ability of new retirees to receive a generous tax-free lump sum payment (up to €200,000) and the design of the income taxation system which treats the income of the elderly more favourably than that of those of working age (Reference Collins and Hughes2017: 496).Footnote 3
Data from occasional pension modules in the Labour Force Survey (CSO, 2019) reveal that most working-age individuals with a private pension belong to occupational schemes (63.7 per cent in 2018) while about 16 per cent hold a pillar three personal pension and the remainder (20.3 per cent) hold both. Legal requirements for most employers to provide at least a pillar three pension have seen participation grow, although individuals may choose to not make any contributions. Within occupational pensions there continues to be a shift towards defined contribution schemes (57 per cent of current employees) and away from defined benefit pensions. Overall, rates of private pension coverage are similar for males and females, although among employees women are more likely to be in an occupational pension.
Pension tax expenditure and its distribution
As highlighted in Table 1, the recurring annual cost of these tax expenditures is substantial at approximately €2.4 billion and it is equivalent to half the direct state expenditure associated with providing pillar one pensions. This ‘tax expenditure’ is measured as revenue forgone meaning that their provision explicitly decreases the resources immediately available to the state, through reductions in income and capital taxation, relative to that which would otherwise be liable for payment (OECD, 2017a: 144). Ceteris paribus their provision also creates pressure for higher taxes elsewhere within the existing tax base (Commission on Taxation, 2009: 240; Poterba, Reference Poterba2010: 140; Collins and Walsh, Reference Collins and Walsh2010: 1).
As tax expenditure is delivered in the form of taxes that are not collected, they have traditionally been less tangible and visible than the equivalent resources used for direct expenditure (Greve, Reference Greve1994; Howard, Reference Howard1997; OECD, 2010; Sinfield, Reference Sinfield and Greve2013). However, their substantial growth over the last two decades, combined with a crisis-induced increase in attention to both taxation revenues and state expenditure in most developed world states, has begun to bring greater focus and examination to this once hidden field. Many countries, including Ireland, now produce an annual tax expenditure report and tax expenditure has become subject to increased attention from parliamentary budget committees and Government agencies charged with monitoring spending. Consequently, across numerous states it is becoming more frequent for questions to be asked regarding the appropriateness, effectiveness, opportunity cost and sustainability of these policy measures (OTS, 2011; EC, 2014; NAO, 2014; Department of Finance, 2018; PBO, 2018; Redonda and Neubig, Reference Redonda and Neubig2018).
In the case of tax expenditure designed to achieve social policy objectives (fiscal welfare) closer examination often reveals a disconnect between their broader public policy context and the specifics of the tax relief measures provided. For example, while OECD states pursue an objective of ‘ensuring that pension systems provide adequate retirement incomes to all workers’ (OECD, 2015: 10) this is generally interpreted as posing policy challenges for ‘average’, ‘low-income’ and ‘precarious’ workers with limited consideration of concurrent and related policy objectives to, for example, reduce gender inequality. In the context of pension tax incentives, perhaps such policy incoherence is unsurprising given that tax codes are largely written by finance ministries who bring a narrower perspective to policy design and delivery (Deakin and Parry, Reference Deakin and Parry2000; Ebbinghaus and Whiteside, Reference Ebbinghaus and Whiteside2012: 275).
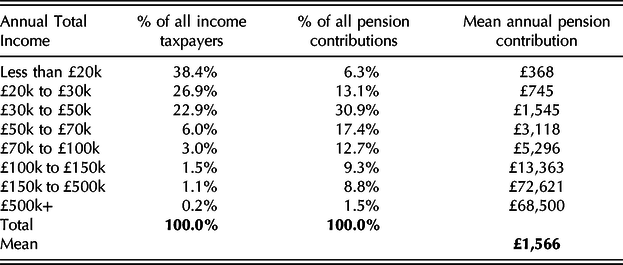
Pension tax expenditure has been one area of fiscal welfare subject to frequent consideration in many countries. In general, this has been reflective of the aforementioned high and recurring cost of these measures alongside repeated examinations of pension options and reforms in the context of ageing populations and policy preferences for further non-state solutions to providing adequate retirement income. A consistent finding has been the pronounced regressivity of pension tax incentives. Table 2 reports the distribution of pension contributions subject to income tax relief for the UK. In 2016/17 people with a total taxable income of more than £50,000 accounted for 11.7 per cent of income taxpayers and half of all contributions receiving tax relief. The top 1.2 per cent of income earners, with incomes in excess of £150,000 per annum, accounted for 10.2 per cent of pension contributions attracting tax relief. At the lower end of the income distribution, the 40 per cent of earners with incomes of less than £20,000 per annum made just 6 per cent of pension contributions entitled to tax relief. The mean contributions for these groups are also telling. The average total annual pension contribution subject to income tax relief in the UK in 2016/17 was £1,566; however, there are significant variations around this average. Earners above £150,000 made tax relieved contributions to their pension at more than forty times the average while those below £20,000 contributed at one-fifth of the UK average.
Distribution of UK Pension Contributions attracting tax relief, by Income Taxpayers for 2016/17
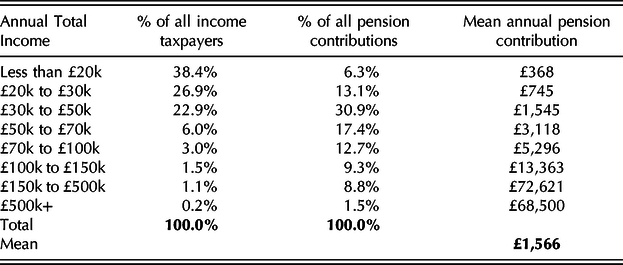
Notes: The UK income tax year covers the period from April 2016 to April 2017. Total income represents all income from earnings, savings and investments that is subject to income taxation.
Source: Calculated by author from HMRC Personal Income by Tax Year online statistics 2016/17 (tables 3.3 and 3.8).
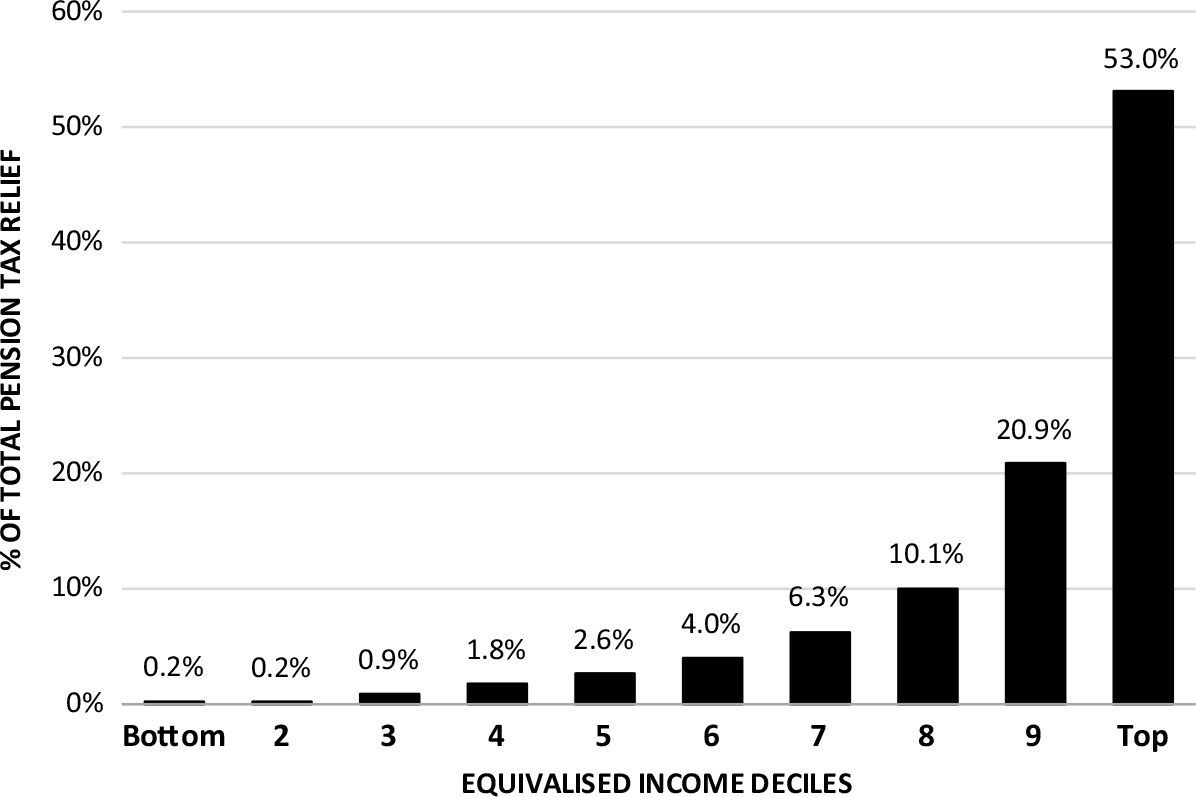
As these pension contributions are subject to income tax relief at the marginal rate, the distribution of the fiscal welfare itself will be even more skewed than the distributive picture painted in Table 2. Looking at Ireland, Collins and Hughes (Reference Collins and Hughes2017) modelled the distribution of the income tax relief for contributions to occupational and personal pensions in 2014. Their findings, outlined in Figure 1, provide a stark summary of the skewed distributive nature of this form of fiscal welfare. In total, almost three-quarters of the pension tax expenditure is concentrated in the top two deciles of the income distribution, with over half going to the top 10 per cent, while ‘virtually none of the subsidies benefit those in the bottom half of the income distribution’ (Reference Collins and Hughes2017: 503). Their findings echo previous studies for Ireland (Hughes and Nolan, Reference Hughes, Nolan, Salverda, Lucifora and Nolan2000; Callan et al., Reference Callan, Keane and Walsh2009) and the conclusions of similar assessments elsewhere including the UK (Sinfield, Reference Sinfield1997, Reference Sinfield2018; Agulnik and Le Grand, Reference Agulnik and Le Grand1998), the US (Burman et al., Reference Burman, Gale, Hall and Orszag2004) and Spain (Antón, Reference Antón2007). Sinfield (Reference Sinfield1997: 20) succinctly summarised the ‘upside-down’ nature of these policy outcomes over two decades ago noting that:
‘the benefit is greater, the higher the income and the higher the marginal tax rate which is avoided as a result of the tax mechanism. The greatest beneficiaries are those who have least needs by any measure used in social policy analysis.’
The gender pension gap
Research on the difference between male and female labour force participation and employment rates (‘the gender employment gap’) and gender differences in median gross hourly earnings (‘the gender pay gap’) are a well established focus of equality research and associated policy (Eurofound, 2016; OECD, 2017c). Conversely, research on differences in retirement income (‘the gender pensions gap’) is a relatively new sphere of gender equality research with a formal comparative statistical definition first proposed in 2013 (Flory, Reference Flory2012; EC, 2013; EIGE, 2015: 3; Jethwa, Reference Jethwa2019). It emerged as a natural extension of research on the gender pay gap and is built on a body of research assessing the impact on women of reforms to social-insurance provision and pensions policy (Ginn et al., Reference Ginn, Daly, Street, Ginn, Street and Arber2001; Ginn and Arber, Reference Ginn and Arber2002; James et al., Reference James, Cox Edwards and Wong2003; Ginn, Reference Ginn2004; Folbre et al., Reference Folbre, Shaw and Stark2005; Foster, Reference Foster2010, Reference Foster2012).
Distribution of Tax Relief on Pension Contributions, Ireland 2014

The gender pensions gap is defined as the difference between the average gross yearly total pension income of male and female pensioners (aged sixty-five plus) as a percentage of the average gross yearly total pension income of male pensioners (EC, 2013: 33). Latest data, for 2016, show that the gap is at 37.2 per cent across the EU-28 although it ranges from 1.8 per cent in Estonia to 48.7 per cent in Cyprus. In Ireland the gap equals 26.1 per cent significantly lower than the UK figure at 34.8 per cent (EC, 2018: 69).
While there is a growing literature on the causes of this gap, the principal ‘drivers’ include: lower rates of female labour force participation in paid employment; lower numbers of hours and years worked by females in paid employment; and lower rates of pay and lifetime earnings for females (Adami et al., Reference Adami, Gough and Theophilopoulou2013; EC, 2013: 8; Blau and Kahn, Reference Blau and Kahn2016; Winkler, Reference Winkler2016; EC, 2018: 73-77). Notably, each of these drivers carries greater significance in pension systems with a large private provision component. Although pensions policy has attempted to temper the impact of these differences in retirement, the latest European Commission Pension Adequacy Report notes the ‘limited extent’ of their success (EC, 2018: 73).
The remainder of this article examines another possible driver of the gender pension gap: differences in the level of private pension contributions between males and females and associated with this the differences in state support, delivered as fiscal welfare, to encourage private savings for retirement. To date, there has been limited consideration of this area, perhaps driven by deficits in data availability, a focus on pension gap outcomes rather than their accumulation, and a limited consideration of gender equality issues in the design and delivery of tax expenditure measures. The analysis attempts to address four related research questions: (i) is there a gender pensions contribution gap that impacts on an individual’s ability to accumulate savings for retirement?; (ii) if there is a gap, does it vary by socio-economic characteristic?; (iii) how are current tax supports distributed by gender?; and (iv) is the current approach to fiscal welfare helping or hindering policy objectives to address the gender pensions gap?
Data on pensions and tax status
Data from the 2014 Survey on Income and Living Conditions (SILC) is used as the basis for the empirical analysis in this article. The data comprise responses from a representative sample of the Republic of Ireland population covering 14,078 individuals in 5,486 households (CSO, 2015). The analysis draws on variables measuring pension contributions by employers to employees’ pensions and employee contributions to private pensions in workplace schemes or personal pensions. The data are representative of approximately 605,000 individuals for whom some form of active pension contribution is occurring. Income and earnings data (from employment and self-employment) for both individuals and households are also used. The income reference period is the twelve months prior to interview and the national statistics office, the Central Statistics Office, benchmarks the collected income data with administrative tax and welfare records in an attempt to confirm its accuracy. To ensure the SILC results are representative of the national population, the analysis in this article uses a probability weight variable to correct for under-representation and non-response in the sample.
Using variables measuring household composition, marital status and the income of couples, the data are used to simulate the tax status (individually assessed or jointly assessed) of each individual. The structure of the Irish income taxation system allows couples (married or cohabiting) to be jointly assessed as one tax unit and collectively share most of the income tax credits and bands that would otherwise apply to two single units. This determines the marginal tax rate faced by each individual and consequently the rate of income tax relief available on pension contributions. In 2014 there were two such rates, a standard rate of 20 per cent and a higher rate of 41 per cent.Footnote 4
In the context of assessing private pension contributions the data have some drawbacks. For employees, the SILC questionnaire collects data on ‘pension deductions from the last pay packet’ and multiplies this to generate an annual contribution. Therefore, results may misrepresent the contributions of employees with varying hours across the year such as seasonal workers. For workers with a second job the data do not disaggregate the employer contribution from that of the employee/individual; a feature which, although small, will understate the former and exaggerate the latter. The SILC survey, like most similar household samples, faced challenges in sampling very high-income households and such deficits are likely to impact on the ability of the data to capture pension contributions among those most likely to participate in a pension. Furthermore, the data do not provide details of the implicit pension contributions of the public sector as an employer, since public employees are covered by a public sector pay-as-you-go occupational pension. As such the data are not a complete picture of the occupational pension system, but despite some drawbacks they do provide a comprehensive picture of tax supported pension contributions to pillars two and three of the Irish pensions system. Robustness checks by Collins and Hughes found the model simulated 92 per cent of the total value of pension tax relief on employee, employer and private pension contributions compared to the official revenue forgone costs published by the national tax authority (Reference Collins and Hughes2017: 500).Footnote 5
Results
Tables 3 to 6 present the results of the analysis looking at gender differences in private pension coverage, participation, contributions and the distribution of tax supports.
Private Pension Coverage and Participation among Earners, by gender

Note: Earners includes all those with employment and or self-employment income.
Source: Author’s analysis of 2014 SILC data (CSO, 2015).
Pension coverage is a frequently used measure of the adequacy or comprehensiveness of the private pensions system. It captures the proportion of earners who possess any entitlement to income from an occupational (pillar two) or personal (pillar three) pension in retirement. While the SILC data collects this information, an indication of coverage does not reveal the extent of that entitlement and whether pension saving is ongoing or has ceased. A complementary measure, which is also possible to determine from the SILC data, is one of active participation in private pension saving. It measures the proportion of earners for whom any form of private pension savings is currently occurring whether this is an employer or employee contribution to occupational pensions, personal contributions to pillar three pensions or a combination of these approaches. This measure has the advantage of offering a better insight into current rates of private pension participation and assessing the overall effectiveness of the current suite of pension saving incentives.
Table 3 shows a gap of ten percentage points between coverage rates and active participation rates among all earners. Despite the scale of tax expenditure offered to induce pension savings, only one-third of earners are active participants in private pensions. Put simply, most workers in the year examined were making no provision for additional retirement income to supplement the state pension. The analysis finds no gender difference in pension coverage rates but does find that a greater proportion of male earners are active contributors to private pensions than is the case for female earners.Footnote 6
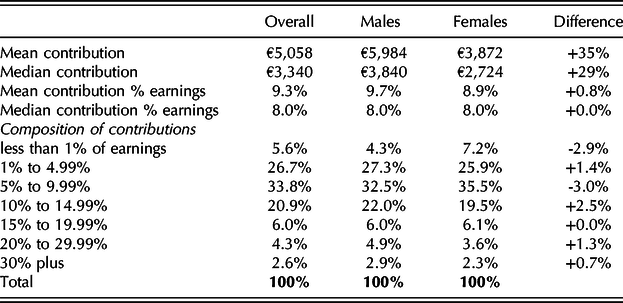
Among the minority of earners making pension contributions, it is the scale of pension contributions that is of relevance to the accumulation of a private pension income as well as the quantity of tax relief they enjoy. Table 4 calculates the mean and median value of contributions both in nominal terms and as a proportion of earnings, where the latter is defined as the total gross income received from employment and self-employment. The average pension contribution equals just over €5,000 with half of pension contributors saving less than €3,300. Broken down by gender the results identify a gender pension contribution gap with the pension savings of males exceeding that of female by between 30 per cent (median) and 35 per cent (mean).
Annual Private Pension Contributions as a proportion of Earnings, by gender

Notes: Earnings equal the combined value of employment and self-employment income. Rounding may affect the calculation of differences.
Source: Author’s analysis of 2014 SILC data (CSO, 2015).
Judged as a proportion of earnings there is little or no difference in gender contributions; median male and female rates are both at 8 per cent of earnings while mean rates differ by less than 1 per cent. This suggests that it is the underlying divides in gender income that is a key driver of gender differences in current nominal pension contributions. The table also includes details on the composition of contributions as a proportion of earnings. Reflecting the overall results, the structure does not differ much by gender and demonstrates that nearly one-third of contributions are small at less than 5 per cent of annual earnings. A further third contribute between 5 and 10 per cent while only 6-8 per cent of earners contribute more than one-fifth of earnings to pension savings. Males are more likely to be among those making the largest percentage contributions although these gender differences are small.
Overall, despite generous tax incentives, most earners do not contribute to pension savings and, among those that do, many contribute small amounts that over time are unlikely to accumulate to a pension pot sufficient to provide much income in retirement. Judged from a gender perspective, the presence of a notable nominal gap in contributions highlights that the cumulative effect of such differences will guarantee the existence of a gender gap in private pension income in the decades ahead.
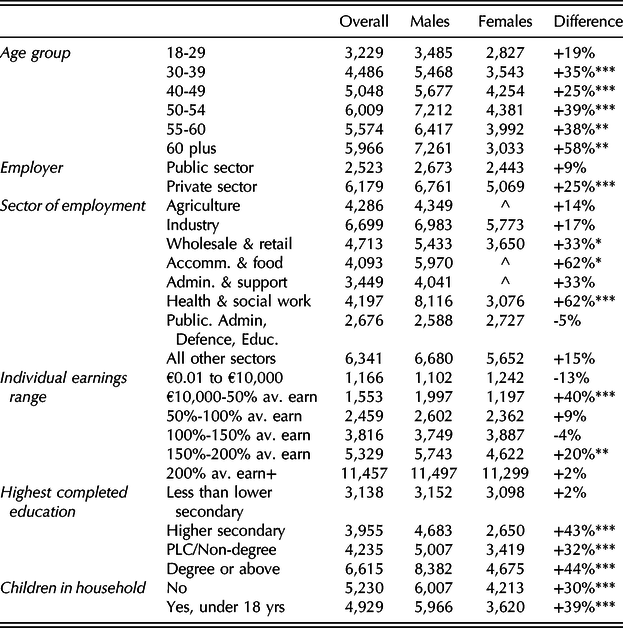
Nominal differences in pension contributions by gender are explored in more detail in Table 5 to determine if these differences are symmetric across earners or specific to certain sectors and cohorts of the population. When examined by age group the analysis finds no statistically significant difference in average contributions among younger earners (eighteen to twenty-nine years) but that a gap emerges in the thirties and grows to a difference of around 40 per cent among men and women in their fifties. Nearing retirement, the gender pensions contribution gap peaks with males in their sixties saving almost 60 per cent more than female pension contributors in the same age group.
Average Private Pension Contributions by socio-economic characteristics, € per annum

Notes: *** p<0.01, ** p<0.05, * p<0.1. ^ indicates the number of observations in this category is less than that allowed to be published by the data collector. Average earnings in 2014 were €36,090. PLC is post-secondary education (post Leaving Certificate) such as attending further education schools.
Source: Author’s analysis of 2014 SILC data (CSO, 2015).
The Value and Gender Distribution of Tax Relief on Pension Contributions

Source: Author’s analysis of 2014 SILC data (CSO, 2015).
Judged by economic sector the analysis finds that the pension contribution gap is not present among public sector workers, reflecting the different approach to pension provision in that sector and its greater degree of collective bargaining and pay equality compared to the private sector. Among private sector workers the average gender gap is 25 per cent. It is greatest in the sectors of the Irish labour market that have been identified as feminised and with high levels of low pay (Collins and Murphy, Reference Collins, Murphy, Murphy and Dukelow2016: 82-86). On average males contribute one-third more than females in the wholesale and retail sector, and almost two-thirds more in the accommodation and food, and health and social work sectors.
The association between gender differences and low pay is also reflected in the results examining contributions across the earnings distribution. The largest gap of 40 per cent is found for earners with an annual gross income of between €10,000 and €18,000; the latter threshold equals half the level of average earnings and is similar to the annual income earned by a full-time worker on the statutory minimum wage. While nominal contributions among these earners are small, at between €1,200 and €2,000 per annum, these gender differences may reflect the findings of other analyses which have shown that on average low paid women earn less per hour than low paid men (NERI, 2016: 37). Higher up the distribution a gap of 20 per cent is recorded among earners making pension contributions whose annual income is between 150-200 per cent of average earnings. Notably, there are no contribution differences among earners around average earnings and none among the highest earners whose individual earnings exceeds twice the national average. The latter group make the largest nominal pension contributions, more than €11,000 per annum, and the results suggests that pension contribution gaps, and their consequences, are not a feature of the labour market experiences of those with the highest individual incomes.
The results in Table 5 also show that pension contributions, like earnings, increase with the level of completed education and that a gender gap exists across all earners who have completed secondary education or above. The pension contribution data associated with the presence of children aged less than eighteen years in a household is also telling. On average nominal contributions are lower for individuals with children but this result is driven by lower female contributions as there is little change for males. Consequently, the gender contributions gap for women with children at home is 39 per cent compared to an overall average of 35 per cent and a lower figure of 30 per cent for women in households with no children.
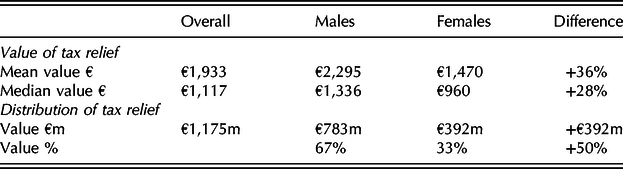
The identification of a gender contribution gap, alongside gender differences in earnings and income, implies that the results of the final aspect of the article’s analysis are unsurprising. As tax relief is delivered on the nominal value of pension contributions, and provided at the marginal rate of income taxation, it is more likely to favour males over females. Table 6 attempts to quantify this outcome and models the value and gender distribution of tax relief received by individual earners on the combined value of pension contributions made by employers to occupational schemes, employees to occupational schemes and individuals to other pillar three private pension products.Footnote 7 The tax relief modelled, at €1.175 billion, is that which can be directly associated with individual pension contributors. However, it does not capture the full suite of pension tax relief measures which also include relief for employers on pension contributions, relief on income associated with the current year capital gains of the pension fund, and income tax relief on tax free lump-sums taken by new retirees.
The gender distribution of pension tax relief is notably skewed towards males. On average male pension contributors receive 36 per cent more fiscal support than females. The difference between median male and female contributors is 28 per cent. The combined effect of the gender gap in active pension contributions (Table 3) and the gender gap in nominal pension contributions (Table 4) further skews the distribution of the tax relief. Overall, males receive two-third of the fiscal welfare provided to individuals on their pension contributions; twice that of females.
Conclusion
In many nations, large amounts of taxation resources are allocated to encourage and support private pension contributions. This fiscal welfare represents a significant area of recurring social policy provision. However, its delivery, as a reduction in the amount of income taxation that is due, has tended to make it less visible to scrutiny. Consequently, rigorous examinations of its effectiveness and consequences have been less frequent than is the case for similar scale initiatives delivered via direct expenditure. This includes an absence of examinations of the gendered impact of these fiscal measures, despite their relevance to policy objectives aimed at closing gender pensions gaps and addressing other measures of economic inequality between men and women.
While the Irish pension savings system and its associated fiscal welfare has been used as a case-study in this article, the findings carry broader relevance. Ireland’s EET system of pension tax relief is similar to that of most OECD states and the objectives of the private pension tax relief system echo those of numerous other countries, in particular those states that have prioritised non-state provision of pensions (OECD, 2018b: 21-47).
Using detailed income and savings data this article has considered the performance and distributional impacts of the current suite of income tax relief measures available to pension contributors. It found that a greater proportion of male earners are active contributors to private pensions, either directly through their own contributions or indirectly through the contributions of their employers. Thirty-five per cent of male earners made contributions during the year examined compared to 31 per cent of females. Therefore, almost two-thirds of earners are not currently making any form of private pension contribution with the outcome worse for females.
Among the minority of earners making pension contributions, the article identified a nominal gender contribution gap. Overall, males contribute between 30-35 per cent more than females to their private pension with that gap persisting across earners in most age groups and by education level. The data suggest an association between these outcomes and existing gender divides in earnings. Gender contribution differences are most pronounced in those sectors of the labour market associated with low pay and with higher proportions of female earners. Conversely, they are not present among the highest earners (more than twice average earnings).
The combined effect of gender differences in active pension saving and annual contributions drives the results of the article’s consideration of the distribution of pension tax supports. It finds that males receive two-thirds of the available fiscal welfare. Such an outcome is stark, in particular for a policy aimed at assisting all earners to accrue additional non-state retirement income. It should also be interpreted in the context of longer female life-expectancy, of the fewer opportunities that women have to build up supplementary retirement savings, and given recent reforms to state pension systems which have tightened the link between paid work and entitlements which have notable gender effects (EC, 2012: 12, 40; OECD, 2018c: 83). Furthermore, the resources involved are substantial on an annual basis and these then accumulate across working careers. In effect, the current system of tax incentives for pension savings amplifies existing labour market gender inequalities and extends them into retirement.
While it is inconceivable that an equivalent outcome on a direct expenditure programme would go unchallenged, the hidden nature of fiscal welfare transfers allows it to persist under the policy radar. Previous research has shown the regressive nature of pension tax reliefs and this article’s results strengthen that conclusion and demonstrate its accompanying gender inequality. It also highlights the importance of incorporating considerations of pension contributions and the gender distribution of pension tax supports into the evolution of future public policy on private pensions. To a great degree both of these perspectives are absent from current considerations of private pensions policy and the effectiveness of taxation supports. However, they are important drivers of future pension outcomes, the achievement of various pension adequacy targets and the successful closing of future gender pensions gaps.
The results also highlight the need for more comprehensive considerations of tax expenditure which would bring greater transparency to their operation and facilitate more informed assessments of their impact and effectiveness. While the relevance of such an approach is long established in the academic and policy world, movement from intention to application has been slow (Hughes and Sinfield, Reference Hughes, Sinfield, Hughes and Stewart2004; Poterba, Reference Poterba2010: 142; OECD, 2010: 43-51; Collins and Walsh, Reference Collins and Walsh2011: 17-19; PBO, 2018: 11-17). In particular, tax expenditure measures with social policy objectives, such as for pension saving or tax credits for disabilities such as blindness, tend to be overlooked as long-established ‘parts of the system’ and therefore are not subjected to the level of critical evaluation one would expect for other discretionary tax reliefs or direct expenditure measures. Whether this arises due to oversight, or because of the actions of the various beneficiaries of this fiscal welfare is a matter of contention. The latter points to the quiet exercise of ‘power’ in shaping public policy and the debates it does and does not pursue (Bachrach and Baratz, Reference Bachrach and Baratz1970: 105-106; Hacker, Reference Hacker2002; Lukes, Reference Lukes2005).
Finally, the analysis in this article highlights the importance for social policy of understanding the structures and dynamics of taxation systems. Fiscal welfare policies such as pension tax reliefs would be easy to look past, yet the quantity of resources involved, their regressive and inequitable distribution and their impact on current state resources and future living standards are central to much of the concerns of the discipline.
Acknowledgements
The author acknowledges the provision of SILC data from the CSO and UCD Data Archive and comments from participants at seminars/conferences hosted by the Trinity College Dublin Pensions Policy Research Group and the Social Policy Association (York). The usual disclaimer applies.