INTRODUCTION
Quantifying the relative importance of habitat association, dispersal limitation and historical processes is central to our understanding of variation in the diversity and composition of plant communities. Current debate about the origin and maintenance of variation in species composition among communities within a geographic region, or beta diversity (Whittaker Reference WHITTAKER1960), invokes three main hypotheses (Legendre et al. Reference LEGENDRE, BORCARD and PERES-NETO2005). The first of these assumes that species distribution is uniform over the region and that only the occurrence of rare species varies in space (Pitman et al. Reference PITMAN, TERBORGH, SILMAN, NUNEZ, NEILL, CERON, PALACIOS and AULESTIA2001). The second, known as the neutral theory of biodiversity, considers that species distribution results from stochastic demographic processes and that processes like limited dispersal ability create locally autocorrelated spatial patterns which maintain beta diversity (Hubbell Reference HUBBELL2001). The third, the niche differentiation hypothesis, is based on empirical evidence which supports the idea that environmental variation (often soil type and topography) is a major factor controlling species distribution.
Many studies have indeed shown the importance of habitat association in the distribution of tree species, in particular the important role of soil type (Clark et al. Reference CLARK, CLARK and READ1998, Reference CLARK, PALMER and CLARK1999; Gartlan et al. Reference GARTLAN, NEWBERY, THOMAS and WATERMAN1986, John et al. Reference JOHN, DALLING, HARMS, YAVITT, STALLARD, MIRABELLO, HUBBELL, VALENCIA, NAVARRETE, VALLEJO and FOSTER2007, Newbery et al. Reference NEWBERY, GARTLAN, MCKEY and WATERMAN1986, Pélissier et al. Reference PÉLISSIER, DRAY and SABATIER2002, Poulsen et al. Reference POULSEN, TUOMISTO and BALSLEV2006). For instance, Tuomisto et al. (Reference TUOMISTO, RUOKOLAINEN and YLI-HALLA2003) showed that the variation in beta diversity in western Amazonia was largely explained by environmental differences, and Phillips et al. (Reference PHILLIPS, VARGAS, MONTEAGUDO, CRUZ, ZANS, SANCHEZ, YLI-HALLA and ROSE2003) found that more than two-thirds of the most common tree species in Amazonia were significantly related to particular habitat. On another hand, several authors have reported significant species-habitat associations for only a limited number of specialized species, and thus argue that history and local dispersal may be the main processes underlying variation in the spatial distribution of tropical tree species (Harms et al. Reference HARMS, CONDIT, HUBBELL and FOSTER2001, Svenning et al. Reference SVENNING, KINNER, STALLARD, ENGELBRECHT and WRIGHT2004, Reference SVENNING, ENGELBRECHT, KINNER, KURSAR, STALLARD and WRIGHT2006). Furthermore, different factors appear to influence beta diversity at different scales in a given region (Condit et al. Reference CONDIT, PITMAN, LEIGH, CHAVE, TERBORGH, FOSTER, NUNEZ, AGUILAR, VALENCIA, VILLA, MULLER-LANDAU, LOSOS and HUBBELL2002). For instance, Parmentier et al. (Reference PARMENTIER, STEVART and HARDY2005) showed for the inselberg flora of Central Africa that at the local scale, variation in species composition is best explained by soil variation, whereas at the regional scale, species variation is better explained by historical processes and dispersal limitation.
Most studies of beta diversity have focused on either a local scale (<1 km2; John et al. Reference JOHN, DALLING, HARMS, YAVITT, STALLARD, MIRABELLO, HUBBELL, VALENCIA, NAVARRETE, VALLEJO and FOSTER2007, Potts et al. Reference POTTS, ASHTON, KAUFMAN and PLOTKIN2002, Poulsen et al. Reference POULSEN, TUOMISTO and BALSLEV2006) or mesoscale (1–100 km2; Clark & Clark Reference CLARK and CLARK2000, Clark et al. Reference CLARK, CLARK and READ1998, Couteron et al. Reference COUTERON, PELISSIER, MAPAGA, MOLINO and TEILLIER2003). Few have attempted to examine the influence of environmental factors on species assemblages in tropical forest on a regional scale (>100 km2). Most of them were carried out in the Amazonian basin or in Central America (Condit et al. Reference CONDIT, PITMAN, LEIGH, CHAVE, TERBORGH, FOSTER, NUNEZ, AGUILAR, VALENCIA, VILLA, MULLER-LANDAU, LOSOS and HUBBELL2002, Pitman et al. Reference PITMAN, TERBORGH, SILMAN, NUNEZ, NEILL, CERON, PALACIOS and AULESTIA2001, Tuomisto et al. Reference TUOMISTO, RUOKOLAINEN and YLI-HALLA2003). In Africa, studies conducted at this scale have been done using discontinuous data gathered from independent sampling plots (Hall & Swaine Reference HALL and SWAINE1976, Hawthorne Reference HAWTHORNE1995, Parmentier et al. Reference PARMENTIER, STEVART and HARDY2005, Poorter et al. Reference POORTER, BONGERS, KOUAME and HAWTHORNE2004, Swaine Reference SWAINE1996, Van Rompaey & Oldeman Reference VAN ROMPAEY, OLDEMAN, Guillaumet, Belin and Puig1996). To our knowledge, no study based on a systematic sampling of flora at the regional scale has yet been conducted in African tropical forests. The major obstacle remains the difficulty of obtaining the relevant datasets.
The Central African forests of the Congo Basin are the second largest continuous tropical forest in the world, after the Amazonian forest, and constitute an ideal study system for testing floristic–environment relationships (Gartlan et al. Reference GARTLAN, NEWBERY, THOMAS and WATERMAN1986, Newbery et al. Reference NEWBERY, GARTLAN, MCKEY and WATERMAN1986, Parmentier et al. Reference PARMENTIER, STEVART and HARDY2005). The forests of the Central African Republic (CAR) represent the northern limit of this forest. They have been either used for commercial logging and timber production or have some form of conservation status. Recently the CAR government issued a new forest law mandating the timber companies to implement forest management plans for all their concessions. In this context, large-scale forest inventories, based on systematic sampling, have been conducted by the timber companies with the technical support of the French-funded PARPAF project (Projet d'Appui à la Réalisation de Plans d'Aménagement Forestier) since 2000. This support guaranteed the homogeneity of the inventory protocols and the quality of the data collected.
In the present paper we used multivariate partitioning methods to quantify the contribution of soil types, rainfall and anthropogenic pressure to variation of tree community composition from a large continuous dataset gathered from several contiguous forest concessions covering 1 600 000 ha in south-western CAR. Our overall objective was to test the hypothesis that simple environmental determinants significantly explain overall variation in multi-species patterns. To do so we quantified beta diversity in terms of the regional floristic spatial structure.
METHODS
Study site
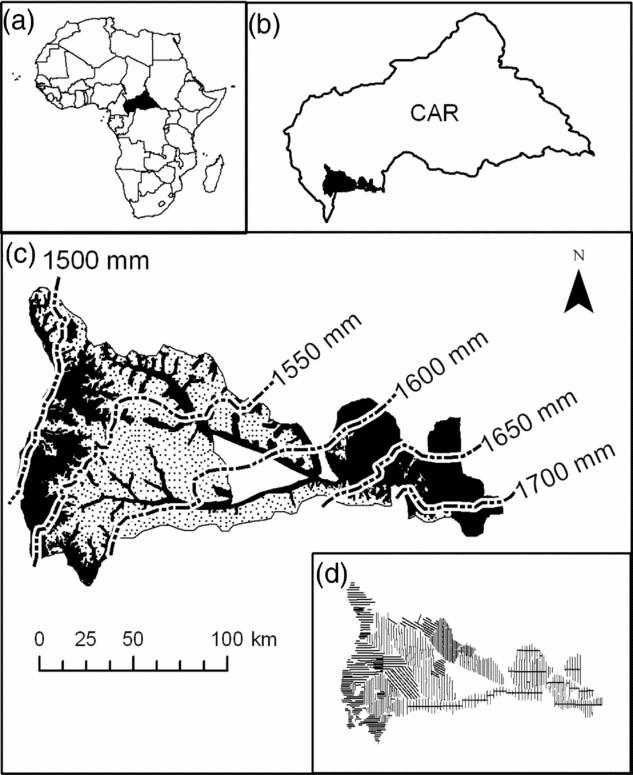
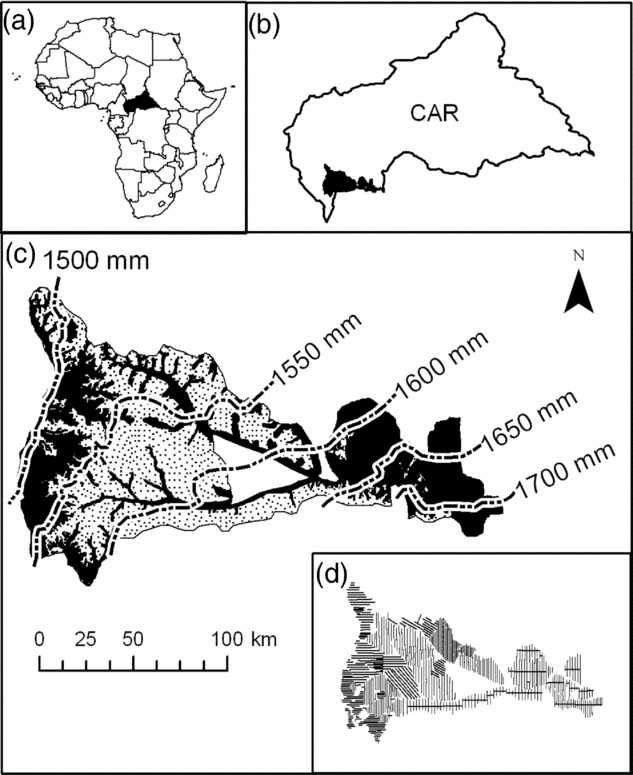
The study area covers a little over 1 600 000 ha in the south-western part of the CAR (Figure 1) (3°25′–4°66′N, 16°04′–18°33′E, 300–700 m asl) (Boulvert Reference BOULVERT1987). It covers approximately 30% of the total forest area of CAR. This region has a humid tropical climate, with annual rainfall ranging from 1400–1700 mm. Two distinct seasons alternate, a drier season from December to February and a wet season from March to November (Franquin et al. Reference FRANQUIN, DIZIAIN, COINTEPAS and BOULVERT1988). The forests of this area correspond floristically to a mixed moist semi-evergreen Guineo–Congolian rain forest according to White (Reference WHITE1983), but they are not quantitatively well described. The recent inventory of the Ngotto forest, conducted under the auspices of the European program ECOFAC (Conservation et utilisation rationnelle des ECOsystèmes Forestiers d'Afrique Centrale), identified 315 species of tree>10 cm in diameter, which places the forests of CAR at the level of the other forests in Central Africa (Yongo Reference YONGO2003). However, the forests of Central Africa do not contain as high a level of biodiversity when compared with the Amazonian forests (Parmentier et al. Reference PARMENTIER, MALHI, SENTERRE, WHITTAKER, ALONSO, BALINGA, BAKAYOKO, BONGERS, CHATELAIN, COMISKEY, CORTAY, KAMDEM, DOUCET, GAUTIER, HAWTHORNE, ISSEMBE, KOUAME, KOUKA, LEAL, LEJOLY, LEWIS, NUSBAUMER, PARREN, PEH, PHILLIPS, SHEIL, SONKE, SOSEF, SUNDERLAND, STROPP, TER STEEGE, SWAINE, TCHOUTO, VAN GEMERDEN, VAN VALKENBURG and WOLL2007).
The study area. Location of the Central African Republic (in black) within the African continent (a). Location of the study zone (in black) within the Central African Republic (b). Soil map of Boulvert (Reference BOULVERT1983), and rainfall gradient (dashed lines) across the study area as extrapolated from Hijmans et al. (Reference HIJMANS, CAMERON, PARRA, JONES and JARVIS2005) in which soil type S3 (sandy soil) is represented by dotted shading and all other soils are in black (c). The sampling design showing all transects along which a total of 30 182 0.5-ha plots were sampled (d).
Floristic and environmental data
The data we used come from the forest inventories conducted by four logging companies, SCAD (Société CentrAfricaine de Déroulage), SEFCA (Société d'Exploitation Forestière CentrAfricaine), SCAF (Société CentrAfricaine Forestière) and IFB/Ngotto (Industrie Forestière de Batalimo). Logging in this region has been highly selective since the 1950s (less than 2 trees ha−1) targeted on a small number of species. One of the main species logged is Entandrophragma cylindricum (Meliaceae), which currently represents 62% of the total production (Mille & Petrucci unpubl.data, Ruiz Pérez et al. Reference RUIZ PÉREZ, EZZINE DE BLAS, NASI, SAYER, SASSEN, ANGOUE, GAMI, NDOYE, NGONO, NGUINGUIRI, NZALA, TOIRAMBE and YALIBANDA2005), but which is still relatively common in the study area.
The forest inventories were conduced in 1993–1996 for IFB/Ngotto (with the support of ECOFAC program), 2002–2003 for SCAD, 2002–2005 for SEFCA and 2005–2006 for SCAF (the three last concessions have benefitted from the support of the PARPAF project). They were based on a systematic sampling design composed of 30 182 rectangular 0.5-ha plots (200 m × 25 m) that were adjacent along parallel transects separated by 2–3 km, except for some part of the IFB/Ngotto concession where the plots were non-adjacent while transects were closer (Figure 1d). Location of the plots was recorded with a Global Positioning System (GPS). The area sampled (15 091 ha) represents 0.94% of the total study area.
In each sampling plot, all the trees with a diameter at breast height (dbh) ≥ 30 cm were recorded. The number of plant species reliably identified varied amongst the concessions from 73 to 201, the remaining being grouped in an undetermined category. In order to test the reliability of species identification, the PARPAF project conducted regular controls that involved field surveys by experienced botanists in plots already inventoried by the timber companies. Results of these controls identified species for which there was confusion in botanical identification, so that the prospectors have been accordingly trained to minimize such errors. In the same way, data capture was controlled for 10% of the whole data set, with the rule that above 1% of error, the data had to be captured again.
We focused our analysis on the 73 species reliably identified in all four concessions. However, in order to confirm whether the results obtained with 73 species were representative of a larger-tree community, we compared them, where possible, with similar analyses conducted on the SCAF and Ngotto/IFB datasets only, for which 198 and 201 species were identified, respectively. For the analysis, we also defined 11 dbh classes of 10 cm width, from 30 to 130 cm, all trees above 130 cm dbh being grouped together in the largest class.
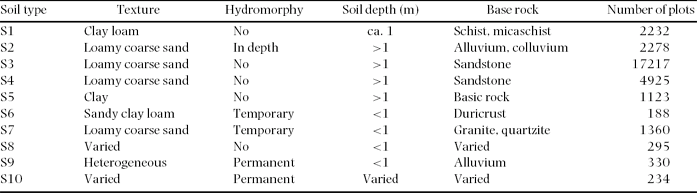
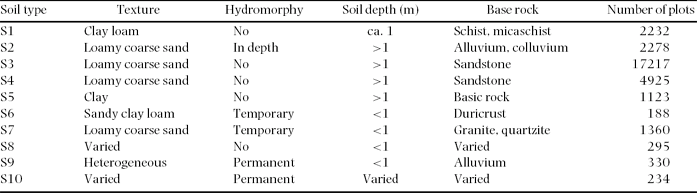
We used soil type, rainfall and proximity to villages as explanatory variables of large-scale floristic variation within the study area. Based on the 1:1 000 000 scale soil maps of Boulvert (Reference BOULVERT1983), ten major soil types have been defined in the study area (Table 1; Figure 1c).
Soil types according to Boulvert (Reference BOULVERT1983). Soil texture (according to the Soil Science Society of America, https://www.soils.org/sssagloss/index.php), hydromorphy (i.e. level of water table and type of waterlogging), soil depth and type of basement rock for each. The number of sample plots in each soil type is also given. Despite their similar properties and origins, the S4 soil type is limited to major valleys and is shallower, less homogeneous and more fertile than the S3 soil type (Boulvert Reference BOULVERT1983).
In the region, rainfall data are only available at a very large geographic scale inappropriate to our study (Franquin et al. Reference FRANQUIN, DIZIAIN, COINTEPAS and BOULVERT1988). We thus used the WORLDCLIM database (Hijmans et al. Reference HIJMANS, CAMERON, PARRA, JONES and JARVIS2005), which provides interpolated values of sparse data of climatic observations realized between 1950 and 2000. This model shows a gradient of increasing rainfall from the north-west to south-east across our study area (Figure 1c), which is in agreement with Franquin et al. (Reference FRANQUIN, DIZIAIN, COINTEPAS and BOULVERT1988). The corresponding map was thus incorporated into the GIS, from which we computed a rainfall value for each plot.
As no precise data on the logging history of the study area are available, we used the proximity to villages to test the potential effect of an anthropogenic disturbance on the floristic composition. In Central Africa, population density is generally low, and this is especially the case in our study region where densities are around 1 km−2 (Ruiz Pérez et al. Reference RUIZ PÉREZ, EZZINE DE BLAS, NASI, SAYER, SASSEN, ANGOUE, GAMI, NDOYE, NGONO, NGUINGUIRI, NZALA, TOIRAMBE and YALIBANDA2005). Since settlement of villages along the roads is recent in the study region, we expect the rural pressure on forest composition to be low. However, to verify this supposition we delineated, using a GIS, a buffer zone of 3 km around each village in which we considered the plots as more prone to human disturbances.
Statistical analyses
We analysed the inter-plot floristic variation using Correspondence Analysis (CA) and Non-Symmetric Correspondence Analysis (NSCA; Kroonenberg & Lombardo Reference KROONENBERG and LOMBARDO1999) of the abundance matrix of 73 reliably identified species in the 30 182 0.5-ha plots. NSCA is known to emphasise frequent species (for which we are more trustful in terms of determination) whereas CA is highly sensitive to particular correspondences between poor plots and scarce species (Couteron et al. Reference COUTERON, PELISSIER, MAPAGA, MOLINO and TEILLIER2003).
The effects of environmental variables on floristic variation were investigated with a NSCA on Instrumental Variables (NSCAIV; Couteron et al. Reference COUTERON, PELISSIER, MAPAGA, MOLINO and TEILLIER2003), which is a form of canonical analysis (sensu Legendre & Legendre Reference LEGENDRE and LEGENDRE1998) derived from NSCA and close to Redundancy Analysis (RDA). In a contrasting and complementary fashion to the NSCA, the objective of NSCAIV is to assess the degree to which floristic variation depends on the environmental variables (direct gradient analysis). We preferred NSCAIV to CA on Instrumental Variables – an equivalent to CCA (ter Braak Reference TER BRAAK1987) – because we are interested here in large-scale multi-species spatial patterns displayed by the variation in abundance of the dominant species rather than in particular species-habitat specializations. The proportion of the floristic variation due to the environmental variation was assessed by dividing the sum of all canonical eigenvalues obtained from NSCAIV by the sum of eigenvalues obtained from NSCA of the initial table (Prodon & Lebreton Reference PRODON and LEBRETON1994). We similarly performed a residual-NSCAIV (i.e. a NSCA of the residual table obtained once the effects of the explanatory variables have been removed) to analyse the floristic patterns that were not explained by the environmental variables.
In order to interpret the multi-species spatial patterns revealed by the multivariate analyses, we represented factorial scores of the plots as raster images covering the entire study area. In these images, each square represented an area of 1706 ha, which encompassed 31.4 plots on average (SD = 14.2) and bore the mean value of the plot scores it contained. Finally, squares with similar mean values were merged according to Jenk's maximization procedure of the among-group variance (Slocum et al. Reference SLOCUM, MCMASTER, KESSLER and HOWARD1999).
In order to investigate how the spatial structure of the floristic data is related to spatial variation in environmental variables, we conducted a Canonical Trend Surface Analysis (sensu Wartenberg Reference WARTENBERG1985, see also Legendre Reference LEGENDRE1993) by using the terms of a third-order polynomial function of x and y geographical coordinates of the plot centres (i.e. x, y, xy, x2, y2, x2y, xy2, x3 and y3) as explanatory variables in a NSCAIV.
All statistical analyses were performed with the R statistical software (http://cran.r-project.org/) using the ade4 (Thioulouse et al. Reference THIOULOUSE, CHESSEL, DOLÉDEC and OLIVIER1997) and diversity (Pélissier & Couteron Reference PÉLISSIER and COUTERON2007; http://pelissier.free.fr/Diversity.html) libraries. Arcgis 9.1 (http://www.esri.com/) was used as GIS software.
RESULTS
Overview
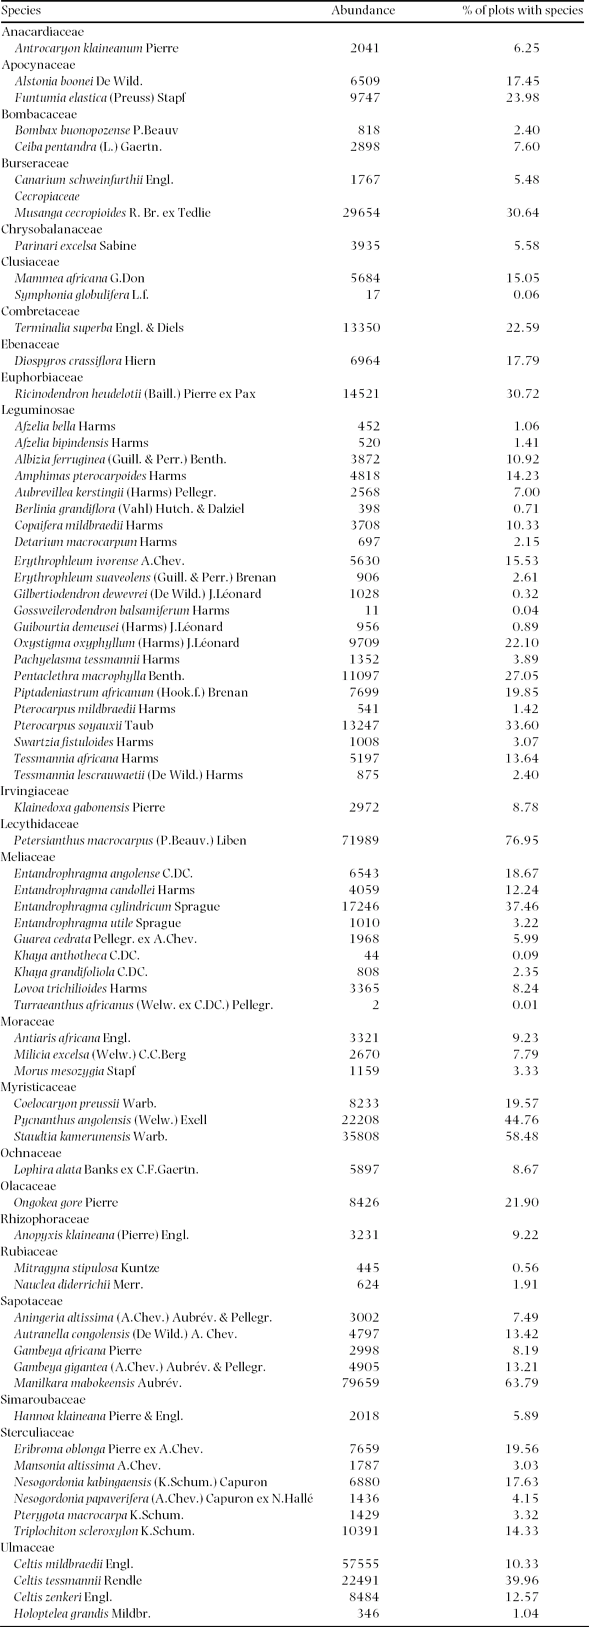
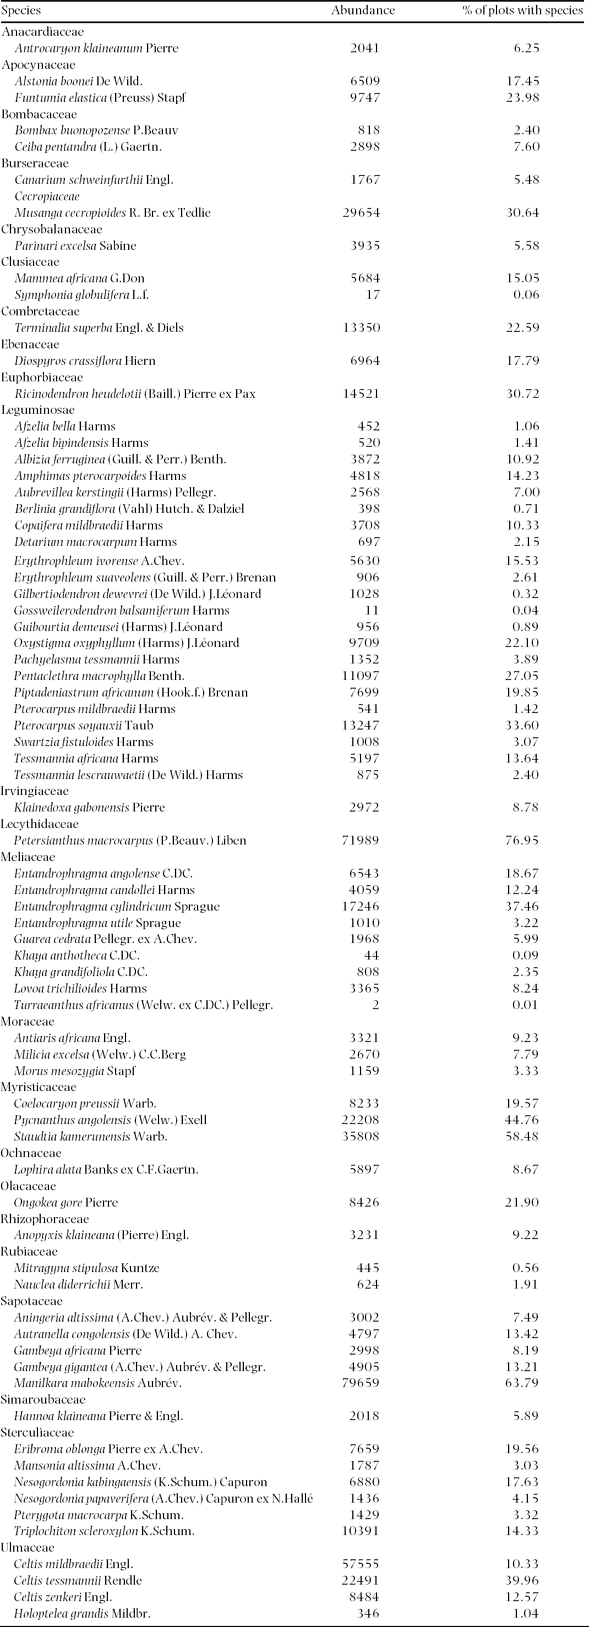
The 73 species represent 61 genera and 25 families (a complete list is given in the Appendix), with a total of 592 059 individuals in the study area (54.1% of the trees with a dbh ≥ 30 cm), and a mean of 19.6 (SD = 7.8) trees per plot. The four most common species are Manilkara mabokeensis (Sapotaceae; 79 659 indiv.), Petersianthus macrocarpus (Lecythidaceae; 71 989 indiv.), Celtis mildbraedii (Ulmaceae; 57 555 indiv.) and Staudtia kamerunensis (Myristicaceae; 35 808 indiv.). These four species represent 41.4% of all individuals of the 73 studied species. The two most important families in terms of number of species are the Leguminosae (22 species) and Meliaceae (9 species).
Main floristic patterns
Correspondence analysis of the species abundance matrix exhibited a first axis (9.2% of the total inertia) mostly determined by Gilbertiodendron dewevrei (1028 indiv.), well known to form monodominant patches in evergreen forests of Central Africa (Hart et al. Reference HART, HART and MURPHY1989), but which is, in our study area, limited to small patches close to the rivers. The subsequent axes were also determined by uncommon specialized species, such as Mitragyna stipulosa (445 indiv.), Berlinia grandiflora (398 indiv.) and Guibourtia demeusei (956 indiv.), strongly associated with swamps or river edges.
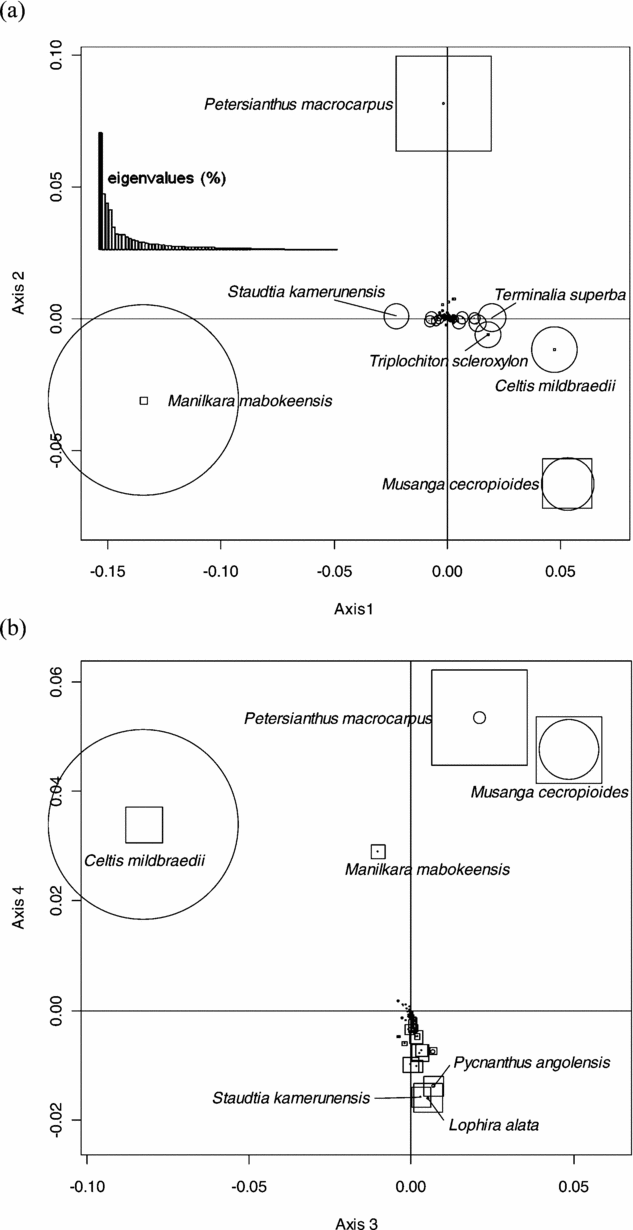
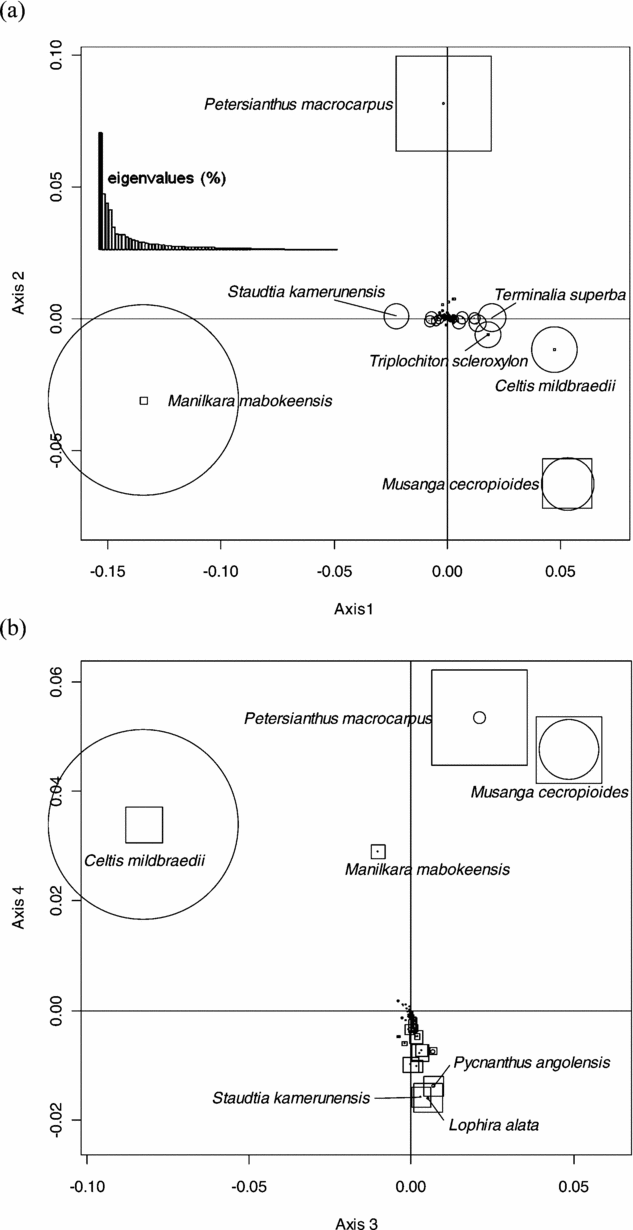
This analysis did not reveal any geographical pattern of floristic variation at the regional scale of the study area. We thus submitted the abundance matrix to a NSCA. Eigenvalues showed an irregular decreasing pattern with a prominent first axis (23.6% of the total inertia), and the first four axes accounting for 52.2% of the total inertia. Axis 1 was mainly determined by Manilkara mabokeensis and Staudtia kamerunensis with negative values, and by Musanga cecropioides, Celtis mildbraedii, Terminalia superba and Triplochiton scleroxylon with positive values (Figure 2a). Axis 2 was mainly determined by Petersianthus macrocarpus (positive values) and Musanga cecropioides (negative values). The third axis (Figure 2b) exhibited species already well represented on axes 1 and 2, namely C. mildbraedii (negative values) and M. cecropioides and P. macrocarpus (positive values), while axis 4 opposed P. macrocarpus, M. cecropioides, C. mildbraedii and M. mabokeensis (positive values) to a group of species dominated by Lophira alata, Pycnanthus angolensis and S. kamerunensis (negative values).
Factorial plans 1–2 (a) and 3–4 (b) of the Non-Symmetric Correspondence Analysis performed on the abundance matrix of 73 reliably identified tree species in 30 182 0.5-ha sampling plots in a mixed moist evergreen rain forest in south-western Central African Republic. The size of the circles and the squares are proportional to the relative contribution of species on the horizontal and vertical axes, respectively.
Although our analysis is based on a sample of 73 species, comparison with data for a much larger number of species but on a smaller spatial scale showed that our analysis provides a representative analysis of tree community variation. Plot scores along the first two axes of the NSCA conducted on the 73 reliably identified species showed a highly significant correlation (Pearson's r > 0.94) with the corresponding axes of two NSCAs independently conducted on the total SCAF and IFB/Ngotto datasets using 198 and 201 reliably identified species.
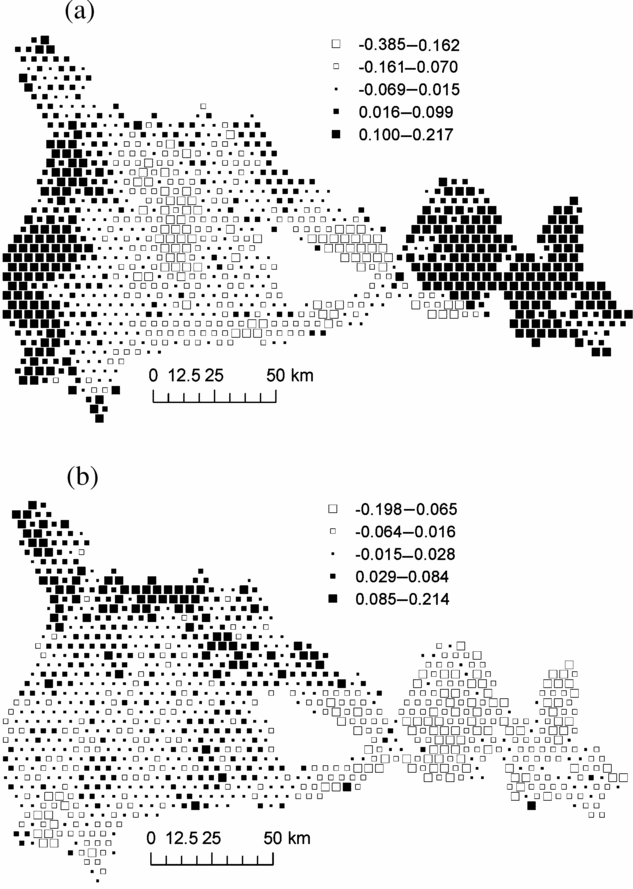
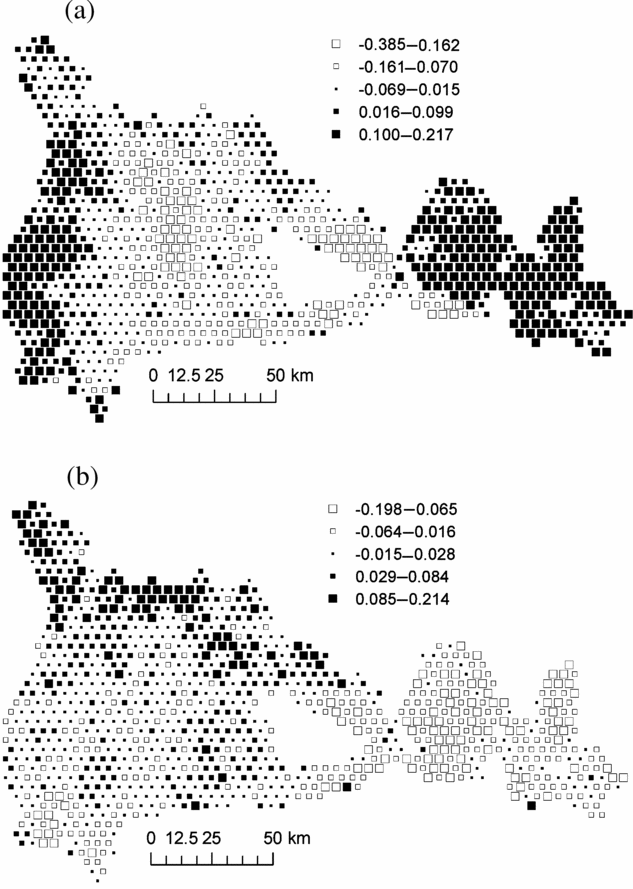
Mapping plot coordinates on the first NSCA axis showed a major forest partition between the central part of the study area, where M. mabokeensis is abundant and the eastern and western sectors (Figure 3a). The second NSCA axis showed a clear floristic gradient from the north-west corner, rich in P. macrocarpus, to the easternmost part of the study area (Figure 3b). Axis 3 showed no clear geographical pattern, while axis 4 exhibited only small isolated patches (not shown).
Map of plot scores on axis 1 (a) and axis 2 (b) of the Non- Symmetric Correspondence Analysis of Figure 2. Black squares represent positive values and white squares, negative values. Each square represent an area of 1706 ha and group of similar mean values were obtained by Jenk's maximization procedure.
Effects of explanatory environmental variables
Together, the three environmental variables (soil type, rainfall gradient and presence of villages) explained 10.3% of the total inertia of the abundance matrix. The eigenvalues of the NSCAIV with respect to these variables showed a prominent first axis accounting for 80.5% and a less important second axis accounting for 15.6% of this explained inertia. Forty-nine species out of 73 had a relative contribution that exceeds 80% on the first two axes, demonstrating that theses axes accounted for very general patterns of variation in species abundances.
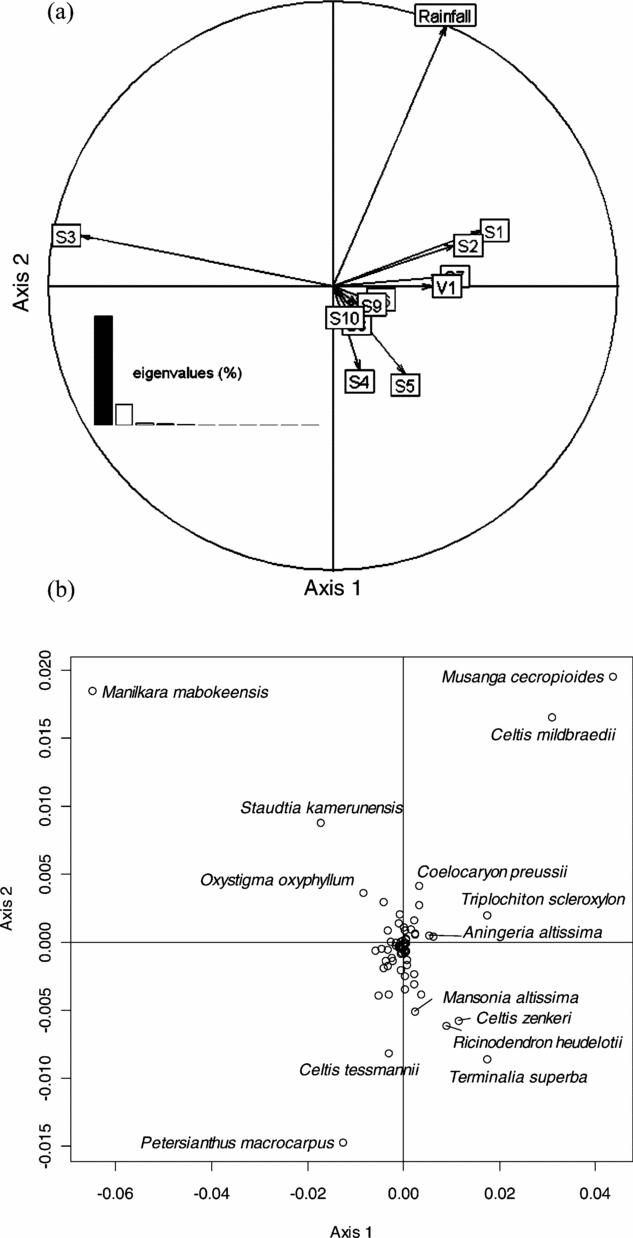
The first axis of this analysis was mainly determined by the soil variable: S3 appeared on the negative side of this axis, to the opposite of the other soil types (Figure 4a). The presence of villages (V1) was also opposed to S3. Rainfall gradient showed a strong correlation with the NSCAIV axis 2. The soil types S4 and S5 were found on the negative part of this axis. However, since these soils only occur in the eastern part of the study area, the analysis did not distinguish the effect of soil type from the effect of rainfall. Likewise, the analysis did not separate the effect of S3 from the absence of villages, since few villages occur in areas of soil type S3. We did however observe that the soil type alone had greater explanatory power (8.9%) than rainfall gradient (2.6%) or the presence of villages (1.0%). Figure 4b shows that all the species that significantly contributed to the first factorial NSCA plan also contributed to the first NSCAIV plan: M. mabokeensis, which largely contributed to NSCA axis 1 also significantly contributed to NSCAIV axes 1 and 2. This means that the abundance of this species was well explained by both S3 and high rainfall. Petersianthus macrocarpus, which significantly contributed to NSCA axis 2, was negatively correlated with the rainfall gradient in NSCAIV, while the abundance of M. cecropioides and C. midbraedi correlated with high rainfall.
Factorial plan 1–2 of the Non-Symmetric Correspondence Analysis on Instrumental Variables performed on the abundance matrix of 73 reliably identified tree species in 30 182 0.5-ha sampling plots in a mixed moist evergreen rain forest in south-western Central African Republic, with respect to environmental explanatory variables. Correlation circle of explanatory variables: soil types (S1 to S10), rainfall and the presence (V1) of villages within a distance less than 3 km (a). Species scores on the factorial plan 1–2 (b).
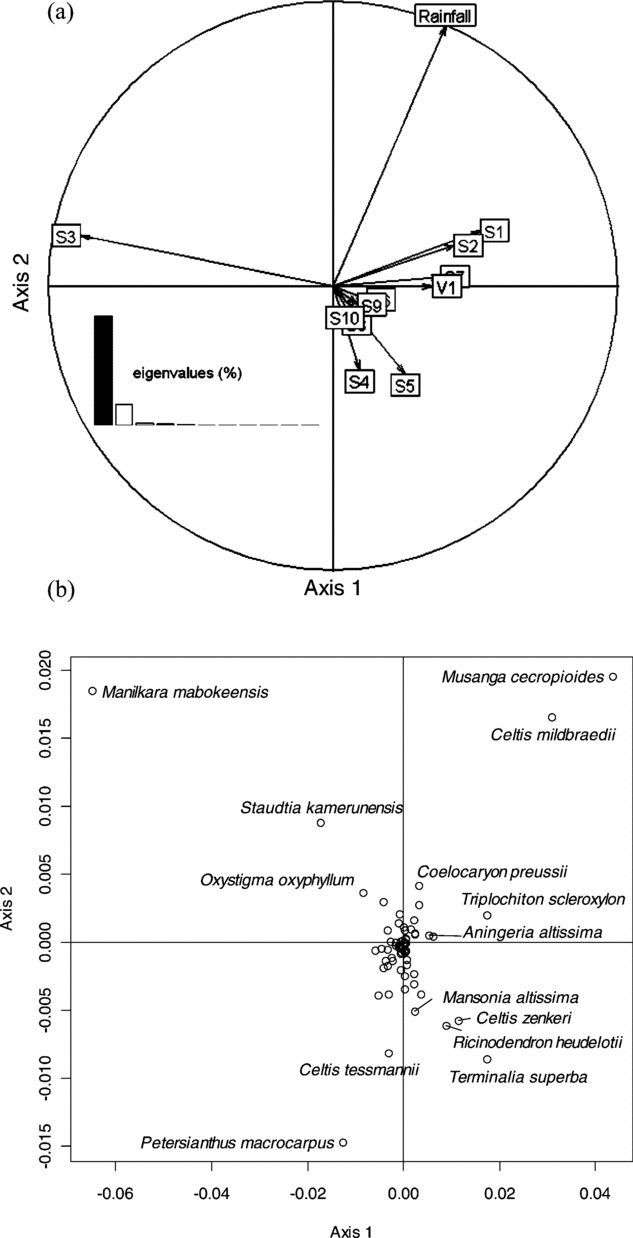
With regard to the relative contribution of species on the two first axes of the NSCAIV, we can note that Ongokea gore and Entandrophragma candollei had more than 95% of their relative contribution on the negative part of the first axis while Aningeria altissima and Triplochiton scleroxylon had more than 94% of their relative contribution on the positive part of the first axis. In the same way, Holoptea grandis had 82% of its relative contribution on the negative part of the second axis and Erythrophleum ivorense had more than 60% of its relative contribution on the positive part of the second axis.
Residual spatial patterns
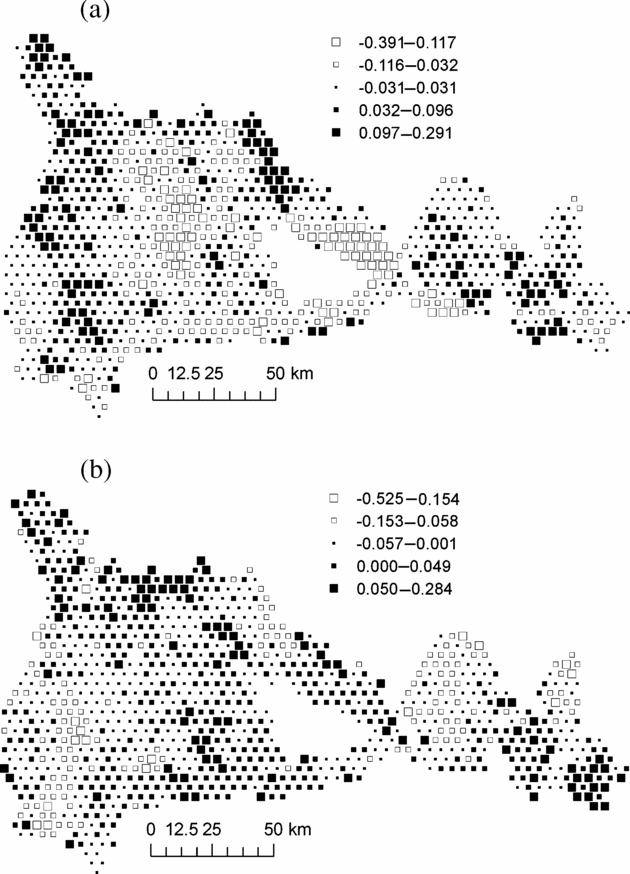
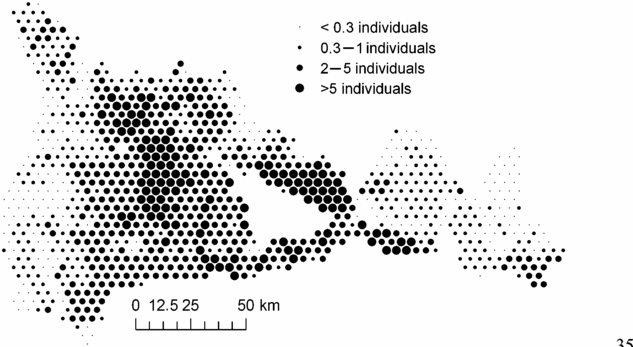
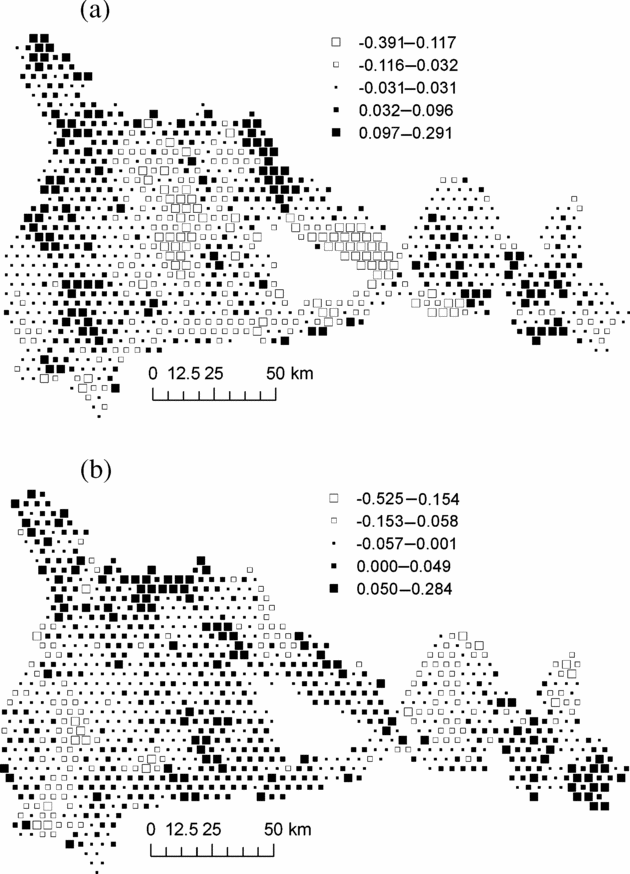
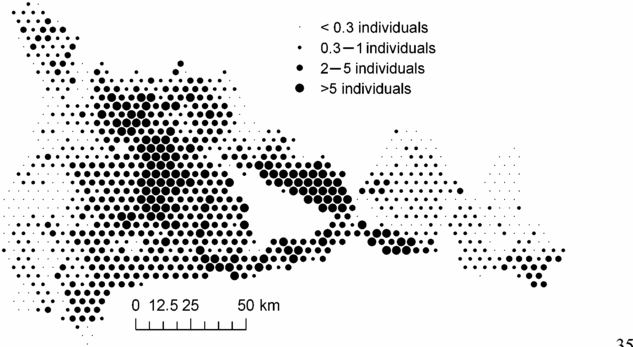
In order to examine whether the environmental variables explained the principal geographical patterns emphasized by NSCA, we analysed the unexplained part of the floristic table in a residual NSCAIV. Surprisingly, while most of the spatial variation in abundance of the determinant species was explained by a combination of the soil and rainfall variables, the residual NSCAIV axis 1 retained a small proportion of the original geographic pattern and thus had some similarities with the NSCA axis 1 (Figure 5a). In contrast, the residual axis 2 totally lost its north-west–south-east gradient structure (Figure 5b). Indeed, we detected marked variation in the abundance of M. mabokeensis within the area of S3, which was thus not due to soil type. In particular, patches of highly negative residuals on the NSCAIV axis 1 (Figure 5a) correspond to areas of very high abundance in M. mabokeensis (>5 individuals per plot in Figure 6) with tall emergent mature trees and a relatively open canopy cover (MRM pers.obs.). However, no clear regional spatial pattern was detected by a CA performed on the frequency distribution of trees in dbh classes (results not shown).
Map of plot scores on axis 1 (a) and axis 2 (b) of the residual Non-Symmetric Correspondence Analysis on Instrumental Variables of Figure 4, i.e. once the effects of the explanatory variables have been removed. Black squares represent positive values and white squares, negative values. Each square represent an area of 1706 ha and group of similar mean values were obtained by Jenk's maximization procedure.
Spatial distribution in the abundance of Manilkara mabokeensis across the study area. Each circle corresponds to an area of 1706 ha and the size of circles represents the mean abundance of M. mabokeensis per plot in these areas.
Finally, the third-order polynomial function introduced in NSCAIV explained 14.5% of the total initial variance of the floristic table. For the same analysis conducted on the residual environmental table, i.e. once the effects of soil type, rainfall gradient and proximity to villages have been removed, the polynomial function explained only 3.5% of the total initial variance (4.5% when only the effect of soil type was eliminated). This demonstrates that the environmental variables, particularly soil type, have a significant effect on the multi-species spatial patterns in this forest.
DISCUSSION
Forest inventories constitute a valuable source of information for enhancing our capacity to understand the causes of floristic variation and species–environment relationships. However, the large-scale inventories implemented by timber companies have rarely been used in ecological studies because of concerns about the ecological applicability and pertinence of such data. Identification of tree species is a key issue here, especially in tropical areas where species diversity is high and botanical knowledge limited (Lam & Kleinn Reference LAM and KLEINN2008). In such regions, forest inventories are usually conducted by employees of the timber companies and local helpers who have, in general, a good knowledge of the economically interesting species.
In the case of the CAR, the PARPAF project and the ECOFAC programme have ensured an interactive control of the botanical identifications, which guarantees reliability and consistency of the 73 species used in our ecological analysis.
Multi-species regional patterns and their determinants
This paper documents regional variation in forest tree community composition in Central African tropical forests, and validates the hypothesis of a strong environmental determinism of these large-scale multi-species spatial patterns. Multivariate analyses highlighted that both soil type and the north-west–south-east rainfall gradient were closely associated with these patterns. The most prominent pattern, highlighted by the NSCAIV, contrasts the central part of the study area, which corresponds to the sandy soil type S3, with the western and eastern parts of the forest. These soils are characterized by a high abundance in Manilkara mabokeensis, the ecology of which is still ill-defined, and in several late-successional species like Staudtia kamerunensis, Ongokea gore, Entandrophragma candollei and Oxystigma oxyphyllum (Wilks & Issembé Reference WILKS and ISSEMBÉ2000). The western and eastern parts of the study area are mainly characterized by communities of pioneer and non-pioneer light-demanding species, such as Musanga cecropioides, Triplochiton scleroxylon, Aningeria altissima and Terminalia superba (Hawthorne Reference HAWTHORNE1995, Letouzey Reference LETOUZEY1985, Wilks & Issembé Reference WILKS and ISSEMBÉ2000). Celtis mildbraedii, which is also abundant in these parts of the forest, is poorly documented in the literature. The spatial distributions of T. scleroxylon and A. altissima show that these species strictly avoid the sandy soils.
The same kind of floristic differentiation between sandy and clay soils has been previously observed in the same region (Boulvert Reference BOULVERT1986, Descoings Reference DESCOINGS1975) and in the Amazon Basin (Tuomisto et al. Reference TUOMISTO, RUOKOLAINEN and YLI-HALLA2003). Both Descoings (Reference DESCOINGS1975) and Boulvert (Reference BOULVERT1986) interpreted the forest stands on sandy soils as primary communities, in contrast to the secondary forests on clay soils. In their view, the difference between these communities is primarily due to historical anthropogenic effects, which have probably been less intense on the unfertile sandy soils than on the clay soils. In our view historical perturbations may significantly explain the observed multi-species patterns, although it is clear from our results that the sandy soils strongly limit or support the presence of a number of species. Many zones on sandy soils, even close to the clay soils, have indeed experienced logging operations since the 1970s (Mille & Petrucci unpubl.data). However, some species confined to clay soils, such as T. scleroxylon and A. altissima do not regenerate in these areas (MRM pers. obs.) and seem thus excluded by properties of the sandy soils. In contrast, some species such as M. mabokeensis, show distribution limits that correlate very well with the limits of the sandy soils. This latter species also appears on the S2 soil type (Figure 6, at the south-east), which is also a constrained soil because of its low drainage. This observation leads us to suggest that M. mabokeensis is more competitive on poor soils than on richer ones.
Our results do not support the claim by Pitman et al. (Reference PITMAN, TERBORGH, SILMAN, NUNEZ, NEILL, CERON, PALACIOS and AULESTIA2001) that the more competitive species dominate communities over a large spatial scale, with variation in space primarily due to less competitive rare species. Indeed, in our study zone, the more dominant species vary markedly in abundance in relation to soil types. Four species, M. mabokeensis, C. mildbraedii, P. macrocarpus, and S. kamerunensis are very dominant species in the study area. The distributions of these species across the study region are, however, far from being uniform; M. mabokeensis and S. kamerunensis are more associated with the sandy soils and their distribution patterns are very different from those of C. mildbraedii as revealed by both NSCA and NSCAIV.
Our analyses also exhibited clear differences between the eastern and the western parts of the study area. Some species, like Mansonia altissima, are abundant in the east and absent in the west. Furthermore, the eastern area has a higher abundance of Terminalia superba, Celtis zenkeri and Ricinodendron heudelotii. These differences could be explained by the biogeographical limits of the species or differences in vegetation history, or because the central part of the sandy soils may act as a barrier to dispersal between these zones. Although rainfall variation had little explanatory power on the floristic variation at the regional scale, a few species seem to be significantly sensitive to the rainfall gradient, e.g. Holoptea grandis which is described as a pioneer species in dry forests and Erythrophleum ivorense which is described as a species typical of old-growth wet forests (Hawthorne Reference HAWTHORNE1995). Hence, variation in rainfall may influence the distribution of drought-sensitive species (Swaine Reference SWAINE1996).
Potential causes of unexplained spatial variation
Low percentages of inertia explained by the environmental variables (10.3% in our case) are common in tropical forest studies (Clark et al. Reference CLARK, PALMER and CLARK1999, Couteron et al. Reference COUTERON, PELISSIER, MAPAGA, MOLINO and TEILLIER2003, Pélissier et al. Reference PÉLISSIER, COUTERON, DRAY and SABATIER2003). However, apparently low values do not mean that the environment has no determinant effect on the community composition. The crucial point here is the comparison between the initial floristic structures, observed in the geographical or factorial space, and the structures that remain (or not) in the residuals, i.e. when the effect of the environmental variables has been removed. If the initial structure is no longer present in the residuals, this means that the environmental variables had a significant effect in shaping the multispecies floristic pattern. In our study, the Trend Surface Analysis showed that 14.5% of the spatial variation in the floristic data was captured by a third-order polynomial function. However, 11% of this variation was also explained by the environmental variables. Hence, most of the broad-scale multi-species spatial structure modelled was closely related to environmental variation, and once the effect of environment is removed, the residual pattern is notably less structured at the regional scale. A large part of the residual spatial variation is due to variation in the abundance of M. mabokeensis on sandy soils (S3). The patches of highest abundance of this species match with particular areas, where the canopy is rather open and where Marantaceae are more abundant (MRM pers.obs.). We suspect that the composition of such areas results from past anthropogenic disturbances (Brugière et al. Reference BRUGIÈRE, BOUGRAS and GAUTHIER-HION2003).
Other factors, in particular historical factors, not taken into account in our study may also have influenced spatial variation in floristic composition. Maley (Reference MALEY2001) has shown that a catastrophic destruction of the Central African forests probably occurred about 2500 y ago. This means that these forests are relatively young and their spatial organization could be more random than expected for an old-growth mature forest. This catastrophic event probably caused extensive development of savannas and an extension of pioneer tree species. Forest re-growth probably began about 2000 BP or later in some areas, hence the event may still mark the composition of the studied communities. In the same way, Brncic et al. (Reference BRNCIC, WILLIS, HARRIS and WASHINGTON2007) showed that dry intervals occurred in the northern Congo–Brazzaville at approximately 0–100, 700–800, 900–1200, 2000–2800 and 3000–3300 BP. Again, these events may have significantly affected forest composition. We identified small areas (6800–47 000 ha) with a particular floristic composition, characterized by species such as Lophira alata, Pycnanthus angolensis, Canarium schweinfurthii, Hannoa klaineana and Lovoa trichilioides (MRM pers.obs.). These areas may thus correspond either to areas that have experienced important disturbances in the past or that are currently in a transition phase toward savannas because of climate change. According to Boulvert (Reference BOULVERT1986) and Mille & Petrucci (unpubl.data) the central northern part of our study area could have experienced repeated fire events in the past and be now in a forest colonization phase. These small areas also correspond to patches with a dbh distribution dominated by small-sized trees, which often characterize colonization dynamics.
In our study, the presence of villages had no significant effect on variation in tree community composition. As expected, the very low human population density and the relative youth of the villages settled along the roads, could explain this result. On the other hand, forest logging, which is poorly documented, has probably had an important impact on the forest, especially for trees >30 cm dbh.
The low level of variance explained by the environmental variables could also result from the low resolution of the soil data extracted from a 1/1 000 000 map. At the regional scale it is evident that there is more local variation in the soils than we were able to account for from the soil map. The lack of precise soil data along with the huge number of observations (plots) may increase the floristic variation within what may appear to be homogeneous units in our analysis.
In conclusion, we showed that an important part of multi-species spatial structure at the regional scale could be explained by environmental variation. However, further investigations are needed to disentangle the effects of processes related to species habitat preferences (the niche effects) from biotic effects unrelated to habitat preferences (the neutral effects) such as dispersal limitation.
ACKNOWLEDGEMENTS
We thank the botanists Fidèle Baya and Evariste Ganza for their help during long walks in the forest, Olivier Flores for his help for statistical analyses and Vincent Freycon for assistance with soil characterization. Special thanks are due to Michel Gally, Didier Hubert, Emilien Dubiez and Christian Fargeot who provided an essential logistic support in the field. We thank two anonymous reviewers, whose suggestions improved the manuscript. We are grateful to the PARPAF project and the leading consortium CIRAD (Centre de coopération Internationale en Recherche Agronomique pour le Développement) and FRM (Forêt Ressources Management). Finally we thank the Ministère des Eaux et Forêts, Chasse, Pêches, Environnement et Tourisme of CAR and the forest companies that provided the inventory data.
The 73 studied tree species and their abundance and spatial frequency (the % of plots that contains the species) in the 30 182 plots of 0.5 ha of mixed moist evergreen rain forest in south-western Central African Republic.