Introduction
Growth and feed consumption are economically important traits in pig production. Together, the relative economic weights on each of these production traits in the breeding objective are 20% in the total merit index of Norwegian Landrace and 21% in the total merit index of Norwegian Duroc. Currently selection for increased growth is based on two fixed weighing points, measured as days from 25 to 100 kg. The shape of the growth curves can thus not be taken into consideration. Since the 1960s, total growth and feed consumption have been recorded for boars at test stations in Norway (Jensen, Reference Jensen2008). Since 2004, weight and feed consumption have been registered on a daily basis during the test, making a more detailed genetic description of growth curves possible. However, this detailed information is not currently utilized.
When more detailed information on growth during the test period becomes available, estimates of boar’s growth curves, heritabilities and genetic relationship between the weights at different ages are feasible. This gives the possibility to increase accuracy of selection for genetically more efficient pigs. Recording on a daily basis will provide more accurate estimates of the expected weight at a given age compared to a single record taken on the actual day. Daily records of weight may also provide data, which can improve the selection of boars at an earlier stage or be used to pre-select/reject some boars early in the test. Both alternatives may result in increased test capacity and thus also higher selection intensity of boars.
In the literature, there are few reports on the genetic parameters of growth curves for pigs. Based on pigs weighed three times during the growth period, Huisman et al. (Reference Huisman, Veerkamp and Van Arendonk2002) found that variance of live weight is increasing during lifetime of a pig, and random regression models were found to fit the data better than the multivariate model. Köhn et al. (Reference Köhn, Sharifi and Simianer2007) found the growth curve for Goettingen minipig from 0 to 160 days of age to be approximately linear compared to the sigmoid growth curve of normal fattening pigs.
The aim of the current study was to test and fit genetic models to daily weight data for Landrace and Duroc pigs and compare alternative genetic models for their accuracy in predictions of weight curves. Accurate estimation of genetic curves improves selection accuracy, facilitates selection for alternative curves and provides opportunities to shorten the test period. These alternative selection opportunities are also investigated here.
Material and methods
Data
In Norway pig breeding currently includes two breeds, Landrace and Duroc. The breeding program is organized by Norsvin.
Landrace has been selected in the direction of a dam line since 1998, and maternal traits and litter size have been included in the breeding goal. The Duroc population in Norway was established in 1987. Duroc has been selected as a sire line since 1993 (Jensen, Reference Jensen2008). When selecting for this sire line the most important traits are production, meat quality and carcass quality.
The Landrace breed originates from the old White Landrace with contributions from Danish and Swedish imports (Vangen and Sehested, Reference Vangen and Sehested1997).
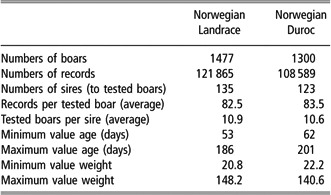
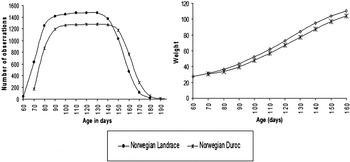
Around 2400 boars coming from the Norsvin nucleus herds are tested for growth efficiency traits annually. The boars tested are almost equally distributed between the two breeds. At test stations, boars are placed in pens with boars of the same breed, and given free access to feed. Both weight and feed consumption are automatically recorded using the feed intake recording equipment (FIRE; Osborne Industries Inc., Osborne, KS, USA) recording machines. The test-day weights used in the statistical analyses are the median weight of all records on the actual boar on a specific test-day. The boars are kept in test from about 25 to 100 kg. The data material was obtained from the data bank of Norsvin, and is based on boars born from May 2004 to August 2006. Boars that had been ill, or for other reasons could not complete the test, were not used in the analyses. After deleting single observations that were most likely erroneous (based on preceding and following observations), the statistical analyses were based on 121 865 weight records of 1 477 Landrace boars and 108 589 weight records from 1300 Duroc boars. The pedigrees ranging from 8 to 10 generations back in time were obtained from the breeding database of Norsvin. Descriptive statistics of the datasets used are shown in Table 1 and Figures 1 and 2.
Description of the data material used in genetic analysis

Number of observations by age (days) to the left and average weights by age (days) to the right for Landrace and Duroc.

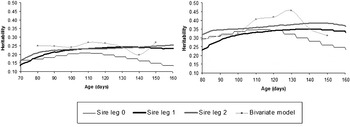
Estimated heritability by age (days) for weight for the bivariate and the test-day animal models for Landrace to the left and Duroc to the right. The heritability for Leg(0) is not constant over days because residual variance for weeks of age are added and these are not constant.

Statistical analyses
The variance components were first estimated using an animal model, but this resulted in unreasonably high estimates of heritability.
Legendre polynomials up to the second order were fitted to the daily weight data curves. Legendre polynomials of higher degree were tried, but did not converge in our data.
The three models used to analyze the data were, for order of fit Q = 0, 1 or 2:
Leg(Q)
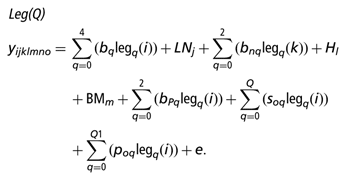
The fixed effects are
bqlegq(i) is the Legendre polynomial of fourth order, i the age in days, ranging from 52 to 186 in Landrace and 62 to 201 in Duroc. LNj the parity number (if larger than three it was set to three) in j classes, j ranging from 1 to 3. bnqlegq(k) the Legendre polynomial of second order, k the number of piglets born in litter, ranging from 2 to 21 in Landrace and 1 to17 in Duroc. H1 the herd–year (at birth) l classes, 98 in Landrace and 29 in Duroc. BMm the month m at birth, 12 classes. dzqlegq(t) the Legendre polynomial for age up to second order, models the effect of pen z at age t, where t is age in days for the pig. P the pen number at the test station and station number. P having 130 classes in Norwegian Landrace and 115 in Norwegian Duroc. This pen effect takes up many degrees of freedom, but we wanted to ensure that this effect did not enter the genetic effects, since some of the pen mates may be related to each other.
The random effects are
soqlegq(i) is the Legendre polynomial for age up to second order, models the effect of sire s at age i, where a is the sire if a sire model was used. so is the effect of sire o, [so 1…soq]∼MVN(0,G), where G is the matrix of variances and covariances to be estimated. poqlegq(i) the permanent environmental effect, Legendre polynomial for age up to second order for offspring o at age i, poq is the permanent environmental effect of offspring o, [po 1,…,poq]∼MVN(0,P), where P is the matrix of (co)variances between the permanent environmental effects, and is to be estimated. e the residual  , with different σe 2 for different weeks of age. The residual variances were assumed heterogeneous across age classes (weeks). Due to few observations in each tail of the dataset, these classes were grouped together, making 18 groups of age for both Landrace and Duroc.
All statistical analyses were performed using the ASREML package (Gilmour et al., Reference Gilmour, Gogel, Cullis and Thompson2006).
Heritability and genetic correlations
Heritabilities were calculated using the three random regression sire models (Leg(0), Leg(1) and Leg(2)) based on genetic and environmental (co)variance components. In addition heritabilities and genetic correlations were also calculated based on analyses from bivariate sire models. In the bivariate analyses weight at day a was correlated to weight at day b.
The bivariate model for days a and b was
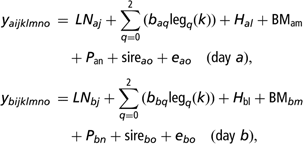
where Pan and Pbn are the fixed effect of Pen.
The bivariate analysis was used to investigate whether this simpler model gives similar correlation estimates for genetic and permanent environmental effects. The days chosen for bivariate analysis were 80, 90, 100, 110, 120, 130 and 140.
Model comparison
The random regression models were compared by the Bayesian information criterion (BIC) (Schwarz, Reference Schwarz1978), defined as:

where L(i) is the likelihood of model i, L(0) is the likelihood of model Leg(0) (the model which the others were compared to), (vi−v 0) is number of additional (co)variance components estimated in model i compared with model 0, N is number of observations, and p is the rank of the fixed effects incidence matrix.
The models were also compared by their ability to predict accurate estimated breeding values (EBV) at a certain age. Animals were randomly divided in two sets each containing 50% of the animals, and two sets of EBVs for weight by age were estimated based on the two datasets. For each sire, the EBV from one of the datasets was based on approximately half his original number of offspring and on his other relatives. The correlation between EBVs for the two sets was then computed for sires with more than 10 sons in the original data. Models that yield high correlation between the EBVs for the two datasets are expected to also have high predictive ability with respect to true breeding values since the prediction errors (errors due to phenotypic sampling) are expected to be uncorrelated.
Comparison of test length
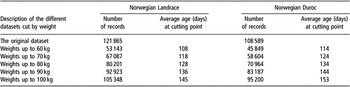
In the current testing procedure the test is terminated at a given weight (approx. 100 kg). To compare effects of shortened test length on the accuracy of EBV for the different models, alternative datasets were produced by deleting data occurring after a given weight. In total, five reduced datasets were created, corresponding to cutting points at 60, 70, 80, 90 and 100 kg, respectively. Average ages at different weights are shown in Table 2. EBVs were calculated for all datasets. Boars are tested until they reach 100 kg and EBVs for the reduced datasets were correlated to the EBVs for the dataset cut at 100 kg (average age at 100 kg is 145 days for Landrace and 153 days for Duroc). Number of records in the different datasets is shown in Table 2. The sire model (co)variance components were estimated with the complete dataset as input parameters.
Description of the reduced datasets restricted by weight limits

Results
Heritability and genetic correlation
Heritability found for weight at different ages for the different models is shown in Figure 2. Heritabilities were generally higher for Duroc than for Landrace.
Correlation matrices
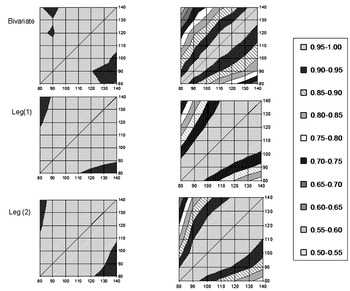
The genetic and permanent environment correlations by age are shown in Figure 3. Leg(0) is a repeatability model, i.e. both genetic and permanent environmental correlations between all days are assumed to be unity, and is therefore excluded from the figure. The two random regression models (Leg(1) and Leg(2)) gave generally very similar correlation structures for both breeds. The genetic correlations obtained with the random regression models were good approximators of the correlation structures obtained with the bivariate models. For permanent environmental effects, the correlation structure was rather similar for the two breeds using all models. However, the random regression models seemed to give somewhat higher estimates of permanent environmental correlations between the most distant ages compared with the bivariate models.
Genetic correlation matrices to the left and permanent environmental correlation matrices to the right. The estimated values for Landrace are shown above the diagonal and for Duroc below the diagonal. Leg(1) and Leg(2) based on animal models with parameters from sire models.

Model comparison
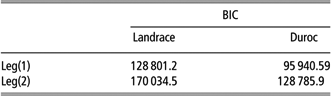
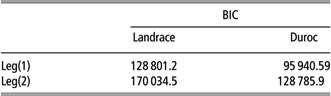
Leg(1) and Leg(2) were compared to Leg(0) using the BIC criterion (Table 3). Based on this criterion, fit of the model, corrected for degrees of freedom, increased with increasing complexity of the model for both breeds.
The BIC for the different models (all models are compared to Leg(0))
Models were also compared by correlation between EBV for weight at different ages calculated on two datasets, each containing half the animals. For Landrace the average correlations were 0.237 for Leg(1) and 0.238 for Leg(2). These models did not differ much, but were clearly better than the Leg(0) where correlation was 0.165. For Duroc the average correlation between EBV was 0.319 for Leg(0), 0.332 for Leg(1) and 0.392 for Leg(2). As observed here, the overall correlations are low irrespective of models because the sires have few offspring after dividing the dataset into two.
Based on both BIC and predictive ability, the Leg(2) model was chosen for further analyses for both Landrace and Duroc.
Comparison of test length
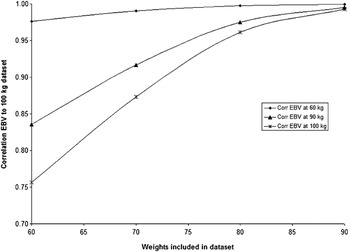
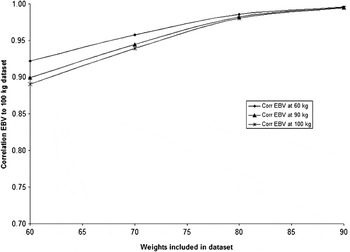
Correlations between predicted breeding values based on the reduced datasets are shown in Figures 4 and 5. Based on the model EBV at a certain age, EBVt was predicted. t is defined as average age in days at 60, 90 and 100 kg. The values for t are 108, 136 and 145 for Landrace and 114, 144 and 153 for Duroc. As expected, the correlations between EBVt for the cut datasets and EBVt for the 100 kg dataset increased with increasing upper limits for weight kept in the reduced datasets. When EBVt (t = 145 for Landrace and 153 for Duroc) for the 60 kg dataset are correlated to EBVt (t = 145 for Landrace and 153 for Duroc) for the 100 kg dataset, the correlation between the EBVs was 0.76 for Landrace and 0.89 for Duroc. When EBVt (t = 145 for Landrace and 153 for Duroc) for the 90 kg dataset are correlated to EBVt (t = 145 for Landrace and 153 for Duroc) for the 100 kg dataset, the correlation between the EBVs was approximately 0.98 for both breeds.
Correlation between Landrace EBVs for weight at 108 days (average weight 60 kg), 136 days (average weight 90 kg) and 145 days (average weight 100 kg), based on datasets truncated at 60 to 90 kg with corresponding EBVs based on a dataset truncated at 100 kg.

Correlation between Duroc EBVs for weight at 114 days (average weight 60 kg), 144 days (average weight 90 kg) and 153 days (average weight 100 kg), based on datasets truncated at 60 to 90 kg with corresponding EBVs based on a dataset truncated at 100 kg.

Discussion
Genetic growth curves were estimated using daily weight recordings and different orders of fit of Legendre polynomial models. The estimated heritability of weight varied with age, and the different models provided quite different estimates of heritability. Model comparison based on BIC, and predictive ability both preferred the most complex model (Leg(2)), and this model was thus chosen for both breeds. This model also had the highest heritabilities. Models with higher order polynomials compared with Leg(2) were tested, but these did not converge on our data.
Currently, in Norway, the breeding goal is days from 25 to 100 kg, and heritability for this trait is estimated to be 0.27 for both breeds (Andersen-Ranberg, unpublished). Based on the Leg(2) model the estimated heritabilities for weight at the age where 100 kg average is reached (145 and 153 days for Landrace and Duroc, respectively) were 0.25 and 0.39 for Landrace and Duroc, respectively. Hence, although there were some differences between these traits, heritabilities and thus opportunity of selection are similar.
The correlations between EBVs for the two datasets were generally higher for Duroc compared with Landrace, which can be explained by the higher heritabilities in Duroc (Figure 2).
When heritability is high relatively more weight will be put on the offspring of the sire relative to information on other relatives. Hence, including or excluding offspring from the dataset will have a larger impact on the calculated EBV when heritability is high.
Thus, if heritability were overestimated, correlations between EBV from the split dataset would have been reduced. This is not the case when comparing Landrace to Duroc, indicating that the difference in heritability is real.
When using an animal model for the estimation of variance components, estimated heritabilities were substantially higher than for those in Figure 2, and the predictive abilities of the models were substantially lower than for the sire model (results not shown). We concluded that there probably were environmental covariances between records across animals that were not accounted for in our animal model. These covariances affected animal model genetic variance estimates, due to the detailed modeling of genetic relationship in animal models. In sire models only genetic relationships amongst half sibs are modeled, and thus are less likely to pick up spurious environmental covariances between records. If some environmental covariances are not included in the statistical analysis, this might influence heritability estimates. For example, litter, maternal and dominance effects may have caused such covariances. Litter effects were not included in the model because there were too few litter mates amongst the test boars to predict the parameters of their growth curves accurately. Because of the possibility that such spurious covariances exist, we advise to test whether sire and animal model estimates of heritability agree, when using random regression models for variance component estimation. The size and structure of our dataset seemed to be sufficient to estimate the parameters of the sire and permanent environmental growth curves accurately, because the BIC values of Leg(2) and Leg(1) were very large relative to Leg(0).
In an earlier study, Odegård et al. (Reference Odegård, Jensen, Klemetsdal, Madsen and Heringstad2003) found that heritability was generally higher for random regression models compared with a repeatability model. This was also confirmed in this study, as heritabilities were increasing with increasing complexity of models. The model Leg(2) had the highest estimated heritabilities, and the values were generally higher for Duroc than for Landrace. The bivariate model gave highest estimates of heritability in the middle of the data range; however, this may have been due to random noise as the heritability curve of the bivariate analyses seems somewhat erratic. The higher estimated heritability for Duroc compared with Landrace might be the result of a different selection history, as Duroc has been selected for growth traits in a shorter period than Landrace. This might also have been due to genetic differences in growth between the two breeds.
Because age at 100 kg is part of the breeding goal, boars stay in test until they reach 100 kg. Correlation between EBVs for the datasets cut at lower weights indicates that testing might be terminated earlier than 100 kg, but with some loss of accuracy of selection, e.g. termination of the test at 90 and 80 kg gives, e.g. <2% and <5% reduction in accuracy of selection for both breeds.
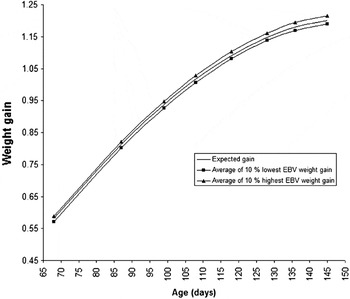
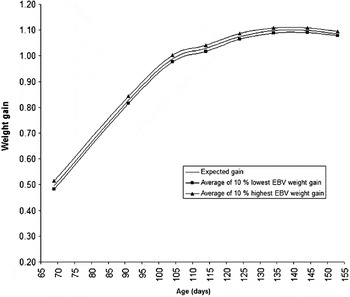
The estimation of genetic growth curves also gives opportunity for the selection for altered curves. Figures 6 and 7 show average genetic curves for the 10% fastest and 10% slowest growing pigs during the test period (between 30 and 100 kg). For Landrace the curves are approximately parallel, indicating that the selection will lift the curve everywhere to an approximately equal amount. For Duroc the fastest growing pigs are especially fast growing during the early stages of the test, indicating that selection for fast growth will give the highest response during the early stages of the test. Selection for different growth curves is possible and the presented models could be used to select for ‘the ideal’ growth curve. The estimates of the genetic parameters would indicate how easy it is to breed for the ‘ideal’ growth curve. The shape of the ideal curve can be assessed by economic modeling, which assesses the economic consequences of growth at different stages of the curve. For example, slow growth at the beginning combined with fast growth at the end may reduce the cost of maintenance feed. Alternatively, initial fast growth may reduce the time needed to reach slaughter weight. In sow lines an economically efficient growth curve should combine fast growth during the fattening period with relatively low adult weight, since the latter increases the cost of housing and feeding the sows. This however requires further research, in that the relationship between the growth curves and adult weights need to be studied. Togashi and Lin (Reference Togashi and Lin2007) provide a theoretical framework for modifying shape of the lactation and/or growth curves.
Growth (kg/day) by age for Landrace.

Growth (kg/day) by age for Duroc.

Conclusion
Based on model validation, the random regression model with Legendre polynomial up to second order was chosen for both breeds. Based on this model the heritability for weight at different ages (days) was found to be generally higher in the middle of the test period than in the beginning and the end. The heritability for weight, based on the Leg(2) model, was found to be 0.32–0.35 for Duroc and 0.17–0.25 for Landrace. Comparison of test lengths indicates that the testing period can be shortened with about 10 days less than 2% reduction in accuracy of selection (based on the current breeding goal). This also indicates that pre-selection of boars during the test is possible. Both alternatives will increase the testing capacity and thus selection intensity.
Acknowledgements
We gratefully acknowledge the helpful comments of two anonymous reviewers.