





1. Introduction
Chemotaxis refers to the motion of chemical attractant cells or organisms in response to a chemical stimulus (Brenner, Levitov & Budrene Reference Brenner, Levitov and Budrene1998). The mathematical model of this kind of cell mobility was first derived by Patlak (Reference Patlak1953) and Keller & Segel (Reference Keller and Segel1971). More specifically, Patlak (Reference Patlak1953) derived a mathematical model for particle movement, whereas Keller & Segel (Reference Keller and Segel1971) were the first to derive a mathematical model for the real living cell movement. In a suspension of chemotaxis cells (e.g. Bacillus subtilis) in a container open to the air, complex bioconvection patterns are formed. These patterns appear because the slightly dense diluted cell consumes oxygen, swims towards the higher concentration of oxygen (i.e. upwards) and accumulates close to the free surface. This phenomenon triggers a density change in the suspension, and Rayleigh–Taylor-type instabilities occur. There are two somewhat unique cases: a ‘shallow’ and a ‘deep’ chamber. In a shallow chamber, cells can swim actively due to the presence of a high-enough oxygen concentration throughout the chamber, whereas in a deep chamber, the oxygen concentration starts to decrease towards the bottom of the chamber, away from the free surface. Therefore, the chamber can be divided into active and inactive regions. Bacteria consume oxygen and then freely move to the active region, the inactive region forms at the bottom of the chamber, and the cells in it become less active due to the lack of oxygen. Experiments with shallow chambers have shown the formation of various complex, irregular patterns (Hill & Pedley Reference Hill and Pedley2005; Bestehorn Reference Bestehorn2009). Experiments with a very shallow or tilted chamber have shown no pattern formation (Ko & Chase Reference Ko and Chase1973; Pedley & Kessler Reference Pedley and Kessler1992; Comer Reference Comer2007). However, experiments with a deep chamber have shown regular and clear hexagonal bioconvection patterns, which turn more complex as the depth increases (Bees Reference Bees1998). Due to its significant role in medical, industrial and geophysical areas, many research groups have devoted their efforts to understanding the dynamics of cell motility in suspension. The chemotaxis phenomenon can be successfully modelled by coupling the two convection–diffusion types of equations governing the cell and oxygen concentrations with the Navier–Stokes equations involving the Boussinesq approximation. Previously published mathematical models were derived only for the case with a flat free surface to investigate such phenomena (Kessler et al. Reference Kessler, Hoelzer, Pedley and Hill1994; Hillesdon, Pedley & Kessler Reference Hillesdon, Pedley and Kessler1995; Hillesdon & Pedley Reference Hillesdon and Pedley1996; Metcalfe & Pedley Reference Metcalfe and Pedley1998). Hill & Pedley (Reference Hill and Pedley2005) reviewed the different mechanisms of up-swimming microorganisms and bioconvection. Chemotaxis–convection–diffusion is a particular type of bioconvection. The coupling phenomenon of chemotaxis, diffusion and convection has been illustrated in experiments of cell suspension by Hillesdon & Pedley (Reference Hillesdon and Pedley1996) and Hillesdon et al. (Reference Hillesdon, Pedley and Kessler1995). The same phenomenon was successfully illustrated in numerical simulations by Chertock et al. (Reference Chertock, Fellner, Kurganov, Lorz and Markowich2012), Lee & Kim (Reference Lee and Kim2015) and Deleuze et al. (Reference Deleuze, Chiang, Thiriet and Sheu2016). It would be more interesting to study all these phenomena for the distorted free surface with the impact of surface tension as this is relevant to many natural settings.
The pattern formation of microorganisms has been studied theoretically, experimentally and numerically, with the main focus on the blow-up phenomena in a finite time either for a flat free surface or for rigid top and bottom surfaces. Avramenko & Kuznetsov (Reference Avramenko and Kuznetsov2010) performed a linear stability analysis of both rigid top and open flat free surfaces and obtained a correlation between the critical value of the bioconvection Rayleigh number and the traditional ‘thermal’ Rayleigh number by heating the fluid flow from below, whereas Kuznetsov (Reference Kuznetsov2005) studied the same phenomena under an inclined temperature gradient. Both studies proved that the flow system becomes more unstable when the fluid is heated from below.
Plume formation and its stabilization result from the balance between the chemotaxis, diffusion and convection of cells. It is a known fact that chemotaxis brings instability to the nonlinear system and leads to aggregation; despite this fact, all previous stability analyses of the chemotaxis system were performed for the flat free surface only (Hill, Pedley & Kessler Reference Hill, Pedley and Kessler1989; Hillesdon Reference Hillesdon1994; Hillesdon et al. Reference Hillesdon, Pedley and Kessler1995; Hillesdon & Pedley Reference Hillesdon and Pedley1996; Metcalfe & Pedley Reference Metcalfe and Pedley2001; Hill & Pedley Reference Hill and Pedley2005; Kuznetsov Reference Kuznetsov2005; Avramenko & Kuznetsov Reference Avramenko and Kuznetsov2010). Kowalczyk, Gamba & Preziosi (Reference Kowalczyk, Gamba and Preziosi2004) performed a detailed linear stability analysis of two different models to check their potentials to form plumes on a homogeneous cell solution. However, Hillesdon & Pedley (Reference Hillesdon and Pedley1996) showed that the condition for linear instability of the chemotaxis–convection–diffusion system depends on the taxis Rayleigh number  ${{Ra_\tau }}$. Notably, previously published linear stability analysis results aid us in understanding the chemotaxis phenomenon at the onset of bioconvection. Moreover, nonlinear studies provide detailed information about the formation of complex bioconvection patterns/plumes and their respective stability in the system. Metcalfe & Pedley (Reference Metcalfe and Pedley1998) and Ma et al. (Reference Ma, Gao, Tong and Han2016) performed weakly nonlinear stability analyses to investigate the stability of the different patterns forming in the chemotaxis system. Tuval et al. (Reference Tuval, Cisneros, Dombrowski, Wolgemuth, Kessler and Goldstein2005) showed that the hydrodynamic vortices formed by convection strengthen the circulation of fluid and enhance the intake of oxygen into the solvent. Duan, Lorz & Markowich (Reference Duan, Lorz and Markowich2010) and Liu & Lorz (Reference Liu and Lorz2011) proved the global existence of the chemotaxis–Stokes system under small and large initial cell population densities, respectively. Following this, Chertock et al. (Reference Chertock, Fellner, Kurganov, Lorz and Markowich2012) numerically studied plume formation in the system for the flat free surface and revealed that the number and shape of the plumes can be controlled by the initial cell population density.
Metcalfe & Pedley (Reference Metcalfe and Pedley2001) derived both two-dimensional and three-dimensional mathematical models for only the active region of a deep chamber where the cells are active. Their study showed that the system is unstable near the flat free surface. They also studied the phenomenon of the formation of falling plumes of fluid with high density cells. Performing stability analysis in a two-dimensional model is sufficient to obtain information about the nature of the instability at the onset of bioconvection. However, this is not enough to obtain detailed information about the cell dynamics in the nonlinear regime. Thus, performing nonlinear stability analysis of a three-dimensional model is essential. Through weakly nonlinear stability analysis, the phenomenon of the formation of patterns/plumes with its nature of stability and nonlinear cell dynamics can be studied in detail. Hill & Pedley (Reference Hill and Pedley2005) considered only a shallow chamber to study the swimming behaviour of microorganisms, which involves nonlinear analysis of the patterns. Moreover, the stability analysis in both linear and nonlinear regimes was performed and discussed in detail by Metcalfe & Pedley (Reference Metcalfe and Pedley1998). Hillesdon et al. (Reference Hillesdon, Pedley and Kessler1995) formulated a three-dimensional model for both shallow and deep chambers and studied the formation of plumes. Their numerical results showed good qualitative agreement with experimental results. Hill et al. (Reference Hill, Pedley and Kessler1989) carried out linear stability analyses on the flat interfaces of a shallow and a finite depth chamber. Their investigations showed that the suspension becomes more unstable as the depth of the chamber increases. Pedley, Hill & Kessler (Reference Pedley, Hill and Kessler1988) performed a linear stability analysis of an infinite uniform suspension. Their results were verified again by Hill et al. (Reference Hill, Pedley and Kessler1989).
To study the dynamics of the chemotaxis–convection–diffusion system, the stability analysis must be performed in both linear and nonlinear regimes. Hillesdon & Pedley (Reference Hillesdon and Pedley1996) followed the same trail as Hillesdon et al. (Reference Hillesdon, Pedley and Kessler1995) did in their study on stability analysis and performed a linear stability analysis for both shallow and deep chambers to understand the nature of stability at the onset of bioconvection. In a shallow layer, there is a large amount of oxygen, while in a deep layer, there is a region far from the free surface where oxygen and, consequently, the cell concentration gradients are zero. This linear stability analysis was followed by a weakly nonlinear stability analysis by Metcalfe & Pedley (Reference Metcalfe and Pedley1998) to predict the patterns when the suspension is just deep enough for patterns to form. They drew the bifurcation diagram to exhibit the behaviour of the system. However, Hill & Pedley (Reference Hill and Pedley2005) performed a nonlinear stability analysis of pattern formation, and their study included the dispersion in shear flows along with the swimming behaviour of algal cells. It would be interesting to conduct the linear and nonlinear stability analyses of the chemotaxis–convection–diffusion system with deformed free surface and with the effect of surface tension.
Chakraborty et al. (Reference Chakraborty, Ivancic, Solovchuk and Sheu2018) performed a linear stability analysis of the two-dimensional distorted free surface of a chemotaxis–convection–diffusion system in a shallow chamber to investigate the formation of patterns at the onset of instability. However, the effect of the surface tension on the interfacial flow in a shallow chamber was neglected. It has been seen that the small but finite amplitude perturbations of the free surface are sufficient to trigger instability. Recently, Ivančić, Sheu & Solovchuk (Reference Ivančić, Sheu and Solovchuk2019) published their work on the effect of surface tension,  $\sigma$, which is a function of cell concentration,
 $n$. They solved the problem numerically by modifying the presently available model to render a more realistic one in both two and three dimensions, and they noted that the higher concentration of cells on the free surface decreases the effect of the surface tension of the fluid, which may have a significant impact on the onset of instability. It would be interesting to study the impact of surface tension on cell concentration and vice versa.
It was found in the literature that surface tension plays an important role in a thin film flow problem. It has a significant influence on the holding of the wave profile's shape. The occurrence of capillary ripples in a flow problem is mainly due to the presence of surface tension. This is why we were motivated to take into account the surface tension effect to describe the dynamics of the chemotaxis–convection–diffusion coupling system in a shallow chamber with a deformed free surface. A stability analysis of a three-dimensional chemotaxis system in a shallow chamber that considers the effect of surface tension at the deformed free surface has not been attempted yet. In this paper, we consider a homogeneous suspension with a deformed free surface in a shallow rectangular chamber. The novel aspects of the present work are that the free surface is allowed to deform, the surface tension effect is taken into account along with consideration of the free surface stress boundary condition of the chemotaxis system. Our aim is to explore the linear and nonlinear stability analyses of the chemotaxis–convection–diffusion system.
Most of the previously published studies were devoted to the chemotaxis system with the flat free surface and successfully explained the formation of patterns and the dynamics of falling plumes. However, the free surface is normally deformable in natural conditions. To the best of the authors’ knowledge, the linear and nonlinear stability analyses of the chemotaxis-convection-diffusion system for deformed free surface have not been performed yet. Most of the previously performed studies were devoted to the shallow chamber case. However, there are still many things worth exploring with regard to the deep chamber case. In the natural scenario, the chemotaxis system is complex in nature, and for this reason, nonlinear stability analysis needs to be performed. It is obvious that the presence of surface tension and normal, tangential stress boundary conditions will have a phenomenal impact on the pattern formation and the behaviour of the system. Therefore, we felt stimulated to perform the present study. We have performed linear and weakly nonlinear (in an upcoming paper) stability analyses at the onset of instability to study the dynamics of the formation of the patterns while considering the effect of the surface tension. It is a known fact that linear stability analysis provides only a basic idea about the formation of patterns. It cannot explain well the amplitude, types and significant physical role of pattern formation that results from cross-diffusion in the chemotaxis system. Thus, conducting weakly nonlinear stability analysis becomes necessary. Conducting nonlinear stability analysis would help us predict the characteristics of the patterns formed in the system. Besides, it would be really interesting to investigate the formation of these patterns under the influence of surface tension at the deformed free surface. However, to keep the present paper at a reasonable length, we provide only a detailed study of the linear stability analysis of the chemotaxis system. A complete study of the weakly nonlinear stability analysis will be presented in the next article. A comparison and detailed discussion of the numerical simulation results underlying the bifurcation theory will be included in an upcoming article.
The paper is organized as follows: the mathematical formulation of the chemotaxis– convection–diffusion system is presented and the steady-state solution is described in § 2. The linear stability analysis is performed and its analytical solutions are presented in § 3. The stability analysis results are discussed in § 4. Finally, some conclusions are summarized and recommendations for future works are provided in § 5.
2. Mathematical model
A three-dimensional shallow rectangular chamber containing an incompressible fluid with deformed free surface is considered. For the mathematical description of the three-dimensional chamber, we use a Cartesian coordinate system ( $x,y,z$), referring to the streamwise, spanwise and cross-wise coordinates, respectively. The top of the chamber is open to the air, and the motion of the fluid flow in a rectangular chamber is subjected to the tangential stress condition prescribed on the free surface,
 $z=h(x,y,t)$. The bottom and the sidewalls are rigid and impermeable to cells and oxygen (see figure 1).
Schematic diagram of a three-dimensional chemotaxis system with liquid–air interface  $\varGamma _s$, where the oxygen concentration is equal to that of air, not crossed by cell. No-slip boundary condition is imposed at the container walls
 $\varGamma _w$.

Under the full Boussinesq approximation, the dimensional form of the governing equations for the chemotaxis–convection–diffusion elliptic–parabolic system of equations for an incompressible fluid flow is as follows:
 $$\begin{gather} \boldsymbol{\nabla}\boldsymbol{\cdot}\boldsymbol{u} = 0, \end{gather}$$
 $$\begin{gather}\rho\left(\boldsymbol{u}_t + \boldsymbol{u}\boldsymbol{\cdot}\boldsymbol{\nabla} \boldsymbol{u} \right) + \boldsymbol{\nabla} p - \mu \nabla^{2}\boldsymbol{u} ={-} \rho g \boldsymbol{k} - n V_b g (\rho_b - \rho) \boldsymbol{k} , \end{gather}$$
 $$\begin{gather}n_t + \boldsymbol{\nabla}\boldsymbol{\cdot}\left[ \boldsymbol{u}n - D_b\boldsymbol{\nabla} n + S_{dim} r(c) n \boldsymbol{\nabla} c \right] = 0 , \end{gather}$$
 $$\begin{gather}c_t + \boldsymbol{\nabla}\boldsymbol{\cdot}\left( \boldsymbol{u}c - D_O \boldsymbol{\nabla} c \right) ={-}n\kappa r(c), \end{gather}$$
where  $\boldsymbol {u}=(u,v,w)$ denotes the flow velocity in the
 $(x,y,z)$-direction;
 $p$ denotes the hydrostatic pressure,
 $\rho$ and
 $\mu$ the fluid density and viscosity;
 $g$ denotes the gravitational acceleration,
 $n$ the number of cells per unit area,
 $V_b$ and
 $\rho _b$ the volume and volumetric mass density of a cell, respectively, and
 $c$ the oxygen concentration. The source term
 $V_bg(\rho _b - \rho )\boldsymbol {k}$ stands for the buoyancy force exerted by a cell on the liquid in the vertical direction, where
 $\boldsymbol {k}$ denotes the unit vector. The parameter
 $S_{dim}$ in (2.1c) is the dimensional chemotaxis sensitivity (the movement of cell towards higher concentration depends on the chemotaxis sensitivity,
 $S_{dim}$);
 $D_b$ and
 $D_O$ are the cell and oxygen diffusivities. In (2.1d),
 $\kappa$ is the rate of consumption of oxygen by bacterium. Bacteria are considered to be slightly denser than water such that
 $\rho _b>\rho$, where cells are supposed to swim in the water during the consumption of oxygen. Therefore, we have assumed
 $(\rho _b - \rho )/\rho \ll 1$ and
 $nV_b\ll 1$. The oxygen consumption is proportional to the cell population density
 $n$. The cell
 $(n)$ and oxygen
 $(c)$ concentrations are advected by the liquid flow. When the concentration of oxygen is lower than a threshold value, the cells become stable or inactive, i.e. they neither consume oxygen nor swim towards the region with higher oxygen concentration. This procedure is indicated by a non-dimensional cutoff function,
 $r(c)$, which is defined by the step function
 \begin{equation}
r(c) = \left\{\begin{array}{@{}ll} 1, & \textrm{if} \ c > c^{*}\\ 0, &
\textrm{if} \ c \leqslant c^{*} \end{array}
\right. \end{equation}
where  $c^{*}=0.3$ was derived by experiments (Hillesdon et al. Reference Hillesdon, Pedley and Kessler1995; Hillesdon & Pedley Reference Hillesdon and Pedley1996) (see supplementary material available at https://doi.org/10.1017/jfm.2021.508 for concise nomenclature).
The set of equations (2.1a)–(2.1d) is closed with the boundary conditions and will be solved in a three-dimensional rectangular container  $(\varOmega )$. The dynamic boundary conditions applied at the interface (
 $z=h(x,y,t$)) are
 $$\begin{gather} \boldsymbol{n}\boldsymbol{\cdot} \bar{\tau} \boldsymbol{\cdot} \boldsymbol{n} ={-} \left( \boldsymbol{\nabla} \boldsymbol{\cdot} \boldsymbol{n}\right) \sigma, \end{gather}$$
 $$\begin{gather}\boldsymbol{t}_1\boldsymbol{\cdot} \bar{\tau} \boldsymbol{\cdot} \boldsymbol{n} = 0, \end{gather}$$
 $$\begin{gather}\boldsymbol{t}_2\boldsymbol{\cdot} \bar{\tau} \boldsymbol{\cdot} \boldsymbol{n} = 0. \end{gather}$$
The stresses along the tangential and normal directions are balanced at the interface,  $z=h(x,y,t)$. The boundary conditions for cell and oxygen concentrations at the interface are
 $$\begin{gather} S_{dim} n r(c)\boldsymbol{\nabla} c\boldsymbol{\cdot}\boldsymbol{n} = D_b\boldsymbol{\nabla} n\boldsymbol{\cdot}\boldsymbol{n}, \end{gather}$$
 $$\begin{gather}c = c_{air}. \end{gather}$$
The kinematic boundary condition is
 \begin{equation} h_t = w - u h_x - v h_y, \end{equation}
where  $\bar {\tau }$ is the stress tensor for the liquid,
 $\boldsymbol {n}(={(-h_x,-h_y,1)}/{N})$ and
 $t_1(= {(1,0,h_x)}/{\sqrt {1+h^{2}_x}})$ and
 $t_2(={(0,1,h_y)}/{\sqrt {1+h^{2}_y}})$ are the unit outward normal and tangential vectors on the interface and
 $N=\sqrt {1+h^{2}_x+h^{2}_y}$. A no-slip boundary condition is applied on the container walls
 $(\varGamma _w)$; the fluxes of cell and oxygen are equal to zero
 \begin{equation} u = 0, \quad v = 0, \quad w = 0, \quad \boldsymbol{\nabla} n\boldsymbol{\cdot}\boldsymbol{n} = 0, \quad \boldsymbol{\nabla} c \boldsymbol{\cdot}\boldsymbol{n} = 0. \end{equation}
The characteristic cell density is defined as the average of the initial cell population
 \begin{equation} \overline{n_0} = \frac{1}{|\varOmega|} \int_\varOmega n_0(x,y,t)\, {\textrm{d} x} . \end{equation}
By the choice of this characteristic cell density, the total number of cells can be measured easily in each simulation under different initial distributions of cells.
Equations (2.1)–(2.3) can be expressed in terms of their dimensionless forms by using the following variables:
 \begin{equation} \left.\begin{gathered} x = Lx', \quad y = Ly', \quad z = h_0z', \quad h = h_0 h', \quad n = \overline{n_0}n', \quad c = c_{air}c', \\ t = \frac{h^{2}_0}{\varepsilon D_b}t', \quad p = \frac{\mu D_b}{\varepsilon h^{2}_0}p', \quad u = \frac{D_b}{h_0}u', \quad v = \frac{D_b}{h_0}v' \quad w = \frac{\varepsilon D_b}{h_0}w', \end{gathered}\right\} \end{equation}
where  $h_0$ and
 $L$ are the characteristic length scales in the vertical and horizontal directions, respectively,
 $\varepsilon = {h_0}/{L}\ll 1$ is an aspect ratio. Finally, after dropping the prime from the dimensionless quantities, the dimensionless Navier–Stokes equations for the incompressible fluid flow and the Keller–Segel equation for
 $n$ and
 $c$ can be read as
 \begin{gather} u_x + v_y + w_z = 0 ,\end{gather}
 \begin{gather} \varepsilon(u_t + u u_x + v u_y + w u_z) + {{Pr_\tau}}p_x = {{Pr_\tau}}[\varepsilon^{2}( u_{xx} + u_{yy}) + u_{zz}] , \end{gather}
 \begin{gather} \varepsilon(v_t + u v_x + v v_y + w v_z) + {{Pr_\tau}}p_y = {{Pr_\tau}}[\varepsilon^{2}( v_{xx} + v_{yy}) + v_{zz}] , \end{gather}
 \begin{gather} \varepsilon^{3}(w_t + u w_x + v w_y + w w_z) + {{Pr_\tau}}p_z = \varepsilon^{2} {{Pr_\tau}}[ \varepsilon^{2}(w_{xx} + w_{yy}) + w_{zz}]- \varepsilon Fr^{{-}2}_\tau\nonumber\\ \hspace{7.7pc}- \varepsilon {{Pr_\tau}} {{Ra_\tau}}n, \end{gather}
 \begin{gather} \varepsilon(n_t + u n_x + v n_y + w n_z) = [\varepsilon^{2}(n_{xx} + n_{yy}) + n_{zz}] - {{S_\tau}}r(c)(n[\varepsilon^{2} (c_{xx} + c_{yy})+ c_{zz}]\nonumber\\ \hspace{3.7pc}+\, [\varepsilon^{2} (c_x n_x + c_y n_y) + c_z n_z] ), \end{gather}
 \begin{gather} \varepsilon(c_t + u c_x + v c_y + w c_z) + {{H_\tau}}r(c) n = {{Le_\tau}}[\varepsilon^{2}( c_{xx} + c_{yy}) + c_{zz}] .\end{gather}
The above set of dimensionless governing equations is subject to the dimensionless boundary conditions prescribed on the deformed free surface  $z=h(x,y,t)$
 \begin{align} &- p + \frac{2\varepsilon^{2} [\varepsilon^{2}(u_x h^{2}_x + (u_y + v_x) h_x h_y + v_y h^{2}_y) - (u_z + \varepsilon^{2} w_x) h_x - (v_z + \varepsilon^{2} w_y) h_y + w_z]}{[ 1+\varepsilon^{2}(h^{2}_x + h^{2}_y)]}\nonumber\\ &\quad = \frac{\varepsilon^{3} [(1+\varepsilon^{2} h^{2}_x)h_{yy} - 2\varepsilon^{2} h_x h_y h_{xy} + (1+\varepsilon^{2} h^{2}_y)h_{xx}]}{{{Ca_\tau}} [1+\varepsilon^{2}(h^{2}_x + h^{2}_y) ]^{3/2}}, \end{align}
 \begin{equation} (1-\varepsilon^{2} h^{2}_x) (u_z+\varepsilon^{2} w_x) + 2\varepsilon^{2}(w_z-u_x)h_x - \varepsilon^{2} (u_y+v_x)h_y - \varepsilon^{2} (v_z+\varepsilon^{2} w_y)h_x h_y = 0, \end{equation}
 \begin{equation} (1-\varepsilon^{2} h^{2}_y) (v_z+\varepsilon^{2} w_y) + 2\varepsilon^{2}(w_z-v_y)h_y - \varepsilon^{2} (u_y+v_x)h_x - \varepsilon^{2} (u_z+\varepsilon^{2} w_x)h_x h_y = 0, \end{equation}
 \begin{equation} {{S_\tau}}r(c) n[c_z-\varepsilon^{2}(c_x h_x+c_y h_y)] - [n_z-\varepsilon^{2}(n_x h_x+n_y h_y)] = 0, \end{equation}
 \begin{equation} c = 1 . \end{equation}
On the other boundaries, we prescribe
 $$\begin{gather} u = 0, \quad v = 0, \quad w = 0, \end{gather}$$
 $$\begin{gather}n_z = \varepsilon^{2} \left(n_x h_x + n_y h_y\right), \end{gather}$$
 $$\begin{gather}c_z = \varepsilon^{2} \left(c_x h_x + c_y h_y\right) . \end{gather}$$
The kinematic boundary condition is
 \begin{equation} h_t + u h_x + v h_y = w . \end{equation}
The dimensionless parameters are defined as
 \begin{equation} \left.\begin{gathered} {{Pr_\tau}} = \frac{\nu}{D_b}, \quad {{Ra_\tau}} = \frac{g V_b \overline{n_0} (\rho_b - \rho) h^{3}_0}{D_b \mu}, \quad {{Fr_\tau}} = \frac{D_b}{\sqrt{g h^{3}_0}}, \quad {{Ca_\tau}} = \frac{\mu D_b}{\sigma h_0},\\ {{S_\tau}} = \frac{S_{dim}c_{air}}{D_b}, \quad {{H_\tau}} = \frac{\kappa \overline{n_0} h^{2}_0}{c_{air} D_b}, \quad {{Le_\tau}} = \frac{D_O}{D_b}. \end{gathered}\right\} \end{equation}
In the above equation,  ${{Pr_\tau }}$ is the taxis Prandtl number,
 ${{Ra_\tau }}$ the taxis Rayleigh number (buoyancy-driven flow),
 ${{Fr_\tau }}$ the taxis Froude number,
 ${{Ca_\tau }}$ the taxis capillary number,
 ${{S_\tau }}$ the dimensionless chemotaxis sensitivity,
 ${{H_\tau }}$ the chemotaxis head and
 ${{Le_\tau }}$ the taxis Lewis number. The chemotaxis head represents the consumption of the chemo-attractant by the cell. The chemotaxis system is characterized by chemotaxis sensitivity (
 ${{S_\tau }}$) and head (
 ${{H_\tau }}$). It can be seen from (2.8) that only
 ${{Ra_\tau }}$ and
 ${{H_\tau }}$ depend on the characteristic length
 $h_0$ and the characteristic cell density
 $\overline {n_0}$. In summary, the hydrodynamic and chemotaxis transport equations currently under investigation are characterized by the above-mentioned seven non-dimensional parameters.
The present dimensionless parameters, such as  ${{Pr_\tau }}$,
 ${{Ra_\tau }}$,
 ${{Le_\tau }}$,
 ${{S_\tau }}$ and
 ${{H_\tau }}$, are different from the parameters defined by Hillesdon & Pedley (Reference Hillesdon and Pedley1996). For better readability, the differences are stated as follows:
 ${{S_\tau }}\sim \gamma _\textrm {HP}$,
 ${{{H_\tau }}}/{{{Le_\tau }}}\sim \beta _\textrm {HP}$,
 ${{Le_\tau }}\sim \delta _\textrm {HP}$,
 ${{Pr_\tau }}\sim Sc_\textrm {HP}$ and
 ${{Ra_\tau }}\sim \varGamma _\textrm {HP}$, where the subscript
 $\textrm {HP}$ refers to Hillesdon & Pedley (Reference Hillesdon and Pedley1996). Other dimensionless parameters in the present chemotaxis system are
 ${{Ca_\tau }}$, which indicates the situation when a flow system comes into play due to the surface tension contribution, and
 ${{Fr_\tau }}$, which exhibits the influence of gravity on cell diffusion.
2.1. Steady-state solutions
In steady-state flow, the fluid properties of the system do not change over time. The pressure, velocity and cell and oxygen concentrations will vary in the  $z$-direction only. The solution for
 $p(z)$ is obtained as follows by integrating (2.6d) with the boundary condition (2.7a)
 \begin{equation} p(z) = \frac{\varepsilon}{{{Pr_\tau}} {{Fr_\tau}}^{2}}(1-z) . \end{equation}
The solutions for  $n(z)$ and
 $c(z)$ are obtained as follows:
 $$\begin{gather} c(z) = 1 -\frac{2}{{{S_\tau}}}\ln\left(\frac{\cos\left(\dfrac{{{S_\tau}}}{2}A_1z\right)}{\cos\left(\dfrac{{{S_\tau}}}{2}A_1 \right)}\right) , \end{gather}$$
 $$\begin{gather}n(z) = \frac{{{S_\tau}}}{2}\frac{{{Le_\tau}}A^{2}_1}{{{H_\tau}}}\sec^{2}\left(\frac{{{S_\tau}}}{2}A_1z\right), \end{gather}$$
where the unknown constant  $A_1$ is determined from the transcendental equation given by Hillesdon & Pedley (Reference Hillesdon and Pedley1996)
 \begin{equation} \tan\left(\frac{{{S_\tau}}}{2}A_1\right) = \frac{{{H_\tau}}}{{{Le_\tau}}}\frac{1}{A_1} . \end{equation}
Detailed derivations of steady-state solutions have been presented in previous publications (Hillesdon et al. Reference Hillesdon, Pedley and Kessler1995; Hillesdon & Pedley Reference Hillesdon and Pedley1996; Chakraborty et al. Reference Chakraborty, Ivancic, Solovchuk and Sheu2018). Expansion of the above equation yields a value of  $A_1$ of the order of
 $O({{H_\tau }}/Le_{\tau })$. By substituting the value of
 $A_1$ into (2.10), we get the steady-state concentrations for cell and oxygen. The expansion of (2.11) is possible only when
 $A_1\tan (({{{S_\tau }}}/{2})A_1)={{{H_\tau }}}/{{{Le_\tau }}}\ll 1$. It is necessary to expand the steady-state solutions (2.10) and (2.11) in powers of
 ${{H_\tau }}/Le_{\tau }$. The expansion for
 $A_1$ in (2.11), (2.10a) and (2.10b) gives, respectively,
 $$\begin{gather} A_1 = \left(\frac{2{{H_\tau}}}{{{S_\tau}}{{Le_\tau}}}\right)^{1/2}\left(1 - \frac{{{S_\tau}}}{12}\frac{{{H_\tau}}}{{{Le_\tau}}} + \frac{7{{S_\tau}}^{2}}{288}\frac{{{H_\tau}}^{2}}{Le^{2}_\tau} + O\left(\frac{{{H_\tau}}}{{{Le_\tau}}}\right)^{3} \right), \end{gather}$$
 $$\begin{gather}c = 1 + \frac{1}{2}(z^{2} - 1)\frac{{{H_\tau}}}{{{Le_\tau}}} + \frac{{{S_\tau}}}{24}(z^{2} - 1)^{2} \frac{{{H_\tau}}^{2}}{Le^{2}_\tau} + O\left(\frac{{{H_\tau}}}{{{Le_\tau}}}\right)^{3} , \end{gather}$$
 $$\begin{gather}n = 1 + \frac{{{S_\tau}}}{6}(3z^{2} - 1)\frac{{{H_\tau}}}{{{Le_\tau}}} + \frac{{{S_\tau}}^{2}}{18}(1 - 3z^{2} + 3z^{4}) \frac{{{H_\tau}}^{2}}{Le^{2}_\tau} + O\left(\frac{{{H_\tau}}}{{{Le_\tau}}}\right)^{3} . \end{gather}$$
It should be noted here that this shallow chamber instability problem depends on  ${{S_\tau }}$,
 ${{H_\tau }}$ and
 ${{Le_\tau }}$ and
 $Le_{\tau }\gg {{H_\tau }}$. From (2.12)–(2.13), we can also see that
 $c(z)$ and
 $n(z)$ can be written as functions of the two variables
 $z$ and
 ${{S_\tau }}{{H_\tau }}/Le_{\tau }$. Note that the expressions for the steady-state solutions of the cell and oxygen concentrations in the present system are different from those mentioned in the works of Hillesdon (Reference Hillesdon1994), Hillesdon & Pedley (Reference Hillesdon and Pedley1996) and Metcalfe & Pedley (Reference Metcalfe and Pedley1998) (steady-state profiles for a shallow chamber are independent of
 $\delta _\textrm {HP}$ and only vary with
 $\gamma _\textrm {HP}\beta _\textrm {HP}$).
3. Linear stability analysis
In this study, the aim behind conducting linear stability analysis is to investigate the onset of buoyancy-driven instability. The instability starts appearing if the Rayleigh number, which is the ratio of the buoyancy to viscous forces, reaches a critical value. In this section, we seek the critical Rayleigh number, which is the function of the physical parameters of the system. We first linearize the governing equations in (2.6) by adding small perturbations to the steady-state solutions. Then, the resulting equations are solved for perturbations with a wavenumber  $k$, which corresponds to the dimensionless wavelength
 $\lambda =2{\rm \pi} /k$.
Here, we perturb the following field variables with respect to their respective basic state solutions:
 $$\begin{gather} \boldsymbol{u}(\boldsymbol{x},t) = \epsilon \tilde{\boldsymbol{u}}(\boldsymbol{x},t), \end{gather}$$
 $$\begin{gather}p(\boldsymbol{x},t) = p(z) + \epsilon \tilde{p}(\boldsymbol{x},t) , \end{gather}$$
 $$\begin{gather}n(\boldsymbol{x},t) = n(z) + \epsilon \tilde{n}(\boldsymbol{x},t), \end{gather}$$
 $$\begin{gather}c(\boldsymbol{x},t) = c(z) + \epsilon \tilde{c}(\boldsymbol{x},t), \end{gather}$$
 $$\begin{gather}h(\boldsymbol{x},t) = 1 + \epsilon \tilde{\eta}(\boldsymbol{x},t), \end{gather}$$
where the components of  $\tilde {\boldsymbol {u}}$ are (
 $\tilde {u}, \tilde {v}, \tilde {w}$) and
 $\boldsymbol {x}$ denotes (
 $x, y, z$). After substituting (3.1) into the dimensionless governing equations (2.6) along with the dimensionless boundary conditions (2.7) and eliminating
 $\tilde {u}$,
 $\tilde {v}$ and
 $\tilde {p}$, the resulting equations can be expressed in terms of
 $\tilde {w}$,
 $\tilde {n}$,
 $\tilde {c}$ and
 $\tilde {\eta }$ only. Then, the solutions are sought in the form of normal modes
 \begin{equation} [\tilde{w}, \tilde{n}, \tilde{c}, \tilde{\eta}] = \left[W(z), N(z), C(z), \eta\right] \exp({\textrm{i} (k_x x + k_y y) - \omega t}) . \end{equation}
Introducing (3.2) into the perturbation expressions given in (3.1a) and (3.1c)–(3.1e), the resulting system of equations renders
 \begin{gather} \left[\frac{\textrm{d}^{2}}{\textrm{d}z^{2}} -\left(\frac{\varepsilon\omega}{{{Pr_\tau}}} + \varepsilon^{2}k^{2}\right)\right]\left(\frac{\textrm{d}^{2}}{\textrm{d}z^{2}} - \varepsilon^{2}k^{2}\right)W + \varepsilon k^{2}{{Ra_\tau}}N = 0, \end{gather}
 \begin{gather} \frac{\textrm{d}^{2}N}{\textrm{dz}^{2}} - {{S_\tau}}\frac{\textrm{d}c}{\textrm{d}z}\frac{\textrm{d}N}{\textrm{d}z} - \left(\varepsilon^{2}k^{2} - \varepsilon\omega + {{S_\tau}}\frac{\textrm{d}^{2}c}{\textrm{d}z^{2}} + n(z)\frac{{{H_\tau}} {{S_\tau}}}{{{Le_\tau}}}\right)N\nonumber\\ = \varepsilon\frac{\textrm{d}n}{\textrm{d}z}W + {{S_\tau}}\left(\frac{\varepsilon n(z)}{{{Le_\tau}}}\frac{\textrm{d}c}{\textrm{d}z}W + \frac{\textrm{d}n}{\textrm{d}z}\frac{\textrm{d}C}{\textrm{d}z} - \frac{\varepsilon\omega n(z)}{{{Le_\tau}}}C\right), \end{gather}
 \begin{gather} \frac{\textrm{d}^{2}C}{\textrm{d}z^{2}} - \left(\frac{\varepsilon\omega}{{{Le_\tau}}} + \varepsilon^{2}k^{2}\right)C - \frac{\varepsilon} {{{Le_\tau}}}\frac{\textrm{d}c}{\textrm{d}z}W - \frac{{{H_\tau}}}{Le_\tau}N = 0, \end{gather}
where  $k=\sqrt {{k_x}^{2} + {k_y}^{2}}$,
 $k_x$ and
 $k_y$ are the wavenumbers of the disturbance in the
 $x$- and
 $y$- directions, and
 $\omega$ is the complex angular frequency, which has the complex wave velocity
 ${c}=\omega /k$. Seeking of the solutions to the above system of equations (3.3) is subject to the boundary conditions prescribed at the interface and at the other boundaries
 \begin{gather} 2\varepsilon^{2}\omega{{Ca_\tau}}\frac{\textrm{d}W(1)}{\textrm{d}z} + \varepsilon\left(\varepsilon^{2}k^{2} + \frac{{{Ca_\tau}}}{{{Pr_\tau}} {{{Fr_\tau}}}^{2}} \right) W(1)= 0, \end{gather}
 \begin{gather} \frac{\textrm{d}^{3}W(1)}{\textrm{d}z^{3}} + \varepsilon^{2}k^{2}\frac{\textrm{d}W(1)}{\textrm{d}z} = 0, \end{gather}
 \begin{gather} \frac{\textrm{d}N(1)}{\textrm{d}z} - {{S_\tau}}\frac{\textrm{d}c(1)}{\textrm{d}z}N(1) - {{S_\tau}}n\frac{\textrm{d}C(1)}{\textrm{d}z} \nonumber\\ = \frac{1}{\omega} \frac{\textrm{d}^{2}n(1)}{\textrm{d}z^{2}}W(1)- \frac{{{S_\tau}}}{\omega}\left(n\frac{\textrm{d}^{2}c(1)}{\textrm{d}z^{2}} + \frac{\textrm{d}c(1)}{\textrm{d}z} \frac{\textrm{d}n(1)}{\textrm{d}z}\right)W(1), \end{gather}
 \begin{gather} C(1) = 0, \end{gather}
 \begin{gather} W(0) = 0, \quad \frac{\textrm{d}W(0)}{\textrm{d}z} = 0, \quad \frac{\textrm{d}N(0)}{\textrm{d}z} = 0, \quad \frac{\textrm{d}C(0)}{\textrm{d}z} = 0 . \end{gather}
No-slip boundary condition is directly implemented in the numerical simulations. Use of periodic boundary conditions will be helpful in stability analysis. It should be mentioned that  ${{Ca_\tau }}$ and
 ${{Fr_\tau }}$ have significant effects on the free surface of the chemotaxis flow system. To perform temporal stability analysis, we consider real wavenumber components
 $k_x$,
 $k_y$ (the disturbance travels in the direction
 $\tan ^{-1}(k_y/k_x)$), and the temporal growth rate is
 $\omega _i$. If
 $\omega _i>0$, the disturbance grows in time with the phase velocity
 $\omega _r/k$. The real angular frequency is
 $\omega _r$, while the phase velocities along the
 $x, y$ axes are
 $\omega _r/k_x$,
 $\omega _r/k_y$, respectively (subscripts
 $_{{r}}$ and
 $_{{i}}$ denote the real and imaginary parts, respectively). The real angular frequency is related to the ordinary frequency and will be written in terms of a wave velocity
 ${c}_{{r}}$ and a wavelength
 $\lambda$, i.e.
 $f={c}_{{r}}/\lambda ={c}_{{r}}/(2{\rm \pi} /k)=\omega _{{r}}/(2{\rm \pi} )$ or
 $\omega _{{r}}=2{\rm \pi} f$.
When performing spatial stability analysis, we impose wavenumber components  $\omega$ as real and seek
 $k_x$ and
 $k_y$. The spatial growth rate is
 $-k_{x_{{i}}}$. If
 $k_{x_{{i}}}<0$, the disturbance grows in space and the phase velocity is
 $\omega /k_{x_{{r}}}$.
We solve the above system of equations shown in (3.3) using Auto07p software (Doedel Reference Doedel2008). The spatial stability analysis ( $k$ complex and
 $\omega$ real) is performed starting from its analytical solution at
 $k=0$.
3.1. Analytical solutions
We would like to express  $W$,
 $C$ and
 $N$ in powers of
 ${{{S_\tau }}{{H_\tau }}}/{{{Le_\tau }}}$. Then, the leading term (and higher orders, if desired) will possibly be obtained in each of the series. For the sake of simplicity, we consider the case with a small wavenumber
 $k\sim ({{{S_\tau }}{{H_\tau }}}/{{{Le_\tau }}})^{{1/2}}$, such that
 $k^{2}={\tilde {k}}^{2}({{{S_\tau }}{{H_\tau }}}/{{{Le_\tau }}})$ is of order
 $O(1)$ (this is to keep the dimensional wavenumber fixed as
 $h\to 0$). The statement ‘the higher-order derivative and the right-hand side must hold in (3.3a) at the leading order of
 $W$’ is required to get a non-trivial solution. Then, the reduced equation takes the form
 \begin{equation} \left(\frac{\textrm{d}^{2}}{\textrm{d} z^{2}} - \frac{\varepsilon\omega}{{{Pr_\tau}}}\right) \frac{\textrm{d}^{2}W}{\textrm{d} z^{2}} ={-} \varepsilon \tilde{k}\frac{{{S_\tau}}{{H_\tau}}}{{{Le_\tau}}}N {{Ra_\tau}} , \end{equation}
i.e. the viscous force,  ${\textrm {d}^{4}W}/{\textrm {d} z^{4}}$, balances the buoyancy force on the right-hand side, leaving aside the time dependence on
 $\omega$. Without any loss of generality, we also specify that
 $N=1$ at
 $z=1$, and set
 $C=({{{H_\tau }}}/{{{Le_\tau }}})\bar {C}$. Now, we have the possibility of getting the leading orders of
 $N$ and
 $\bar {C}$ in (3.3b) and (3.3c), which prospectively lead to the non-trivial solutions. Here, two cases can be considered: first,
 ${{Ra_\tau }}\sim O(1)$ and
 $\omega \sim O({{{S_\tau }}{{H_\tau }}}/{{{Le_\tau }}})$; second,
 ${{Ra_\tau }}\sim O({{{Le_\tau }}}/{{{S_\tau }}{{H_\tau }}})$ and
 $\omega \sim O({{{S_\tau }}{{H_\tau }}}/{{{Le_\tau }}})$ (for detail, see Hillesdon & Pedley Reference Hillesdon and Pedley1996; Chakraborty et al. Reference Chakraborty, Ivancic, Solovchuk and Sheu2018). However, the solutions of the first case render a negative value of
 $\omega$, indicating that the system is stable under all circumstances. For this reason, we choose the second case to perform the analysis where it is desirable to carry out expansions of the form
 \begin{equation} \left.\begin{gathered} N(z) = \sum_{i=0}^{\infty} N_i(z) \left(\frac{{{S_\tau}}{{H_\tau}}}{{{Le_\tau}}}\right)^{i}, \quad \bar{C}(z) = \sum_{i=0}^{\infty} \bar{C}_i(z) \left(\frac{{{S_\tau}}{{H_\tau}}}{{{Le_\tau}}}\right)^{i}, \\ W(z) = \sum_{i=0}^{\infty} W_i(z) \left(\frac{{{S_\tau}}{{H_\tau}}}{{{Le_\tau}}}\right)^{i},\\ \mbox{and}\\ \omega(\tilde{k}) = \sum_{i=1}^{\infty} \omega_i(\tilde{k}) \left(\frac{{{S_\tau}}{{H_\tau}}}{{{Le_\tau}}}\right)^{i}, \quad {{Ra_\tau}}(\tilde{k}) = \sum_{i={-}1}^{\infty} Ra_{{\tau}_i}(\tilde{k})\left(\frac{{{S_\tau}}{{H_\tau}}}{{{Le_\tau}}}\right)^{i} . \end{gathered}\right\} \end{equation}
So, at the leading order, the governing equations become
 \begin{equation} \frac{\textrm{d}^{4}W_0}{\textrm{d} z^{4}} ={-} \varepsilon \tilde{k}^{2}N_0 {{{Ra_\tau}}}_{{-}1}, \quad \frac{\textrm{d}^{2}\bar{C}_0}{\textrm{d} z^{2}}=N_0, \qquad \frac{\textrm{d}^{2}N_0}{\textrm{d} z^{2}}=0 , \end{equation}
with the boundary conditions
 \begin{equation} \left.\begin{gathered} \frac{\textrm{d}^{3}W_0(1)}{\textrm{d} z^{3}} = 0, \quad \frac{\textrm{d}^{2}W_0(1)}{\textrm{d} z^{2}} = 0, \quad \bar{C}_0(1) = 0, \quad \frac{\textrm{d} N_0(1)}{\textrm{d} z} = 0,\\ \frac{\textrm{d}W_0(0)}{\textrm{d} z} = 0, \quad W_0(0) = 0, \quad \frac{\textrm{d} N_0(0)}{\textrm{d} z} = 0, \quad \frac{\textrm{d}\bar{C}_0(0)}{\textrm{d} z} = 0 . \end{gathered}\right\} \end{equation}
In this study, we have arbitrarily set  $N_0=1$ at
 $z=1$, and the corresponding solutions are
 $$\begin{gather} W_0(z) ={-} \frac{\tilde{k}^{2}\varepsilon Ra_{{\tau}_{{-}1}}}{24}z^{2}(z^{2}-4z+6) , \end{gather}$$
 $$\begin{gather}\bar{C}_0(z) = \tfrac{1}{2}(z^{2} - 1) , \end{gather}$$
 $$\begin{gather}N_0(z) = 1 . \end{gather}$$
At the next order, the governing equations are
 \begin{equation} \left.\begin{gathered}
\frac{\textrm{d}^{4}W_1}{\textrm{d} z^{4}} =
\left(\frac{\varepsilon\omega_1}{{{Pr_\tau}}} +
2\tilde{k}^{2}\varepsilon^{2}
\right)\frac{\textrm{d}^{2}W_0}{\textrm{d} z^{2}} -
\tilde{k}^{2}\varepsilon\left(Ra_{{\tau}_0} N_0 +
Ra_{{\tau}_{{-}1}} N_1 \right) ,\\
\frac{\textrm{d}^{2}\bar{C}_1}{\textrm{d} z^{2}} = N_1 +
\tilde{k}^{2}\varepsilon^{2}\bar{C}_0 ,\\
\frac{\textrm{d}^{2} N_1}{\textrm{d} z^{2}} = (2 +
\varepsilon\omega_1 + \tilde{k}^{2}\varepsilon^{2})
N_0 + z\frac{\textrm{d} N_0}{\textrm{d} z} + z\varepsilon
W_0, \end{gathered}\right\}
\end{equation}
with the boundary conditions
 \begin{equation} \left.\begin{gathered} \frac{\textrm{d}^{3}W_1(1)}{\textrm{d} z^{3}} + \tilde{k}^{2}\varepsilon^{2} \frac{\textrm{d}W_0(1)}{\textrm{d} z} = 0,\\ W_1(1) + 2\varepsilon\omega_1{{Pr_\tau}}{{Fr_\tau}}^{2}\frac{\textrm{d}W_0(1)}{\textrm{d} z} + \tilde{k}^{2} \varepsilon^{2}\frac{{{Pr_\tau}}{{Fr_\tau}}^{2}}{{{Ca_\tau}}} W_0(1) = 0,\\ \frac{\textrm{d} N_1(1)}{\textrm{d} z} - \frac{\textrm{d}\bar{C}_0(1)}{\textrm{d} z} + \frac{\omega_2}{\omega_1}\frac{\textrm{d} N_0(1)}{\textrm{d} z} - N_0(1) = 0,\quad \bar{C}_1(1) = 0, \\ \frac{\textrm{d}W_1(0)}{\textrm{d} z} = 0, \quad W_1(0) = 0, \quad \frac{\textrm{d} N_1(0)}{\textrm{d} z} = 0, \quad \frac{\textrm{d}\bar{C}_1(0)}{\textrm{d} z} = 0. \end{gathered}\right\} \end{equation}
Then, we solve the above system of equations with the corresponding boundary conditions to get the solutions of  $W_1$,
 $\bar {C}_1$ and
 $N_1$ at the first order. The solutions are given in Appendix A.
Similarly, we will solve the system of equations at the second order using the zeroth- and first-order solutions which are mentioned in Appendix A.
The first-order solution consists of functions of  $N_1$,
 $\bar {C}_1$ and
 $W_1$, and we can obtain
 \begin{equation} \omega_1 = 0 , \quad \mbox{or}, \quad \omega_1 = \tilde{k}^{2} \varepsilon\left(\frac{7}{1440}{{Ra_\tau}}_{{-}1} - 1\right) , \end{equation}
i.e. the instability is either stationary or non-oscillatory.
For the second-order solution, we find  $\omega _2$ as follows:
 \begin{equation} \omega_2 =
\frac{\tilde{k}^{2}\varepsilon (7{{Ra_\tau}}_{{-}1} -
1440)(7! \tilde{k}^{2}\varepsilon^{2}{{Fr_\tau}}^{2}{{Pr_\tau}}^{2}
+ (37\tilde{k}^{2} \varepsilon^{2} - 784){{Pr_\tau}} -
102\tilde{k}^{2}\varepsilon^{2})}{8!21{{Pr_\tau}}}.
\end{equation}
It can be noticed from (3.11a,b) that the system is unstable to small wavenumber disturbances if  $Ra_{{\tau }_{-1}}>(1440/7)$. The resultant instability indicates that the system under investigation is non-oscillatory. It would be interesting to study the marginal stability when
 $\omega _r=0$ and calculate
 $\omega _i$. Marginal stability (
 $\omega =0$) occurs when
 \begin{equation} {{Ra_\tau}}(\tilde{k}) = \frac{1440}{7({{S_\tau}}{{H_\tau}}/{{Le_\tau}})}+O(1) . \end{equation}
The correction of  $Ra_{{\tau }_0}$ to the value of
 ${{Ra_\tau }}(\tilde {k})$ in (3.13) for marginal stability can now be found in terms of
 $Ra_{\tau _{-1}}$ and
 $\tilde {k}^{2}$ using (3.12).
4. Results and discussions
In the present paper, we have introduced two new physical dimensionless parameters, namely, the Froude number,  ${{Fr_\tau }}$, and the capillary number,
 ${{Ca_\tau }}$, which are varied in the parametric study and discussed in detail. We have also independently varied other physical parameters such as
 ${{Le_\tau }}$,
 ${{S_\tau }}$,
 ${{H_\tau }}$ and
 $\varepsilon$, in the parametric study. The impact of these parameters on the chemotaxis–convection–diffusion system is addressed in the following sections. The results are discussed according to the variation of parameters. The following results are plotted using analytical solutions in § 3.1.
4.1. Vary  ${{Le_\tau }}$; other parameters are fixed

The steady-state profiles for a shallow chamber are dependent on  ${{Le_\tau }}$,
 ${{H_\tau }}$ and
 ${{S_\tau }}$; however, in Hillesdon & Pedley (Reference Hillesdon and Pedley1996), these profiles are independent of
 $\delta _\textrm {HP}$ and vary only with
 $\gamma _\textrm {HP}\beta _\textrm {HP}$. It is also important to recall that they considered the vertical axis of the shallow chamber as
 $z=1$ at bottom and
 $z=0$ at the top, whereas we have taken the axis to be the vertical direction opposite to it, i.e.
 $z=0$ at the bottom and
 $z=1$ at the top boundary. We have changed the axes orientation of the model of Hillesdon & Pedley (Reference Hillesdon and Pedley1996) and presented their results in comparison with ours in figure 2. Since the steady-state solutions of cell and oxygen concentrations in Hillesdon & Pedley (Reference Hillesdon and Pedley1996) are independent of
 $\delta _\textrm {HP}$, we have compared our steady-state results for
 ${{Le_\tau }}=1$ and also varied the value of
 ${{Le_\tau }}=5$ to study the impact of the diffusivity variations. The results for a variety of shallow chamber examples have been presented, in which they covered the whole steady-state density profiles ranging from
 ${{S_\tau }}{{H_\tau }}/{{Le_\tau }}\sim \gamma _\textrm {HP}\beta _\textrm {HP}=0.8$ (nearly uniform) to
 ${{S_\tau }}{{H_\tau }}/{{Le_\tau }}\sim \gamma _\textrm {HP}\beta _\textrm {HP}=300$ (highly dense at the top). It can be observed from the comparison that the concentration levels of both cells and oxygen are equally distributed. However, the variation of
 ${{Le_\tau }}$ shows that the movement of the cells becomes much faster as the diffusivity of oxygen increases. Figures 2(a) and 2(b) show the steady-state cell and oxygen concentration profiles, respectively, at the uniform stage, and figures 2(c) and 2(d) show the profiles at the top of the shallow chamber, where the cell concentration starts getting denser (i.e. at the top boundary). Cell mobility in the present study is comparatively rapid but in a less non-scattered manner compared with that in the study by Hillesdon & Pedley (Reference Hillesdon and Pedley1996). In fact, the cell concentration profile is found to be quite close to the oxygen distribution profile. It should be noted that the impact of the surface tension will be seen in the perturbed cell and oxygen concentration profiles in the linear stability analysis since the surface tension is non-zero at the free surface.
Steady-state cell and oxygen concentration profiles of Hillesdon & Pedley (Reference Hillesdon and Pedley1996) are plotted to make a comparison with those of the present study. The parameter values of  $\gamma _\textrm {HP}\sim {{S_\tau }}=1$ and
 $\beta _\textrm {HP}\sim {{H_\tau }}=0.8$ in (a,b); and
 $\gamma _\textrm {HP}\sim {{S_\tau }}=5$ and
 $\beta _\textrm {HP}\sim {{H_\tau }}=60$ in (c,d), are taken into account.

In § 2, we have mentioned that the five dimensionless parameters  ${{Le_\tau }}$,
 ${{H_\tau }}$,
 ${{S_\tau }}$,
 ${{Pr_\tau }}$ and
 ${{Ra_\tau }}$ are slightly different from those Hillesdon & Pedley (Reference Hillesdon and Pedley1996) referred to. A few estimated parametric values from the linear stability analysis conducted in the present study are compared with the published results of Hillesdon & Pedley (Reference Hillesdon and Pedley1996) in table 1. The differences are apparent because the present study involves the values of
 ${{Fr_\tau }}$ and
 ${{Ca_\tau }}$. Among the ten sets of results, only six have been compared with the results of Hillesdon & Pedley (Reference Hillesdon and Pedley1996), which can be seen in table 1; the neutral stability curves
 ${{Ra_\tau }}(k)$ are plotted in figure 4 and figure 7 shows the variation of other parameters. The estimated results of
 ${{Ra_\tau }}_c$ and the corresponding values of
 $k_c$ vs
 ${{S_\tau }}{{H_\tau }}$ with the varying values of other parameters are visualized in figure 3. Some interesting points can be observed in these computed results of
 ${{Ra_\tau }}_c$ and
 $k_c$. Firstly, we can see in figure 7(c) that the neutral curves for the different values of
 ${{Le_\tau }}$ (fixed
 ${{S_\tau }}{{H_\tau }}=1$) diverge initially and then gradually converge as the wavenumber increases. Conversely, in the study by Hillesdon & Pedley (Reference Hillesdon and Pedley1996), neutral curves diverged for different values of
 $\delta _{HP}$ as the wavenumber increased (see figure 5 in Hillesdon & Pedley Reference Hillesdon and Pedley1996). Secondly, the computed value of
 ${{Ra_\tau }}$ for a given
 $k$ is larger for
 ${{Le_\tau }}=10$ than for
 ${{Le_\tau }}=1$, i.e. as
 ${{Le_\tau }}$ increases, the system stabilizes. The same trend can be seen in the work of Hillesdon & Pedley (Reference Hillesdon and Pedley1996). Interestingly, the computed values of
 ${{Ra_\tau }}_c$ and
 $k_c$ for the present study in case sets 2 and 8 are the same. The interpretation of these results is not straightforward. The increment in the value of
 ${{Le_\tau }}$ can be expressed either as an increase in
 $D_O$ with fixed
 $D_b$ or as a decrease in
 $D_b$ with fixed
 $D_O$, and the decreasing value of
 ${{Le_\tau }}$ can be expressed vice versa. A difference can be seen between the present study and that of Hillesdon & Pedley (Reference Hillesdon and Pedley1996) for the case sets in table 1 and figure 4. In our study, the neutral stability curve for
 ${{Le_\tau }}=1$,
 ${{S_\tau }}=1$ and
 ${{H_\tau }}=1$ slowly diverges initially and then gradually stabilizes as
 $k$ increases, whereas for Hillesdon & Pedley (Reference Hillesdon and Pedley1996), it diverged for any given
 $k$.
(a) Critical values of Rayleigh number,  ${{Ra_\tau }}_c$, and (b) the corresponding values of the critical wavenumber are computed for varying
 ${{Le_\tau }}$; (c) the variation of
 $\varepsilon$ and (d) Froude numbers
 ${{Fr_\tau }}$ are shown for fixed values of
 ${{Le_\tau }}=1$ and
 ${{Pr_\tau }}=7700$. The minimum value in the curve is
 ${{{S_\tau }}{{H_\tau }}}/{{{Le_\tau }}}\approx 1.936$.

Comparison of the neutral stability curve of the present study (a) with the result of Hillesdon & Pedley (Reference Hillesdon and Pedley1996) (b) for shallow chamber.

The estimated values of  ${{Ra_\tau }}_c$ and
 $k_c$ for the shallow chamber case are presented where -HP and -Present represent the values of Hillesdon & Pedley (Reference Hillesdon and Pedley1996) and the present work, respectively.

It can be visualized from the table 1 that, with the increasing value of  ${{Le_\tau }}$, a plane free surface density gradient occurs for larger values of
 ${{S_\tau }}{{H_\tau }}$. However, the value of
 ${{Ra_\tau }}_c$ first drops as
 ${{S_\tau }}{{H_\tau }}$ is increased and then rises again. Besides,
 $k_c$ has a maximum value, although the minimum values of
 $k_c$ and
 ${{Ra_\tau }}_c$ are not obtained at the same value as
 ${{S_\tau }}{{H_\tau }}$. This behaviour is exhibited in figures 3(a) and 3(b), which show the critical Rayleigh number,
 ${{Ra_\tau }}_c$, and the corresponding value of
 $k_c$ being plotted against
 ${{S_\tau }}{{H_\tau }}$ for varying values of
 ${{Le_\tau }}$. From the figure, we can see that, for each value of
 ${{Le_\tau }}$, the minimum value of
 ${{Ra_\tau }}_c$ is found when
 ${{S_\tau }}{{H_\tau }}/{{Le_\tau }}\approx 1.936$. From this detection, it is now clear that
 ${{Ra_\tau }}$ might not be suitable for measuring the ratio between the buoyancy force that leads to bioconvection and the viscous force that intercepts it.
The frequency of oscillation vs  ${{S_\tau }}{{H_\tau }}$ is plotted with the variation of
 ${{Le_\tau }}$ in figure 8(a). It can be observed from the figure that the growth rate is not affected by the variation of
 ${{Le_\tau }}$. However, in the growth rate, the curve shift towards higher
 ${{S_\tau }}{{H_\tau }}$ becomes noticeable as the value of the Lewis number increases. This behavioural change is due to the increasing value of
 ${{Le_\tau }}$. Hence, the cell diffusivity is extremely less than oxygen, i.e. a smaller cell concentration at the interface leads to greater discontinuity (the system becomes unstable). Besides, the presence of
 ${{Fr_\tau }}$ aids in increasing the cell concentration with increasing
 ${{Le_\tau }}$.
The characteristics of the perturbed cell and oxygen concentrations and velocity profiles are illustrated in figures 10(a), 11(a) and 12(a), respectively, corresponding to the values of  ${{Ra_\tau }}_c$ and
 $k_c$ for a shallow chamber with the variation of
 ${{Le_\tau }}$. It is clear from figure 10(a) that, as the value of
 ${{Le_\tau }}$ increases, the concentration of cells decreases at the air–water interface, and their movement towards the free surface is steady. With decreasing
 ${{Le_\tau }}$, the cells get denser, and the cells’ movement towards the free surface is more rapid. The aggregation of cells is mostly found just below the layer of free surface. This result justifies that, when the oxygen diffusion is higher, then the cell diffusivity is small or constant, and so are the critical values of
 ${{Ra_\tau }}_c$ and
 $k_c$, which start to fall with the increase of
 ${{Le_\tau }}$. As
 ${{Le_\tau }}$ increases, the diffusivity of oxygen also increases, and this statement is supported by the oxygen concentration profiles presented in figure 11(a) for the variation of
 ${{Le_\tau }}=0.5, 1, 5$. Figure 12(a) shows the characteristics of the perturbed fluid velocity profiles for a shallow chamber corresponding to the values of
 ${{Ra_\tau }}_c$ and
 $k_c$. The intensity of the wave profile for
 ${{Le_\tau }}=0.5$ is much higher than that for the case with the increasing value of
 ${{Le_\tau }}$. Eventually, an increase in the diffusivity of oxygen makes the system unstable, and vice versa, as
 ${{Le_\tau }}$ decreases. The flow motion in the chemotaxis system is interrupted at the onset of convection, however, it stabilizes after reaching the free surface.
Thus far, the results have been compared when there is variation in  ${{Le_\tau }}$ and the other physical parameters are fixed at
 $\varepsilon =0.1$,
 ${{S_\tau }}{{H_\tau }}=1$,
 ${{Pr_\tau }}=7700$,
 ${{Fr_\tau }}=0.001$ and
 ${{Ca_\tau }}=0.01$. In the next stage, the impact of the Froude number is discussed by varying the
 ${{Fr_\tau }}$ values to
 $0.001, 0.003$ and
 $0.006$ and fixing the other parameters at
 ${{Le_\tau }}=1$,
 $\varepsilon =0.1$,
 ${{S_\tau }}{{H_\tau }}=1$,
 ${{Pr_\tau }}=7700$ and
 ${{Ca_\tau }}=0.01$. It is noteworthy that the results of figures 10, 11 and 12, are plotted from the eigenvalue problem.
4.2. Vary ${{Fr_\tau }}$; other parameters are fixed

The values of  ${{Ra_\tau }}_c$ and
 $k_c$ have been computed by varying the Froude number and presented in table 1. It can be observed from the parameter sets two, nine and ten that for
 ${{Fr_\tau }}=0.001$,
 $0.003$ and
 $0.006$, the computed
 ${{Ra_\tau }}_c$ values are
 $811.183$,
 $1028.42$ and
 $1761.58$, respectively, whereas
 $k_c$ gives the same value of
 $34.4$ for different
 ${{Fr_\tau }}$ (here,
 ${{S_\tau }}{{H_\tau }}=1$ and
 ${{Le_\tau }}=1$). This situation is also illustrated in figure 3(d), where
 $k_c$ vs
 ${{S_\tau }}{{H_\tau }}$ is plotted for the varying values of
 ${{Fr_\tau }}$. Notably, under the variation of
 ${{Fr_\tau }}$,
 $k_c$ shows the same critical value at the minimum value of
 ${{S_\tau }}{{H_\tau }}$. This implies that the wavenumber is not influenced by the change in
 ${{S_\tau }}{{H_\tau }}$ though the initial jump found is due to the change in
 ${{Fr_\tau }}$. As the value of the Froude number increases, the wavenumber reaches its maximum value in the uniform stage of the system. Otherwise, the wavenumber is constant throughout the system. In figure 7(d), neutral stability curves are shown under the variation of
 ${{Fr_\tau }}$. Due to the presence of
 ${{Fr_\tau }}$, the flow at the free surface accelerates under the action of gravity. As the value of
 ${{Fr_\tau }}$ increases, the flow accelerates even further for
 ${{Fr_\tau }}=0.006$ compared with those at other values of Froude number. Therefore, initially, the system seems to be destabilized, however, it stabilizes as the wavenumber increases. However, if we look at the result of the oscillation of frequency curves in figure 8(c), it shows a minute deflation in the growth rate as
 ${{Fr_\tau }}$ increases. However, quite a big shift is noticed in the growth rate. The frequency of oscillations vs
 ${{S_\tau }}{{H_\tau }}$ is illustrated in figure 8(c) for the variation of
 ${{Fr_\tau }}$. In other words, a decrease in the frequency of oscillations causes the system to become stabilized.
The real parts of the perturbed cell and oxygen concentrations and velocity profiles are plotted by varying  ${{Fr_\tau }}=0.001$,
 $0.003,$ and
 $0.006$ in figures 10(f), 11(f) and 12(e), respectively, corresponding to the values of
 ${{Ra_\tau }}_c$ and
 $k_c$. Both the cell and oxygen concentration profiles show a subtle effect on the upper surface rather than the bottom surface of the chemotaxis system. Although the differences are very small, the cell concentration profile decreases as
 ${{Fr_\tau }}$ increases with a steady motion and gradually reaches towards the free surface. The same situation is also seen for the perturbed oxygen concentration profiles. The significant effect of
 ${{Fr_\tau }}$ is visible at the perturbed fluid velocity profiles, where on increasing the value of
 ${{Fr_\tau }}$, the velocity of the fluid becomes steady at the free surface. It stabilizes the motion of the fluid close to the free surface, where the concentrations of both cells and oxygen are balanced. Whereas the comparison between the profiles of
 $N_r$,
 $C_r$ and
 $W_r$ slightly differs for the higher value of
 ${{Fr_\tau }}$.
4.3. Vary ${{Ca_\tau }}$; other parameters are fixed

The frequency of oscillations vs  ${{S_\tau }}{{H_\tau }}$ is illustrated in figure 8(b) for the variation of
 ${{Ca_\tau }}$. The increasing value of
 ${{Ca_\tau }}$ shows an inflation in the growth rate along with a small shift, leading the system to be stable. The curves widen due to the increasing value of
 ${{S_\tau }}{{H_\tau }}$ as
 ${{Ca_\tau }}$ increases, and the peak value falls, giving stability to the system at the free surface in the shallow chamber case. The frequency of oscillation,
 $\omega$, vs
 $k$ is plotted in figure 9(b) for the variation of
 ${{Ca_\tau }}$. The same scenario can be seen here for the frequency of oscillations where the curves get wider and the peaks rise with the increasing wavenumber, however, this occurs for the decreasing value of
 ${{Ca_\tau }}$. A slight tilt in the front of the curves can be seen for the decreasing value of
 ${{Ca_\tau }}$. This explains that the surface tension is tenacious enough to hold the exalted wave profile.
The real parts of the perturbed cell and oxygen concentrations, and velocity profiles are plotted by varying  ${{Ca_\tau }}=0.005$,
 $0.01,$ and
 $0.05$ in figures 10(e), 11(e) and 12(d), respectively, which are corresponding to the values of
 ${{Ra_\tau }}_c$ and
 $k_c$. A similar scenario can be seen in figures 10(f) and 11(f) for the variation of
 ${{Fr_\tau }}$. Note that in figures 10(e) and 11(e) we mentioned the perturbed cell and oxygen concentrations for varying values of
 ${{Ca_\tau }}$. Figure 12(d) shows the different characteristics of the perturbed fluid velocity profile
 $W_r$ in a shallow chamber with the variation of
 ${{Ca_\tau }}$. It is clear from the figure that the velocity profile
 $W_r$ increases with an increasing value of
 ${{Ca_\tau }}$. The comparison between the profiles of
 $W_r$ (the perturbed fluid velocity),
 $N_r$ (the perturbed cell concentration) and
 $C_r$ (the perturbed oxygen concentration) detects a random movement of cells in the system as lack in oxygen makes the system unstable. The chemotaxis system stabilizes as the surface tension increases at the free surface. However, at the onset of convection, the system shows a destabilizing effect. The concentrations of cells and oxygen increase near the free surface, and almost all cells are accumulated near the stable free surface.
4.4. Vary ${{S_\tau }}{{H_\tau }}$; other parameters are fixed

In table 1, the estimated values of  ${{Ra_\tau }}_c$ and
 $k_c$ for shallow chamber are given for the variation of
 ${{S_\tau }}{{H_\tau }}$ and
 ${{Le_\tau }}$. These values of
 ${{Ra_\tau }}_c$ and
 $k_c$ are compared with those of Hillesdon & Pedley (Reference Hillesdon and Pedley1996) though the comparison by varying
 ${{Le_\tau }}$ has been discussed in the previous section. In linear stability analysis, we have fixed the value of
 ${{Le_\tau }}$, and independently varied the values of
 ${{S_\tau }}$ and
 ${{H_\tau }}$. These variations can be seen in figures 5 and 6 are discussed in detail later in this section. In table 1, data sets 1–7, we have fixed the values of
 ${{Le_\tau }}=1$ and
 ${{S_\tau }}=1$, and varied
 ${{H_\tau }}$ from
 $0.05$ to
 $100$. It can be observed that, in the uniform stage of the system (
 ${{H_\tau }}=0.05$), the critical Rayleigh number is estimated to take the highest value and similarly for the critical wavenumber. It can be seen that, as the value of
 ${{H_\tau }}$ increases, the value of the critical Rayleigh number drops. The minimum value of the critical Rayleigh number is found when
 ${{H_\tau }}=10$. Then, the value of critical Rayleigh number starts to rise again as the value of
 ${{H_\tau }}$ starts increasing. When
 $k\to 0$, the analytical approximation is
 ${{Ra_\tau }}\to {1440{{Le_\tau }}}/{7{{S_\tau }}{{H_\tau }}}=4114.29$. The critical values of the Rayleigh number and wavenumber are
 ${{Ra_\tau }}_c=15234.24$ and
 $k_c=154.4$. It can be anticipated that our numerically predicted first pattern would be experimentally seen when
 ${{Ra_\tau }}$ is slowly reduced to
 ${{Ra_\tau }}_c$. In general, the most unstable disturbance occurred for
 ${{Ra_\tau }}>{{Ra_\tau }}_c$, which has a different wavelength. The approximate value of a dimensionless wavelength
 $\lambda _c=2{\rm \pi} /k_c$ can be calculated from the value of the critical wavenumber
 $k_c$. It would be interesting to conduct an experiment using the present model to verify these estimated results and predictions.
(a) The curves  ${{Ra_\tau }}$ and (b)
 $\omega _i$ corresponding to varying values of
 ${{S_\tau }}$ at fixed values of
 ${{Le_\tau }}=1$,
 $\varepsilon =0.1$,
 ${{H_\tau }}=10$,
 ${{Pr_\tau }}=7700$,
 ${{Fr_\tau }}=0.001$ and
 ${{Ca_\tau }}=0.01$.

The curves  ${{Ra_\tau }}$ and (b)
 $\omega _i$ corresponding to varying values of
 ${{H_\tau }}$ at fixed values of
 ${{Le_\tau }}=1$,
 $\varepsilon =0.1$,
 ${{S_\tau }}=5$,
 ${{Pr_\tau }}=7700$,
 ${{Fr_\tau }}=0.001$ and
 ${{Ca_\tau }}=0.01$.

In figures 5 and 6, the neutral stability and growth rate, respectively, are plotted with the variations of  ${{S_\tau }}$ and
 ${{H_\tau }}$ separately. In figure 5,
 ${{S_\tau }}$ is varied from
 $1$ to
 $5$, and
 ${{H_\tau }}$ is varied from
 $10$ to
 $50$ in figure 6. Interestingly, all the neutral stability curves in figures 5(a) and 6(a) for the variation of
 ${{S_\tau }}$ and
 ${{H_\tau }}$, respectively, intersect at a point when
 ${{Ra_\tau }}=205.71$. Further, all the curves of the growth rate in figures 5(b) and 6(b) for the variation of
 ${{S_\tau }}$ and
 ${{H_\tau }}$, respectively, have the cutoff wavenumber
 $k=12.8$. In figures 5(a) and 6(a), all the neutral stability curves for different values
 ${{S_\tau }}$ and
 ${{H_\tau }}$ converge as the wavenumber increases. In fact, the value of
 ${{Ra_\tau }}$, for a given
 $k$, is larger, for
 ${{S_\tau }}=5$ and
 ${{H_\tau }}=10$, than for the other lower varying values of
 ${{S_\tau }}$ and
 ${{H_\tau }}$. It is implied that an increase in the values of
 ${{S_\tau }}$ and
 ${{H_\tau }}$ is evidently stabilizing. The qualitative behaviour in each case is the same, as the wavenumber
 $k$ increases, the Rayleigh number
 ${{Ra_\tau }}$ decreases steadily to its minimum value. The variation in
 ${{H_\tau }}$ shows that the motion of fluid at the critical Rayleigh number consists of convective cells. Thus, the cells initiated in the upper unstable layer penetrate through the stable layer and reach towards the bottom layer. The convection starts in this situation, and soon, the whole chamber becomes involved in this motion. This initial motion, observed experimentally, has a wavenumber, and this wavenumber is presumed to be equal to the most unstable wavenumber corresponding to the value of
 ${{Ra_\tau }}$. Similarly, the growth rates in figures 5(b) and 6(b) show higher inflation for large values of
 ${{S_\tau }}$ and
 ${{H_\tau }}$, i.e. increase in
 ${{S_\tau }}$ and
 ${{H_\tau }}$ is apparently stabilizing. The growth rate corresponding to a particular wavenumber is greatest in
 ${{S_\tau }}=5$ and
 ${{H_\tau }}=50$, for
 $k>4$.
In figures 10(d) and 10(c), 11(d) and 11(c) and 12(c), the characteristics of the perturbed cell and oxygen concentrations, and the fluid velocity profiles, respectively, are presented with respect to the length of the shallow chamber corresponding to the values of  ${{Ra_\tau }}_c$ and
 $k_c$. In figures 10(d) and 10(c),
 ${{H_\tau }}$ is varied from
 $1$ to
 $5$, respectively, whereas
 ${{S_\tau }}$ is fixed at
 $1$. The concentration of cells for
 ${{H_\tau }}=1$ is less at the bottom of the chamber and increases near the free surface (see figure 10d). Moreover, in figure 10(c), the concentration of cells for
 ${{H_\tau }}=5$ is even lower than that for
 ${{H_\tau }}=1$, and, similarly, it increases near the free surface. In figures 10(d) and 10(c), the concentration of oxygen gradually increases for
 ${{H_\tau }}=1$ as moving towards the free surface. Moreover, as expected, the most apparent difference is seen in the
 $C_r$ distribution profile for
 ${{H_\tau }}=5$. Although, both cell and oxygen zero-flux conditions are satisfied at
 $z=0$. The distribution of
 $C$ is mostly interrupted within the system due to the excessive consumption of the oxygen. The fluid velocity profile
 $W_r$ increases with the increasing value of
 ${{H_\tau }}$ (see in figure 12c). The difference in the velocity profiles becomes more noticeable as the value of
 ${{H_\tau }}$ increases.
4.5. Variation of $\varepsilon$ and ${{Pr_\tau }}$


The length of the shallow chamber has also been varied to investigate the nature of the stability and the impact of  $\varepsilon$ on the present system. The variation of
 $\varepsilon$ presented in table 1 shows that the estimated values of
 ${{Ra_\tau }}_c$ remained unchanged for different
 $\varepsilon$ although the estimated values of
 $k_c$ increased with decreasing
 $\varepsilon$. It can be said that the number of waves increases as the length of the chamber increases. These results are illustrated in figure 3(c) where one can clearly visualize that the critical wavenumber increases with the decreasing value of
 $\varepsilon$ and is not influenced by the change in
 ${{S_\tau }}{{H_\tau }}$. This statement can also be verified through figure 7(b), in which the neutral stability curves show a stabilizing effect in the increasing cutoff wavenumber when the length of the chamber increases although
 ${{Ra_\tau }}$ is not influenced by the change. The impact of the chamber length can also be seen in the frequency of oscillations, where the growth rate is illustrated against the wavenumber in figure 9(a).
Neutral stability curves presented with the variation of  ${{H_\tau }}, {{S_\tau }}$ in (a) (fixed
 ${{Le_\tau }}=1$,
 $\varepsilon =0.1$,
 ${{Pr_\tau }}=7700$,
 ${{Ca_\tau }}=0.01$,
 ${{Fr_\tau }}=0.001$),
 $\varepsilon$ in (b) (fixed
 ${{Le_\tau }}=1$,
 ${{S_\tau }},{{H_\tau }}=1$,
 ${{Pr_\tau }}=7700$,
 ${{Ca_\tau }}=0.01$,
 ${{Fr_\tau }}=0.001$),
 ${{Le_\tau }}$ in (c) (fixed
 $\varepsilon =0.1$,
 ${{S_\tau }},{{H_\tau }}=1$,
 ${{Pr_\tau }}=7700$,
 ${{Ca_\tau }}=0.01$,
 ${{Fr_\tau }}=0.001$),
 ${{Fr_\tau }}$ in (d) (fixed
 ${{Le_\tau }}=1$,
 $\varepsilon =0.1$,
 ${{S_\tau }},{{H_\tau }}=1$,
 ${{Pr_\tau }}=7700$,
 ${{Ca_\tau }}=0.01$) and
 ${{Pr_\tau }}$ in (e) (fixed
 ${{Le_\tau }}=1$,
 $\varepsilon =0.1$,
 ${{S_\tau }},{{H_\tau }}=1$,
 ${{Ca_\tau }}=0.01$,
 ${{Fr_\tau }}=0.001$).

The curves of  $\omega$ are presented at the critical
 ${{Ra_\tau }}$ with the variation of
 ${{Le_\tau }}$ in (a) (fixed
 ${{Ca_\tau }}=0.01$,
 ${{Fr_\tau }}=0.001$),
 ${{Ca_\tau }}$ in (fixed
 ${{Le_\tau }}=1$,
 ${{Fr_\tau }}=0.001$) (b) and
 ${{Fr_\tau }}$ in (fixed
 ${{Le_\tau }}=1$,
 ${{Ca_\tau }}=0.01$) (c).

The curves of  $\omega$ are presented at the critical
 ${{Ra_\tau }}$ with the variation of
 $\varepsilon$ in (a) (fixed
 ${{Ca_\tau }}=0.01$) and
 ${{Ca_\tau }}$ in (b) (fixed
 $\varepsilon =0.1$). Other parameters are fixed at
 ${{Le_\tau }}=1$,
 ${{S_\tau }}=1$,
 ${{H_\tau }}=1$,
 ${{Fr_\tau }}=0.001$ and
 ${{Pr_\tau }}=7700$.

In figures 10(b), 11(b) and 12(b), the characteristics of the perturbed cell and oxygen concentrations, and fluid velocity profiles, respectively, are presented with the variation in the length of the shallow chamber corresponding to the values of  ${{Ra_\tau }}_c$ and
 $k_c$. It can be observed in figure 10(b) that the cell concentrations at the free surface for a small chamber are lower than in the long chamber in comparison with those at the bottom of the shallow chamber. Therefore, it can be stated that the cell concentration will increase with an increasing length of the chamber. However, the oxygen concentration profiles in figure 11(b) show that the oxygen concentration level will be identical at the free surface for differently sized chambers although at the bottom of the chamber, the oxygen concentration level will increase/decrease as the length of the chamber decreases/increases. Figure 12(b) shows that the variation in the length of the chamber has a significant impact on the velocity of the wave profiles. As the length of the chamber increases, we can observe steady velocity profiles, whereas the velocity of the wave profile increases as the length of the chamber decreases.
Different characteristics of the perturbed cell concentration profiles  $N_r$ are presented corresponding to the values of
 ${{Ra_\tau }}_c$ and
 $k_c$ for shallow chamber with the variation of
 ${{Le_\tau }}$ in (a) (fixed
 $\varepsilon =0.1$,
 ${{S_\tau }}, {{H_\tau }}=1$,
 ${{Pr_\tau }}=7700$,
 ${{Ca_\tau }}=0.01$ and
 ${{Fr_\tau }}=0.001$);
 $\varepsilon$ in (b) (fixed
 ${{Le_\tau }}=1$,
 ${{S_\tau }},{{H_\tau }}=1$,
 ${{Pr_\tau }}=7700$,
 ${{Ca_\tau }}=0.01$ and
 ${{Fr_\tau }}=0.001$);
 ${{Ca_\tau }}$ in (e) (fixed
 $\varepsilon =0.1$,
 ${{Le_\tau }}=1$,
 ${{S_\tau }},{{H_\tau }}=1$,
 ${{Pr_\tau }}=7700$ and
 ${{Fr_\tau }}=0.001$);
 ${{Fr_\tau }}$ in (f) (fixed
 $\varepsilon =0.1$,
 ${{Le_\tau }}=1$,
 ${{S_\tau }},{{H_\tau }}=1$,
 ${{Pr_\tau }}=7700$ and
 ${{Ca_\tau }}=0.01$). Panels (c,d) show the profiles for
 ${{S_\tau }},{{H_\tau }}=1$ and
 ${{S_\tau }},{{H_\tau }}=5$ and other parameters are fixed at
 $\varepsilon =0.1$,
 ${{Le_\tau }}=1$,
 ${{Pr_\tau }}=7700$,
 ${{Ca_\tau }}=0.01$ and
 ${{Fr_\tau }}=0.001$.

Different characteristics of the perturbed oxygen concentration profiles  $C_r$ are presented corresponding to the values of
 ${{Ra_\tau }}_c$ and
 $k_c$ for shallow chamber with the variation of
 ${{Le_\tau }}$ in (a) (fixed
 $\varepsilon =0.1$,
 ${{S_\tau }},{{H_\tau }}=1$,
 ${{Pr_\tau }}=7700$,
 ${{Ca_\tau }}=0.01$ and
 ${{Fr_\tau }}=0.001$);
 $\varepsilon$ in (b) (fixed
 ${{Le_\tau }}=1$,
 ${{S_\tau }},{{H_\tau }}=1$,
 ${{Pr_\tau }}=7700$,
 ${{Ca_\tau }}=0.01$ and
 ${{Fr_\tau }}=0.001$);
 ${{Ca_\tau }}$ in (e) (fixed
 $\varepsilon =0.1$,
 ${{Le_\tau }}=1$,
 ${{S_\tau }},{{H_\tau }}=1$,
 ${{Pr_\tau }}=7700$ and
 ${{Fr_\tau }}=0.001$);
 ${{Fr_\tau }}$ in (f) (fixed
 $\varepsilon =0.1$,
 ${{Le_\tau }}=1$,
 ${{S_\tau }},{{H_\tau }}=1$,
 ${{Pr_\tau }}=7700$ and
 ${{Ca_\tau }}=0.01$). Panels (c,d) show the profiles for
 ${{S_\tau }},{{H_\tau }}=1$ and
 ${{S_\tau }},{{H_\tau }}=5$ and other parameters are fixed at
 $\varepsilon =0.1$,
 ${{Le_\tau }}=1$,
 ${{Pr_\tau }}=7700$,
 ${{Ca_\tau }}=0.01$ and
 ${{Fr_\tau }}=0.001$.

Different characteristics of the perturbed fluid velocity profiles  $W_r$ are presented corresponding to the values of
 ${{Ra_\tau }}_c$ and
 $k_c$ for shallow chamber with the variation of
 ${{Le_\tau }}$ in (a) (fixed
 $\varepsilon =0.1$,
 ${{S_\tau }}, {{H_\tau }}=1$,
 ${{Pr_\tau }}=7700$,
 ${{Ca_\tau }}=0.01$ and
 ${{Fr_\tau }}=0.001$);
 $\varepsilon$ in (b) (fixed
 ${{Le_\tau }}=1$,
 ${{S_\tau }},{{H_\tau }}=1$,
 ${{Pr_\tau }}=7700$,
 ${{Ca_\tau }}=0.01$ and
 ${{Fr_\tau }}=0.001$);
 ${{S_\tau }},{{H_\tau }}$ in (c) (fixed
 $\varepsilon =0.1$,
 ${{Le_\tau }}=1$,
 ${{Pr_\tau }}=7700$,
 ${{Ca_\tau }}=0.01$ and
 ${{Fr_\tau }}=0.001$);
 ${{Ca_\tau }}$ in (d) (fixed
 $\varepsilon =0.1$,
 ${{Le_\tau }}=1$,
 ${{S_\tau }},{{H_\tau }}=1$,
 ${{Pr_\tau }}=7700$ and
 ${{Fr_\tau }}=0.001$);
 ${{Fr_\tau }}$ in (e) (fixed
 $\varepsilon =0.1$,
 ${{Le_\tau }}=1$,
 ${{S_\tau }},{{H_\tau }}=1$,
 ${{Pr_\tau }}=7700$ and
 ${{Ca_\tau }}=0.01$).

We have varied  ${{Pr_\tau }}$ from
 $500\sim 7700$ to investigate the impact of the Prandtl number on the chemotaxis system, and this is shown in figure 7(e). It can be observed from the figure that the trend of the curves is similar for the variation of
 ${{Pr_\tau }}$. As
 ${{Pr_\tau }}$ increases, the value of
 ${{Ra_\tau }}$ increases along with the value of wavenumber. Here,
 ${{Pr_\tau }}$ is defined as the ratio of the fluid diffusivity to cell diffusivity, and the values are varied for
 $500\leqslant {{Pr_\tau }}\leqslant 7700$, i.e. the viscosity of the fluid is higher than the cell diffusivity, and this brings instability to the chemotaxis system. Since all the curves show a similar nature in the figure, so the highest value of
 ${{Pr_\tau }}({=}7700)$ is considered for the parametric study.
Since  ${{Fr_\tau }}$ and
 ${{Ca_\tau }}$ are two important physical parameters in this system, we have varied both the parameters together as well as the other parameters such as
 ${{Le_\tau }}$ and
 $\varepsilon$ to study their influence on the stability of the chemotaxis system. The frequency of oscillations,
 $\omega$, vs
 ${{Fr_\tau }}$ and
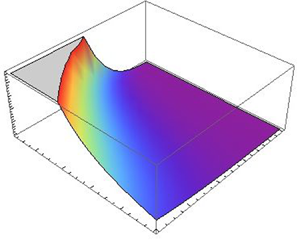
 ${{Ca_\tau }}$ is plotted in figure 13. The figure shows that the peak of the frequency of the oscillation curve increases with a decreasing value of
 ${{Ca_\tau }}$, and the increase in the peak of the curve is also influenced by an increasing value of
 ${{Fr_\tau }}$. The curve exponentially increases with the increasing value of
 ${{Fr_\tau }}$. Based on the results in the figure, we can say that the surface tension force is strong enough to hold the peak of the wave, although increasing the value of
 ${{Fr_\tau }}$ enables the curve to take its peak value. Then, at a much lower value of
 ${{Ca_\tau }}$ and higher value of
 ${{Fr_\tau }}$, the frequency of the oscillation curve converges indicating the stabilization of the chemotaxis system.
Frequency of oscillation,  $\omega$, is plotted for the variations of
 ${{Ca_\tau }}$ and
 ${{Fr_\tau }}$ corresponding to the values of
 ${{Ra_\tau }}_c$ and
 $k_c$ for shallow chamber, and other parameters are fixed at
 $\varepsilon =0.1$,
 ${{Le_\tau }}=1$,
 ${{S_\tau }}=1$,
 ${{H_\tau }}=10$ and
 ${{Pr_\tau }}=7700$.

The critical Rayleigh number,  ${{Ra_\tau }}_c$, vs
 ${{Le_\tau }}$ and
 ${{Fr_\tau }}$ is plotted in figure 14(a), and in figure 14(b), plotted against
 $\varepsilon$ and
 ${{Fr_\tau }}$. It can be seen in figure 14(a) that the value of
 ${{Ra_\tau }}$ drops initially when the value of
 ${{Le_\tau }}$ is smaller, however, then it diverges as the value of
 ${{Le_\tau }}$ increases. Here, it is worth mentioning that
 ${{Ra_\tau }}_c$ also depends on the parameters
 ${{S_\tau }}$ and
 ${{H_\tau }}$. The values of
 ${{S_\tau }}$ and
 ${{H_\tau }}$ are fixed to one here. Moreover, we have already seen in figure 3(a) how the neutral stability curve initially diverges at a small value of
 ${{S_\tau }}{{H_\tau }}$ for the lower value of
 ${{Le_\tau }}$ although, with an increasing value of
 ${{Fr_\tau }}$, the neutral stability curve exponentially increases, showing the destabilizing nature of the system. However, after reaching a certain value of
 ${{Fr_\tau }}$, the neutral stability curve converges. This effectively explains that the presence of
 ${{Fr_\tau }}$ in the system accelerates the fluid motions, however, an increase/decrease in the diffusivities of oxygen and cells would not affect the fluid motion. The fluid motion is affected due to the change in
 ${{Fr_\tau }}$ and
 ${{S_\tau }}{{H_\tau }}$. For the variations in
 ${{Fr_\tau }}$, the impact on the neutral stability curve can easily be seen in figure 14(b). Although change in the value of
 $\varepsilon$ does not have any impact on
 ${{Ra_\tau }}_c$, the fluid motion is influenced due to the change in the length of the shallow chamber. It has been seen that the fluid accelerates even faster as the length of the chamber decreases. The number of waves that will occur in the system depends on the value of
 $\varepsilon$, as
 $\varepsilon$ increases/decreases, the number of waves decreases/increases.
Critical Rayleigh number,  ${{Ra_\tau }}_c$, is plotted for the variations of
 ${{Le_\tau }}$ and
 ${{Fr_\tau }}$ (
 $\varepsilon =0.1$ fixed) in (a), and for the variations of
 $\varepsilon$ and
 ${{Fr_\tau }}$ (
 ${{Le_\tau }}=1$) in (b). Other parameters are fixed at
 ${{S_\tau }}=1$,
 ${{H_\tau }}=1$,
 ${{Ca_\tau }}=0.01$ and
 ${{Pr_\tau }}=7700$.

5. Conclusions
A three-dimensional model of the chemotaxis–convection–diffusion coupling system with the effect of surface tension at the air–water interface is considered. The impact of the surface tension on bioconvection, and vice versa, is the novelty of the present work, and it has been studied in detail. Both the surface tension phenomenon and cell dynamics at the free surface have been considered by incorporating them into the present model.
A parametric study of the chemotaxis–convection–diffusion system with deformed free surface with the effect of surface tension is performed. The parameters  ${{Le_\tau }}$,
 ${{S_\tau }}{{H_\tau }}$,
 ${{Pr_\tau }}$,
 $\varepsilon$,
 ${{Fr_\tau }}$ and
 ${{Ca_\tau }}$ are varied and compared with the results of Hillesdon & Pedley (Reference Hillesdon and Pedley1996) for the flat free surface. The results of neutral stability curves showed that our system slowly starts to diverge initially, however, it stabilizes the system as
 $k$ increases where the neutral stability curves always diverge for variation of parameter values in Hillesdon & Pedley (Reference Hillesdon and Pedley1996) study. As the value of
 ${{Fr_\tau }}$ increases, the value of the critical
 ${{Ra_\tau }}$ number increases, and this accelerates the free surface instability, although the wavenumber is not affected due to the increment in
 ${{Fr_\tau }}$. The value of
 ${{Ra_\tau }}$ is independent of
 ${{Ca_\tau }}$, but the flow velocity profile is influenced by the variation of
 ${{Ca_\tau }}$. On variations in
 ${{Ca_\tau }}$ and
 ${{Fr_\tau }}$, the cell and oxygen concentration profiles, respectively, show very small changes. Moreover, initially, the cells move towards the free surface (higher concentration of oxygen) and such a movement is not affected in the presence of the Froude number and surface tension. Later on, the cells are influenced and accelerated, and they accumulate near the trough of the waves. The variation in
 $\varepsilon$ shows that the wavenumber increases as the length of the chamber increases. The frequency of oscillations is also increased with the increasing wavenumber as the length of the chamber increases. Increase in the value of
 ${{Le_\tau }}$ and independent variation of
 ${{S_\tau }}$ and
 ${{H_\tau }}$ evidently stabilizes the system.
Linear stability analysis provides useful results on qualitative perspective of the unstable behaviour of the cell distribution at the onset of bioconvection, but it cannot explicate the initial stage of the formation of bioconvection patterns. Therefore, we expanded our study to perform weakly nonlinear stability analysis. It is observed in the linear stability analysis that the angular frequency or growth rate shows stability in the nature of the chemotaxis system at higher order. For this reason, we restrict the expansion of physical variables for the weakly nonlinear stability analysis up to the third order only. The parameter  ${{Ra_\tau }}$ is the nonlinear controlled parameter of the chemotaxis system. In the near future, we will provide a complete weakly nonlinear stability analysis that will aid us in determining the nonlinear dynamics of the chemotaxis phenomenon and the stability of the formation of patterns at the onset of bioconvection on the free surface under the influence of surface tension. Also, we will provide the bifurcation theory results and compare them with the numerical simulation results. Due to the lack of experimental evidence for the present bioconvection model, it would be difficult to compare the results for validation.
Supplementary material
Supplementary material is available at https://doi.org/10.1017/jfm.2021.508.
Funding
The authors would like to express their heartfelt gratitude to Professor G. Biswas, IIT Kanpur, for his valuable suggestions, and to the Ministry of Science and Technology (MOST), Taipei, Taiwan (grant no. 108-2221-E-002-059) for its financial support.
Declaration of interests
The authors report no conflict of interest.
Appendix A. Solutions of $N$, $\bar {C}$ and $W$ at $O({{S_\tau }}{{H_\tau }}/{{Le_\tau }})$, ${O({{S_\tau }}{{H_\tau }}/{{Le_\tau }})}^{2}$ and ${O({{S_\tau }}{{H_\tau }}/{{Le_\tau }})}^{3}$


The solutions of  $N_1$,
 $\bar {C}_1$ and
 $W_1$ at the first order
 $O({{S_\tau }}{{H_\tau }}/{{Le_\tau }})$ are
 \begin{align} W_1(z)
&={-}\frac{\tilde{k}^{2}
z^{2}\varepsilon{{Ra_\tau}}_{{-}1}}{6s!2{{Pr_\tau}}}[{-}240\tilde{k}^{2}\varepsilon^{2}{{Fr_\tau}}^{2}{{Pr_\tau}}^{2}
+ 2(z - 1){{Pr_\tau}}(2z^{3}(\tilde{k}^{2}\varepsilon^{2} + 1) + z^{2}(2 - 10\tilde{k}^{2}
\varepsilon^{2})\nonumber\\ &\quad +
z(5\tilde{k}^{2}\varepsilon^{2} + 32) +
35\tilde{k}^{2}\varepsilon^{2} - 128) + \tilde{k}^{2}\varepsilon^{2}({-}2z^{4} + 12z^{3}
- 15z^{2} - 20z + 25)]\nonumber\\
&\quad + \frac{\tilde{k}^{4} z^{2}\varepsilon^{3}
({{Ra_\tau}}_{{-}1})^{2}}{11!4{{Pr_\tau}}}[{-}5!1078{{Fr_\tau}}^{2}{{Pr_\tau}}^{2}
+ 2(10z^{9} - 88z^{8} + 165z^{7} - 539z^{4} +
2475z^{2}\nonumber\\ &\quad - 4070z +
2047){{Pr_\tau}} - 539(2z^{4} - 12z^{3} +
15z^{2} + 20z - 25)]\nonumber\\ &\quad -
\frac{1}{24}\tilde{k}^{2}(z - 3)(z -
1)z^{2}\varepsilon{{Ra_\tau}}_0,
\end{align}
 \begin{align} \bar{C}_1(z) &=
\frac{\tilde{k}^{2}\varepsilon^{2}{{Ra_\tau}}_{{-}1}}{9!2}[{-}10z^{9}
+ 72z^{8} - 108z^{7} + 147z^{4} - 270z^{2} +
169]\nonumber\\ &\quad + \frac{1}{24}(z^{2} -
1)[z^{2}(\tilde{k}^{2}\varepsilon^{2} + 2) -
5\tilde{k}^{2}\varepsilon^{2} + 14],
\end{align}
 \begin{equation} N_1(z) = 1 + z^{2} -
\frac{\tilde{k}^{2}\varepsilon^{2}{{Ra_\tau}}_{{-}1}}{7!4}(20z^{7}
- 112z^{6} + 126z^{5} - 49z^{2} + 15).
\end{equation}
At the second order, the governing equations are
 \begin{align}
\frac{\textrm{d}^{4}W_2}{\textrm{d} z^{4}}
&={-}\tilde{k}^{2}\varepsilon(N_0{{Ra_\tau}}_1 -
N_1{{Ra_\tau}}_0 - N_2{{Ra_\tau}}_{{-}1}) -
\frac{\tilde{k}^{2}
\varepsilon^{3}}{{{Pr_\tau}}}(\tilde{k}^{2}\varepsilon{{Pr_\tau}}
+ \omega_1) W_0\nonumber\\ &\quad +
\frac{\varepsilon}{{{Pr_\tau}}}(2\tilde{k}^{2}\varepsilon{{Pr_\tau}}
+ \omega_1)\frac{\textrm{d}^{2}W_1}{\textrm{d} z^{2}}
+
\frac{\varepsilon\omega_2}{{{Pr_\tau}}}\frac{\textrm{d}^{2}W_0}{\textrm{d}
z^{2}}, \end{align}
 \begin{align} \frac{\textrm{d}^{2}
N_2}{\textrm{d} z^{2}} &= z\frac{\textrm{d}
\bar{C}_0}{\textrm{d} z} +
(\tilde{k}^{2}\varepsilon^{2} + \omega_1\varepsilon +
2)N_1 + \frac{1}{3}(3z^{2} +
3\omega_2\varepsilon - 1)N_0 + \frac{1}{6}z(z^{2} -
1)\frac{\textrm{d} N_0}{\textrm{d} z}\nonumber\\ &\quad +
z\frac{\textrm{d} N_1}{\textrm{d} z} - \frac{1}{3}z(1 -
2z^{2})\varepsilon W_0 + z\varepsilon W_1,
\end{align}
 \begin{equation} \frac{\textrm{d}^{2} \bar{C}_2}{\textrm{d} z^{2}} = \tilde{k}^{2} \varepsilon^{2} C_1 + N_2, \end{equation}
with the boundary conditions
 \begin{equation} \left.\begin{gathered} \frac{\textrm{d}^{3}W_2(1)}{\textrm{d} z^{3}} + \tilde{k}^{2}\varepsilon^{2} \frac{\textrm{d}W_1(1)}{\textrm{d} z} = 0,\\ W_2(1) + \tilde{k}^{2}\varepsilon^{2}\frac{{{Fr_\tau}}^{2}{{Pr_\tau}}}{{{Ca_\tau}}}W_1(1) + 2\varepsilon{{Fr_\tau}}^{2}{{Pr_\tau}}\left(\omega_1\frac{\textrm{d}W_1(1)}{\textrm{d} z}+ \omega_2\frac{\textrm{d}W_0(1)}{\textrm{d} z}\right) = 0, \\ \bar{C}_2(1) = 0, \quad \frac{\textrm{d} N_2(1)}{\textrm{d} z} + \frac{\omega_2}{\omega_1} \frac{\textrm{d} N_1(1)}{\textrm{d} z} +{+} \frac{\omega_3}{\omega_1} \frac{\textrm{d} N_0(1)}{\textrm{d} z} - N_1(1) - \frac{\omega_2}{\omega_1}N_0(1) \\ - \frac{\textrm{d}\bar{C}_1(1)}{\textrm{d} z} - \left(\frac{\omega_2}{\omega_1} + \frac{1}{3}\right)\frac{\textrm{d} \bar{C}_0(1)}{\textrm{d} z} - \frac{1}{2\omega_1}W_0(1) = 0,\\ \frac{\textrm{d}W_2(0)}{\textrm{d} z} = 0, \quad W_2(0) = 0, \quad \frac{\textrm{d} N_2(0)}{\textrm{d} z} = 0, \quad \frac{\textrm{d}\bar{C}_2(0)}{\textrm{d} z} = 0. \end{gathered}\right\} \end{equation}
At the third order, the governing equations are
 \begin{align}
\frac{\textrm{d}^{4}W_3}{\textrm{d} z^{4}}
&={-}\tilde{k}^{2}\varepsilon\left(N_0 {{Ra_\tau}}_2 +
N_1{{Ra_\tau}}_1 + N_2{{Ra_\tau}}_0 +
N_3{{Ra_\tau}}_{{-}1}\right) + \frac{\varepsilon
(2\tilde{k}^{2}\varepsilon{{Pr_\tau}} + \omega_1)}{{{Pr_\tau}} }\frac{\textrm{d}^{2} W_2}{\textrm{d}
z^{2}}\nonumber\\ &\quad + \frac{\omega_2
\varepsilon}{{{Pr_\tau}}}\frac{\textrm{d}^{2}W_1}{\textrm{d}
z^{2}} + \frac{\omega_3\varepsilon}{{{Pr_\tau}}}\frac{\textrm{d}^{2}W_0}{\textrm{d} z^{2}} -
\frac{\tilde{k}^{2}\omega_2 \varepsilon^{3}}{{{Pr_\tau}} } W_0 -
\frac{\tilde{k}^{2}\varepsilon^{3}(\tilde{k}^{2}\varepsilon{{Pr_\tau}}
+ \omega_1)}{{{Pr_\tau}} } W_1, \end{align}
 \begin{align} \frac{\textrm{d}^{2} N_3}{\textrm{d} z^{2}} &={-}\frac{1}{3}z(1 - 2z^{2}) \frac{\textrm{d} \bar{C}_0}{\textrm{d} z} + z\frac{\textrm{d} \bar{C}_1}{\textrm{d} z} + N_2(\tilde{k}^{2}\varepsilon^{2} + \omega_1\varepsilon + 2) + \frac{1}{3}N_1(3z^{2} + 3\omega_2\varepsilon - 1)\nonumber\\ &\quad + \frac{1}{6}z (z^{2} - 1)\frac{\textrm{d} N_1}{\textrm{d} z} + \frac{1}{18}N_0(3z^{4} - 3z^{2} + 18\omega_3\varepsilon + 1) + z\frac{\textrm{d} N_2}{\textrm{d} z} - \frac{1}{3}z(1 - 2z^{2})\varepsilon W_1\nonumber\\ &\quad + z\varepsilon W_2, \end{align}
 \begin{equation} \frac{\textrm{d}^{2} \bar{C}_3}{\textrm{d} z^{2}} = \tilde{k}^{2} \varepsilon^{2} C_2 + N_3, \end{equation}
with the boundary conditions
 \begin{align} \left.\begin{gathered}
\frac{\textrm{d}^{3}W_3(1)}{\textrm{d} z^{3}} +
\tilde{k}^{2}\varepsilon^{2}
\frac{\textrm{d}W_2(1)}{\textrm{d} z} = 0,\\ W_3(1) +
\tilde{k}^{2}\varepsilon^{2}\frac{{{Fr_\tau}}^{2}{{Pr_\tau}}}{{{Ca_\tau}}}W_2(1)
+
2\varepsilon{{Fr_\tau}}^{2}{{Pr_\tau}}\left(\omega_1\frac{\textrm{d}W_2(1)}{\textrm{d}
z} + \omega_2\frac{\textrm{d}W_1(1)}{\textrm{d} z} +
\omega_3\frac{\textrm{d}W_0(1)}{\textrm{d} z}\right) = 0,\\
\bar{C}_2(1) = 0, \qquad \frac{\textrm{d}
N_3(1)}{\textrm{d} z} -\frac{(\omega_1 +
3\omega_2)}{3\omega_1} \frac{\textrm{d}
\bar{C}_1(1)}{\textrm{d} z} - \frac{(6\omega_2 + 18\omega_3
+ 1)}{18\omega_1} \frac{\textrm{d} \bar{C}_0(1)}{\textrm{d}
z} - \frac{\textrm{d} \bar{C}_2(1)}{\textrm{d} z}\\ \quad +
\frac{\omega_3}{\omega_1}\frac{\textrm{d}
N_1(1)}{\textrm{d} z} +
\frac{\omega_2}{\omega_1}\frac{\textrm{d}
N_2(1)}{\textrm{d} z} - \frac{\omega_3}{\omega_1}N_0(1) -
\frac{\omega_2}{\omega_1}N_1(1) - N_2(1) -
\frac{W_1(1)}{2\omega_1} - \frac{W_0(1)}{54\omega_1} = 0,\\
\frac{\textrm{d}W_3(0)}{\textrm{d} z} = 0, \quad W_3(0) =
0, \quad \frac{\textrm{d} N_3(0)}{\textrm{d} z} = 0, \quad
\frac{\textrm{d}\bar{C}_3(0)}{\textrm{d} z} = 0.
\end{gathered}\right\} \end{align}



