Introduction
Phyllosilicates are extremely important and useful industrial minerals. Recently, such compounds, with a crystal structure characterised by two-dimensional infinite sheets, have received attention as promising material for applications in waste-water treatment and so have been studied extensively. In addition, there is evidence that suggests that sheet silicates could contribute to developing multifunctional materials for various applications in a single material.
Fluorcarletonite, KNa4Ca4[Si8O18](CO3)4(F,OH)·H2O, and carletonite, KNa4Ca4[Si8O18](CO3)4(OH,F)·H2O, are very rare and complex silicates. In the first articles devoted to carletonite (Chao, Reference Chao1971; Chao, Reference Chao1972), the formulas were given incorrectly, as the prevalence of the OH group over F in the chemical composition of the mineral was not taken into account.
According to the silicate minerals hierarchy of Hawthorne et al. (Reference Hawthorne, Uvarova and Sokolova2019), fluorcarletonite and carletonite are sheet silicates with a two-dimensional infinite tetrahedral polymerisation. The tetrahedral double layer in the mineral structures can be considered as a 3-connected net with the designation 4.82.
The [Si8O18]4– sheets extend perpendicular to the c axis and consist of two types of tetrahedral rings: (1) a four-membered ring consisting of two upward-pointing (u) and two downward-pointing (d) tetrahedra, and (2) an eight-membered ring consisting of alternately upward-pointing (u) and downward-pointing tetrahedra (d). The u-d arrangement in the fluorcarletonite and carletonite tetrahedra sheet is (u2d2)4(udududud)4 (see table 7 in Hawthorne et al., Reference Hawthorne, Uvarova and Sokolova2019). Adjacent single layers are interconnected by downward-pointing tetrahedra. The tetrahedral double layers are connected with sheets of (Na(O,F,H2O))-octahedra, (Ca(O,F))- and (KO)-polyhedra. CO3-groups and H2O molecules occupy interlayer space. According to Hawthorne et al. (Reference Hawthorne, Uvarova and Sokolova2019), one water molecule is transformer, i.e. it bonds to an interstitial cation and acts as a bond-valence transformer (Hawthorne, Reference Hawthorne1992), whereas the (H2O)0 molecule occupying the second structural position is non-transformer.
Kaneva et al. (Reference Kaneva, Radomskaya, Suvorova, Sterkhova and Mitichkin2020a, Reference Kaneva, Radomskaya and Shendrik2022) reported the main difference between fluorcarletonite and carletonite chemical compositions is reflected in the content of F. The atomic proportion of F in the crystal structure of fluorcarletonite calculated in Kaneva et al. (Reference Kaneva, Radomskaya, Suvorova, Sterkhova and Mitichkin2020a) varies from 0.53 to 0.98 atoms per formula unit (apfu), whereas Chao (Reference Chao1971) obtained a value of 0.41 apfu in the carletonite.
Alkaline silicates are used widely as promising phosphors (Wang et al., Reference Wang, Chen, Liu and Pan2020; Fernández-Rodríguez et al., Reference Fernández-Rodríguez, Durán and Pascual2021). Carletonite and fluorcarletonite contain cationic positions that can be easily doped with transition metal and lanthanide ions. Therefore, they could be prospective materials for novel phosphors and luminophores. Moreover, the presence of carbonate groups in the structure, which are effective electron donors (Shendrik et al., Reference Shendrik, Kaneva, Radomskaya, Sharygin and Marfin2021; Kaneva and Shendrik, Reference Kaneva and Shendrik2022), makes it possible to create novel promising phosphors based on phyllosilicates.
A detailed study of phyllosilicates using a combinatorial multi-method approach has not yet been provided. In this study, we investigate crystal-chemical properties of phyllosilicates using a combinatorial approach including spectroscopy and diffraction methods. We demonstrate a route to phyllosilicate phosphors doped with Ce from natural fluorcarletonite and carletonite. For this purpose, we also applied a two-stage computational approach. Using VASP (Kresse and Hafner, Reference Kresse and Hafner1993) for periodic calculations we were able to optimise the bulk geometry and to calculate the electronic structure of fluorcarletonite and carletonite. In turn, molecular calculations done in ORCA (Nesse, 2012) allowed us to investigate point defects and study their effects on the macroscopic properties of crystals (such as colouration).
Experimental methods
Sample description
Fluorcarletonite and carletonite are found in only two locations in the world: the Severny district of Murun massif, Eastern Siberia, Russia and Mont Saint-Hilaire, Quebec, Canada.
In addition, it has been reported recently that carletonite has been found in the lateritic soils covering carbonatites, ijolites, nepheline syenites and fenites of the Bingo carbonate complex, Democratic Republic of Congo (Kasay et al., Reference Kasay, Bolarinwa, Aromolaran, Nzolang and Mambo2021), though this data has not yet been confirmed.
We used fluorcarletonite from the same rock fragment as studied previously by Kaneva et al. (Reference Kaneva, Radomskaya, Suvorova, Sterkhova and Mitichkin2020a, Reference Kaneva, Radomskaya and Shendrik2022). The carletonite sample was kindly provided by the Fersman Mineralogical Museum (sample number FMM-1-86389, https://www.fmm.ru/FMM_1_86389).
Chemical analysis
Chemical analyses were carried out on single crystals of fluorcarletonite and carletonite samples embedded in epoxy resin, polished and carbon coated. Chemical data for the crystals were obtained using a TESCAN MIRA 3 microscope (TescanOrsay Holding, Brno, Czech Republic) (EDS mode) and JEOL JXA-8230 instrument (wavelength dispersive spectroscopy mode).
The TESCAN MIRA 3 was operated at an accelerating voltage of 20 kV and a beam current of 1 nA. The results were checked against reference standards of simple compounds and metals for the majority of the elements. A JXA-8230 electron microprobe operating at 15 kV accelerating voltage, 5 nA sample current, ~1 μm spot size and 40 s counting time was used. The standards used for major and minor components were: F-phlogopite (Si, Al, K, Mg and F); diopside (Ca); albite (Na); Mn-garnet rhodonite (Mn); pyrope (Fe); Sr-glass (Sr); ZrSiO4 (Zr); BaSO4 (Ba); Ti-glass (Ti); Y-phosphate (Y); Cl-apatite (Cl and P); PbS (Pb); Cs2RECl6 (Cs); Cr-pyrope (Cr); V2O5 (V); La-phosphate (La); Ce-phosphate (Ce); Eu-phosphate (Eu); and pure Sc and Nb. For the conversion from X-ray counts to oxide weight percentages (wt.%) a Phi-Rho-Z method was employed as implemented in the Jeol suite of programs.
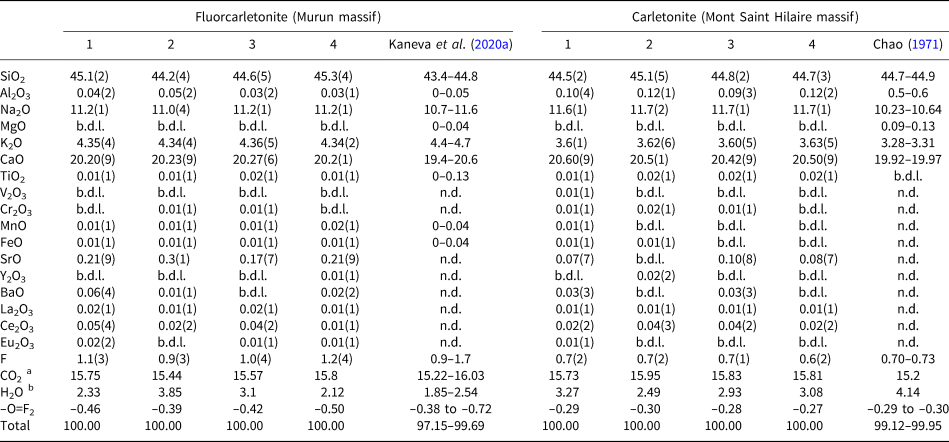
The average compositions (determined over 8–10 spots) are reported in Table 1.
Average chemical composition (wt.%) for the fluorcarletonite and carletonite crystals studied compared with literature data.

b.d.l. – below detection limit; n.d. – not determined; a calculated according to the principle of electroneutrality of the chemical formula; b determined by single-crystal X-ray diffraction data refinement.
Structural analysis
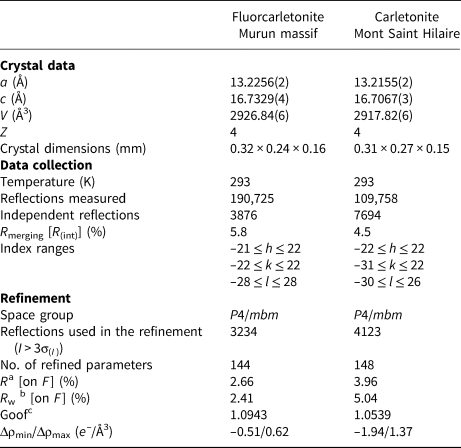
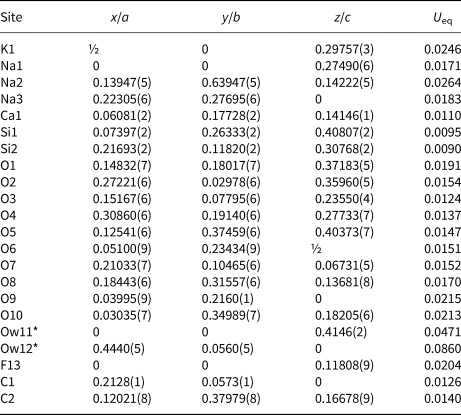
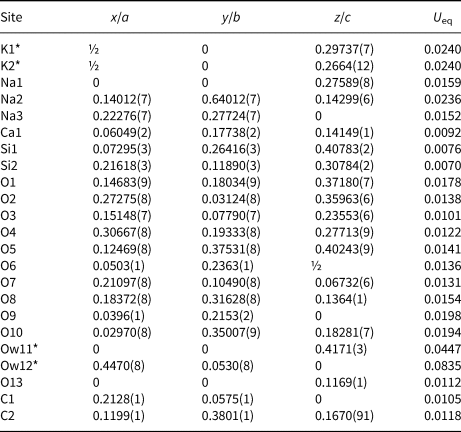
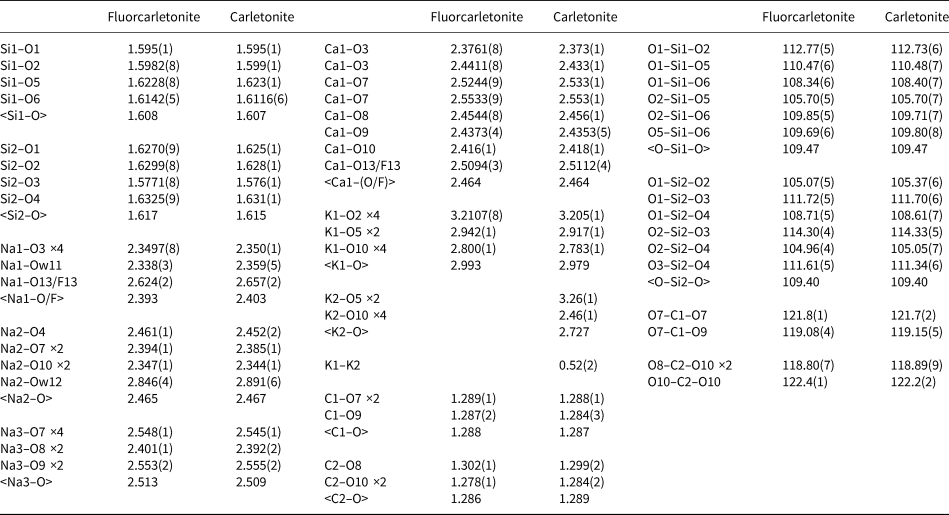
The crystal-structure determination was performed with a Bruker AXS D8 VENTURE automated diffractometer (Bruker, Berlin, Germany). The X-ray diffraction technique is equipped with a Photon 100 detector and monochromatised MoKα radiation. Operating conditions were: 50 kV and 1 mA, with a crystal-to-detector distance of 40 mm. The collection strategy was optimised with the COSMO program in the APEX2 suite package (Bruker, 2007). Data reduction was performed using CrysAlisPro Version 1.171.39.46 (Rigaku, 2018). The structure refinement was then performed against F in the space group P4/mbm using the program CRYSTALS (Betteridge et al., Reference Betteridge, Carruthers, Cooper, Prout and Watkin2003). Reflections with I>3σ(I) were considered as observed and the refined parameters were: scale factor, atom positions, anisotropic displacement parameters and occupancies for Ow anions. Initial fractional coordinates and atom labelling were taken from Kaneva et al. (Reference Kaneva, Radomskaya, Suvorova, Sterkhova and Mitichkin2020a). The occupancy for F13 and O13 atoms in fluorcarletonite and carletonite, respectively, was constrained to 1, however, as indicated by the electron microprobe data, these structural sites have mixed F/OH and OH/F occupancies. The U eq values obtained for F13 and O13 sites in fluorcarletonite and carletonite (Table 3 and Table 4) are based on F only and O only, respectively. The displacement parameters of Ow atoms (oxygens in water molecules), which represents a smearing of the densities of atomic electrons around their equilibrium positions, have increased values [Table 3 and Table 4; similar to those found in crystal-structure refinements by Chao (Reference Chao1972) and Kaneva et al. (Reference Kaneva, Radomskaya, Suvorova, Sterkhova and Mitichkin2020a)], possibly due to positional disorder or to the rotating hydrogen atoms in water molecules. The final fully anisotropic refinement converged to R = 2.66 and 3.96% (Rw = 2.41 and 5.04%). The crystallographic information files have been deposited with the Cambridge Crystallographic Data Centre (CCDC 2153798 and 2153799) and with the Principal Editor of Mineralogical Magazine (see Supplementary material below). Unit cell parameters, relevant data from X-ray collection and the structure refinements are given in Table 2, final atomic coordinates, site occupancies, equivalent and anisotropic displacement parameters are reported in Table 3, Table 4 and Supplementary Tables S1 and S2. Selected interatomic distances and angles are given in Table 5.
Selected data on single crystals, data collection and structure refinement parameters of the studied fluorcarletonite and carletonite.

a R = Σ[|F o| – |F c|]/Σ|F o|.
b R w = [Σ[w(Fo 2–Fc 2)2]/Σ[w(F o2)2]]½; w = Chebyshev optimised weights.
c Goodness-of-fit = [Σ[w(Fo 2 – Fc 2)2]/(N – p]½, where N and p are the number of reflections and parameters, respectively.
Crystallographic coordinates, occupancies and equivalent/isotropic atomic displacement parameters (Å2) for fluorcarletonite.

*Occupancies: Ow11 = 0.87(1) and Ow12 = 0.55(2).
Crystallographic coordinates, occupancies and equivalent/isotropic atomic displacement parameters (Å2) for carletonite.

*Occupancies: K1 = 0.889(5), K2 = 0.058(4), Ow11 = 0.737(8) and Ow12 = 0.489(8).
Selected bond distances (Å) for tetrahedra, polyhedra and angles (°) for tetrahedra of the studied fluorcarletonite (Murun massif) and carletonite (Mont Saint Hilaire massif) samples.

Bond-valence calculations (Supplementary Tables S3 and S4) for ion pairs involving oxygen were performed using the parameters from Gagné and Hawthorne (Reference Gagné and Hawthorne2015), whereas to calculate values of the cation–fluorine bonds, parameters given in Breese and O'Keeffe (Reference Breese and O'Keeffe1991) were used.
A statistical analysis of structural data, described by us earlier in Kaneva et al. (Reference Kaneva, Shendrik, Radomskaya and Suvorova2020c), was carried out (Supplementary Table S5). For the coordination polyhedral characterisation, calculations of the distortion and geometric parameters (Robinson et al., Reference Robinson, Gibbs and Ribbe1971; Renner and Lehmann, Reference Renner and Lehmann1986; Balić-Žunić and Vicković, Reference Balić-Žunić and Vicković1996; Balić-Žunić and Makovicky, Reference Balić-Žunić and Makovicky1996) were applied (Supplementary Table S6).
Spectroscopic and luminescence study
The cleaved single-crystal plates of fluorcarletonite and carletonite were used for luminescence and optical absorption experiments. The thickness of the samples was ~0.6 mm. The low-temperature absorption spectra have been obtained in the Perkin-Elmer Lambda 950 UV/VIS/NIR spectrophotometer at 7 K using cryocooler Janis Research CCS-100/204N.
Photoluminescence spectra under UV/VIS excitation were registered using a Perkin-Elmer LS-55 UV/VIS spectrofluorometer. The slit size for excitation and emission monochromators was 15 and 5 nm, respectively, in the luminescence registration regime. Excitation spectra were recorded with 5 and 15 nm slit sizes for excitation and emission monochromators, respectively.
Luminescence under vacuum-ultraviolet (VUV) excitation was recorded using an MDR-2 monochromator with a diffraction grating of 1200 lines per mm and a Hamamatsu photomodule operating in the photon counting mode. Excitation was performed using a Hamamatsu L7293-50 deuterium lamp with a magnesium fluoride window through a VMR-2 vacuum monochromator. The excitation spectra were corrected using sodium salicylate. The procedure is described in detail in Kaneva and Shendrik (Reference Kaneva and Shendrik2022).
Electron Spin Resonance (ESR) spectra were registered by a RE1306 X-band spectrometer with a frequency of 9.358 GHz. An oriented cleaved single-crystal grain was placed on a quartz cryostat. Measurements were performed at room temperature and 77 K.
The thermal bleaching procedure is described in Kaneva and Shendrik (Reference Kaneva and Shendrik2022). The bleaching experiments were provided on the polished single-crystal plate of fluorcarletonite.
Calculation method
Calculations of structural and electronic properties of the fluorcarletonite and carletonite were performed using VASP (Kresse and Hafner, Reference Kresse and Hafner1993), a software package that is DFT-based code with periodic boundary conditions. The PBEsol (Perdew et al., Reference Perdew, Ruzsinszky, Csonka, Vydrov, Scuseria, Constantin, Zhou and Burke2008) approximation was chosen for the exchange-correlation term. The code uses plane-wave basis sets, and a 400 eV cut-off energy was chosen. The PAW pseudopotentials distributed with the code were used to represent core electrons. The following electrons were treated as valent: K 3s 23p 64s 1, Na 3s 1, Ca 4s 2, Si 3s 23p 2, O 2s 22p 4, F 2s 22p 5, C 2s 22p 2 and H 1s 1. Due to the large cell size of carletonite (a = b = 13.2 Å and c = 16.7 Å) we only used gamma-point sampling of the Brillouin zone. The atomic positions were optimised with 0.01 eV/Å stop-criteria for forces. The lattice vectors were fixed at their experimental values.
In order to resolve the positions of hydrogens in the crystals, we prepared several structural models with different orientations of H2O molecules at Ow11 and Ow12 sites. Then, the atomic positions of all structures were relaxed. We derived the most energetically favourable orientations of H2O for each site and used them in subsequent structure optimisations of fluorcarletonite and carletonite.
Calculations of electronic density of states (Supplementary Fig. S1) in fluorcarletonite and carletonite were carried out within structural models that did not contain H2O molecules. There were two reasons: firstly, due to the disorder in H2O orientations and low occupation numbers, water-related electronic states are not expected to contribute significantly to the boundaries of the valence and conduction bands; secondly, the presence of H2O molecules in real crystals complicates the comparison between the electronic structures of fluorcarletonite and carletonite. The atomic coordinates of the simulated crystal structure models are reported in Supplementary Tables S7 and S8.
Calculations of the optical absorption of CO3– radical were performed within the ORCA software package (Neese, Reference Neese2012) which implements DFT-based calculations with GTO basis sets. In order to calculate ESR parameters and optical absorption spectra of CO3–, we used atomic positions of the fluorcarletonite optimised with VASP. The atoms of the CO3 group and of the nearest H2O molecule were given aug-cc-pVTZ basis sets, whereas other atoms were replicated in order to form a large box (a,b,c ≈ 8 nm) with zero dipole moment of point charges with nominal charges: K +1, Na +1, Ca +2, Si +4, O –2, F –1, C +4 and H +1. We used the B3LYP (Stephens et al., Reference Stephens, Devlin, Chabalowski and Frisch1994) expression for the exchange-correlation term. No additional geometry optimisation was performed at this step. Optical absorption spectra were calculated within the TD-DFT procedure.
Results
Comparative crystal chemistry
The average formula of fluorcarletonite is K0.99Na3.86Ca3.87Sr0.02Si7.99Al0.01O18(CO3)3.81(F0.60OH0.40)⋅1.42H2O. The average formula of carletonite is K0.82Na4.03Ca3.92Sr0.01Si7.98Al0.02O18(CO3)3.85(OH0.61F0.39)⋅1.23H2O.
The composition of the fluorcarletonite studied is almost identical to the sample reported in Kaneva et al. (Reference Kaneva, Radomskaya, Suvorova, Sterkhova and Mitichkin2020a, Table 1). The carletonite crystals show higher Na2O, K2O and CaO contents and slightly lower Al2O3 concentration with respect to carletonite reported in Chao (Reference Chao1971); see Table 1. However, the fluorcarletonite specimen, has significantly higher F (~1.1 vs. 0.7 wt.%), K2O (~4.35 vs. 3.61 wt.%), and SrO (~0.22 vs. 0.06 wt.%) and lower average Al2O3 (~0.04 vs. 0.11 wt.%) than carletonite.
Some geometrical details of the fluorcarletonite and carletonite structures are illustrated in Fig. 1. Figure 2 shows that in our structure model of carletonite the K atom is split over two different positions, labelled K1and K2 (according to the refinement, populated by ~89 and 6%), whereas the K atom in fluorcarletonite is ordered. The low bond-valence sum (BVS) of 0.76 valence units (vu) for the atom at K1 and high value of 1.46 vu for K2 in carletonite (Supplementary Tables S3 and S4), indicate the positional disorder, as well as that K1 is weakly bonded to the structure and the K2 position may be populated by a cation with higher charge, for instance, Ca2+ or Sr2+. The lengths of the average K1–O distances of the potassium polyhedral in both minerals are closed (2.993 vs. 2.979 Å; Table 5). The <K2–O> distance in carletonite is shorter (2.727 Å; Table 5). The distance between K1 and K2 is equal to 0.52 Å. Geometrical and distortion parameters of K-polyhedra in the samples studied have similar values (Supplementary Tables S5 and S6).
The crystal structure of the studied fluorcarletonite and carletonite projected along the b axis. Si-tetrahedra are black, Ca-, Na- and K-polyhedra are blue, yellow and violet, respectively. Oxygen atoms are drawn in red, Ow atoms (oxygen of H2O molecule) are drawn in lavender. C atoms are brown, while CO3 triangles are outlined in red. The positions occupied by F in fluorcarletonite and oxygen of OH group in carletonite structures are indicated by light green spheres. The unit cell is outlined with a solid black line. Crystal structures were drawn using the program VESTA (version 4.3.0) (Momma and Izumi, Reference Momma and Izumi2011).

Perspective view of the carletonite crystal structure fragment with the disordered potassium site. The partially white colouring of the spheres indicates a vacancy.

Apart from the K-positions, in the fluorcarletonite and carletonite structures, the symmetrically independent crystallographic alkaline and earth-alkaline cations sites are: two octahedrally coordinated (Na1 and Na2) and two [8]-coordinated (Na3 and Ca1) sites. The Na and Ca sites in the two samples show almost the same geometric and distortion parameters (Supplementary Tables S5 and S6).
The Na1 and Na2 octahedra differ significantly from each other: (1) the average sodium–anion distance values for Na2 is greater than those of Na1 (~2.47 Å vs. ~2.39–2.40 Å, Table 5); (2) the volume of the coordination octahedron and volume of the sphere fitted to the positions of its ligands of Na2 exceed those of Na1 (~19 Å3vs. ~17 Å3 and ~62 Å3vs. ~57 Å3, Supplementary Table S5); (3) Na2 has higher average distances from the volume centre and centroid to the ligands (rv: ~2.45 Å vs. ~2.34 Å; rs: ~2.45 Å vs. ~2.37–2.38 Å, Table S5); (4) the distance of the central atom to the volume centre of Na2 is shorter (~0.32–0.34 Å vs. ~0.49–0.50 Å, Supplementary Table S5), whereas the distance of the central atom to the centroid of Na2 is longer than those of Na1 (~0.18–0.21 Å vs. ~0.12 Å, Supplementary Table S5); (5) the value of volume eccentricity of Na2 is greater (ECCv: ~0.209–0.238 vs. ~0.146–0.147, Supplementary Table S5), whereas its value of volume sphericity is lower than those of the Na1 octahedron (SPHv: ~0.791–0.808 vs. ~0.875–0.893, Supplementary Table S5); and (6) OAV, OQE and ELD values of Na1 are higher than those of Na2, whereas the parameter of BLD is lower (Supplementary Table S6).
Indeed, the value of the <Ca1–O> distance (~2.46 Å) is lower than those of the <Na3–O> (~2.51 Å) distance (Table 5). Differences are also noted in the following: (1) the volume of the sphere fitted to the positions of its ligands of Na3 are much higher than those of calcium (~66 Å3 vs. ~62 Å3, Supplementary Table S5); (2) Na3 also have longer average distances from the volume centre and centroid to the ligands than Ca1 (rv: ~2.49 Å vs. ~2.45 Å; rs: ~2.50–2.51 Å vs. ~2.46 Å, Supplementary Table S5); (3) the distance of the central atom to the volume centre of Na3 is longer (~0.28–0.29 Å vs. ~0.21 Å, Table S5), whereas the distance of the central atom to the centroid is shorter (~0.06 Å vs. ~0.07 Å, Table S5); (4) finally, both the volume eccentricity and the volume sphericity parameters have higher values for Ca1 in comparison with Na3 (ECCv: ~0.068 vs. ~0.085–0.088; SPHv: ~0.922–0.927 vs. ~0.944–0.947, Supplementary Table S5). Supplementary Table S6 demonstrates that the values of BLD and ELD of the independent Na3 and Ca1 polyhedra are quite similar.
The BVS for the atoms at Na positions are slightly higher than 1, in addition BVS for Ca exceeds 2.
Concerning the tetrahedra of the silicate layer anion–radical, <Si–O> distances (Table 5) are similar in both the samples studied (average distances for Si1 and Si2 are equal to 1.608 and 1.617 Å for fluorcarletonite and 1.607 and 1.615 Å for carletonite, respectively). The Si2 tetrahedron has higher values for all geometric parameters (Vp, Vs, rv, rs, ΔV, Δ and ECCv, Supplementary Table S5) except parameter ECoN (~3.99 for Si1 vs. ~3.97 for Si2, Supplementary Table S5). The calculated geometric parameters indicate that the Si2 position of the studied structural models may include an insignificant amount of aluminium, confirmed by chemical analysis. Generally, all distortion parameters of symmetrically relative tetrahedra are very similar. BLD, ELD, TAV and TQE values calculated for Si2 tetrahedra are higher than those for Si1.
The CO3 groups (Fig. 3a,b), lying in two fully occupied positions, have average C1–O distances of 1.288 and 1.287 Å and <C2–O> of 1.286 and 1.289 Å for fluorcarletonite and carletonite, respectively (Table 5). C1O3 has C–O bonds along, but not strictly parallel to, (100) and (010), while the triangle C2O3 has a considerable tilt relative to the (001) plane. The C cations of carbonate groups display a minor off-plane shift. The carbonate triangles are not equilateral, but isosceles [Δ(OC1–OC1) ≈ 0.032 and 0.032 Å, Δ(OC2–OC2) ≈ 0.019 and 0.023 Å; Δ(C1–O) ≈ 0.002 and 0.004 Å, Δ(C2–O) ≈ 0.024 and 0.015 Å; Δ(O–C1–O) ≈ 2.7 and 2.6° and Δ(O–C2–O) ≈ 3.6 and 3.3° for fluorcarletonite and carletonite, respectively]. C1O3 shares two edges with two Ca1 polyhedra and one edge with the Na3 polyhedron. It also has common apexes with Na2 and Na3 (Fig. 3a). C2O3 is bonded edgewise to two Ca1 polyhedra, and the third edge is adjacent to K1 polyhedron (or K2 in the disordered structure of carletonite). Vertices are also shared with the Na2 octahedron and the Na3- and another K-polyhedron (Fig. 3b).
Perspective views of the fluorcarletonite and carletonite crystal-structure fragments showing the environment around the (a) C1O3 group and (b) C2O3 group. C atoms are brown and CO3 triangles are outlined in brown. The positions occupied by F in fluorcarletonite and by oxygen of the OH group in carletonite structures are indicated by light-green spheres.

The BVS of the carbonate anionic groups in fluorcarletonite and carletonite structures can be calculated from Supplementary Tables S3 and S4, as 2.11 and 2.12 for the C1O3-group and 2.01 and 2.03 for the C2O3-group, respectively. However, in a situation with the splitting of the potassium position and the displacement of the position of this cation towards the C2-triangle, the latter acquires a higher negative charge (~2.42 vu), which may affect the local stability of the crystal structure.
The С1O3-triangle has higher edge-length distortion (ELD) values than triangle C2O3 [0.637% vs. 0.379% for fluorcarletonite and 0.638% vs. 0.458% for carletonite]. However, with regards to bond-length distortion (BLD), the C2O3-triangle is highly distorted with BLD = 0.829% and 0.517%, while BLD for C1O3 is 0.069% and 0.138% for fluorcarletonite and carletonite, respectively.
Analysis of Supplementary Tables S3 and S4 reveals that the BVS of the samples studied are generally satisfactory for the oxygen atoms. Anomalies concern: (1) the O10 atom in carletonite with a high BVS (2.23 vu) in the case when it is coordinated by the cation in position K2 displaced away from the K1 and silicon-oxygen layer; and (2) the O13 atom in carletonite with a low BVS (0.90 vu) indicating that this position belongs to a hydroxyl group partially substituted by fluorine. The atomic proportion of F in fluorcarletonite, calculated on the basis of chemical analysis data, ranges from 0.53 to 0.67 apfu, whereas for carletonite this value is equal to 0.36–0.41 apfu. As the occupancies of these positions are complete, the remaining 33–47% (in fluorcarletonite) and 59–64% (in carletonite) are occupied by the hydroxyl group.
Moreover, in fluorcarletonite, this position nominally refers to the position of fluorine, whereas in carletonite, the main host is the OH group. The F↔OH substitution does not imply significant structural differences between minerals as the ionic radii of the fluorine and oxygen are very close (1.30 and 1.36 Å, respectively; Shannon, Reference Shannon1976), and the hydrogen ion does not have a strong effect on the position environment.
The Ow11 and Ow12 atoms are the oxygen atoms of water molecules. As in previous works (Chao, Reference Chao1972; Kaneva et al., Reference Kaneva, Radomskaya, Suvorova, Sterkhova and Mitichkin2020a), here it was not possible to find the positions occupied by hydrogen of the water molecules. The bonding of the Ow11 of an H2O molecule to the polyhedral layer is weak (0.22 and 0.21 vu in the fluorcarletonite and carletonite structure, respectively; Supplementary Tables S3 and S4); the oxygen atom has only a close distance with the Na1 octahedron [2.338(3) and 2.359(5) Å in fluorcarletonite and carletonite, respectively; Table 5]. The Ow12 atom of another water molecule has one neighbouring cation (Na2), and receives only 0.13 and 0.12 vu in the fluorcarletonite and carletonite structures, respectively (Supplementary Tables S3 and S4), due to the large interatomic distances [Na2–Ow12 = 2.846(4) and 2.891(6) Å; Table 5]. Ow12 is partially occupied (Table 3 and Table 4), having an Ow12–Ow12 distance of 2.09(1) and 1.98(2) Å, which indicates that the two nearest Ow12 positions are mutually exclusive. Both symmetrically independent triangles of the carbonate group are also located in the environment of the Ow12 water position (within a radius of 4 Å). They are not taken into account in calculating the BVS (Supplementary Tables S3 and S4) due to small bond fluxes (<0.05 vu) and minor contributions to the chemical bonding.
Optical absorption
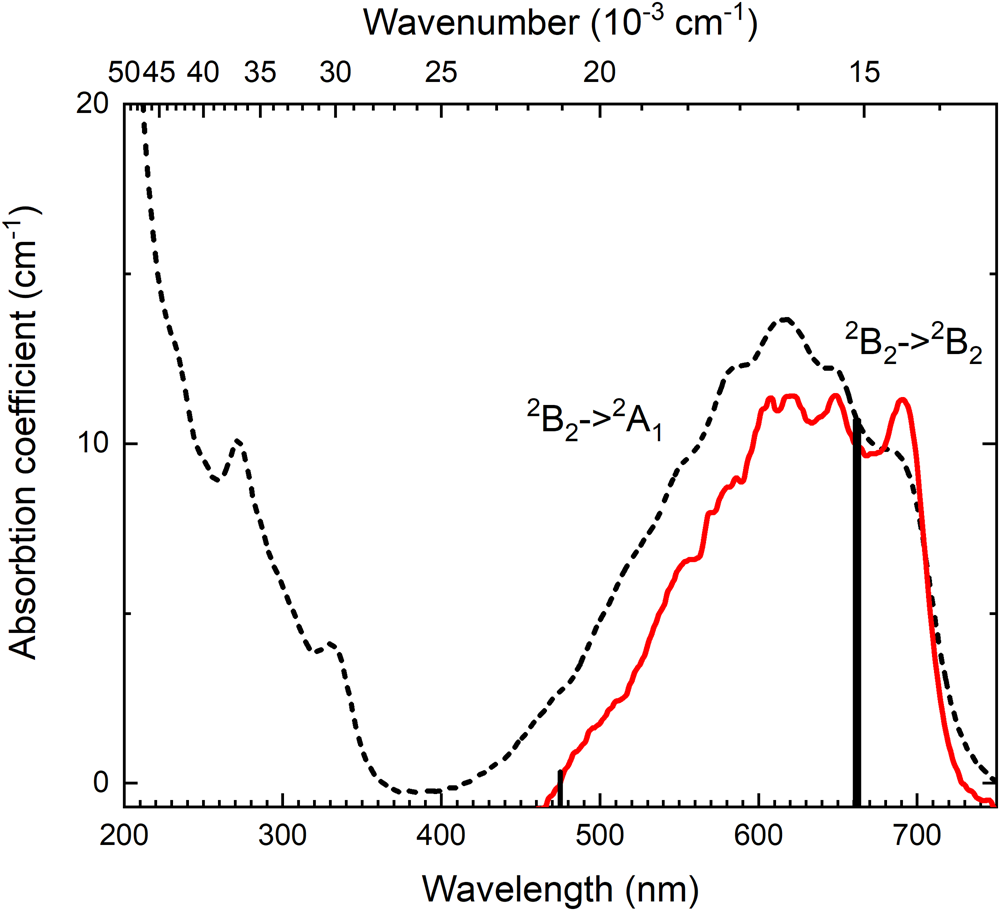
Fluorcarletonite, and most of the known samples of carletonite, have a saturated blue colouration, which is due to the presence of a wide absorption band in the region of 450–750 nm (22,200–13,300 cm–1) (Fig. 4). It has a weak vibrational structure at room temperature, however the structure of the band resolves better at 7 K. The maxima are located at 690 nm (14,493 cm–1), 648 nm (15,432 cm–1), 620 nm (16,129 cm–1), 607 nm (16,475 cm–1), 585 nm (17,094 cm–1), 568 nm (17,606 cm–1) and 556 nm (17,986 cm–1). In the ultraviolet region of the spectrum, a rise and peaks at 330 nm (30,300 cm–1) and 270 nm (37,000 cm–1) are observed.
Optical absorption spectra of fluorcarletonite measured at room (dashed curve) and 7 K (red solid curve) temperatures. Vertical lines (at 475 and 660 nm) show the position of calculated electron transitions in CO3•– radical.

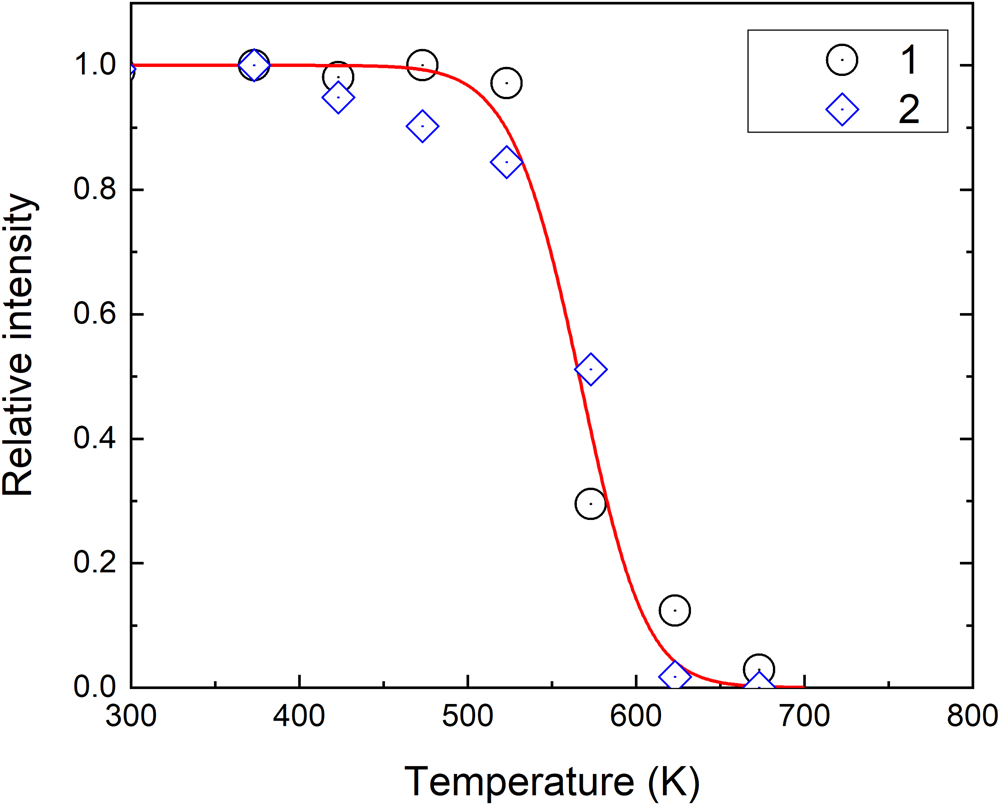
The intensity of the band in the 450–750 nm region decreases when the samples are heated. The temperature dependence of the samples annealed at different temperatures is shown in Fig. 5. The absorption band intensity is reduced to half after annealing at 565 K. The samples become transparent after annealing at 670 K. Intensity of absorption bands in the UV spectral region is not changed during annealing.
Temperature dependences of the integral intensity of absorption band in the region 450–750 nm (circles) and ESR signal (diamonds). The solid curve is fitted using the Garlick–Gibson equation (Garlick and Gibson, Reference Garlick and Gibson1948).

Electron spin resonance
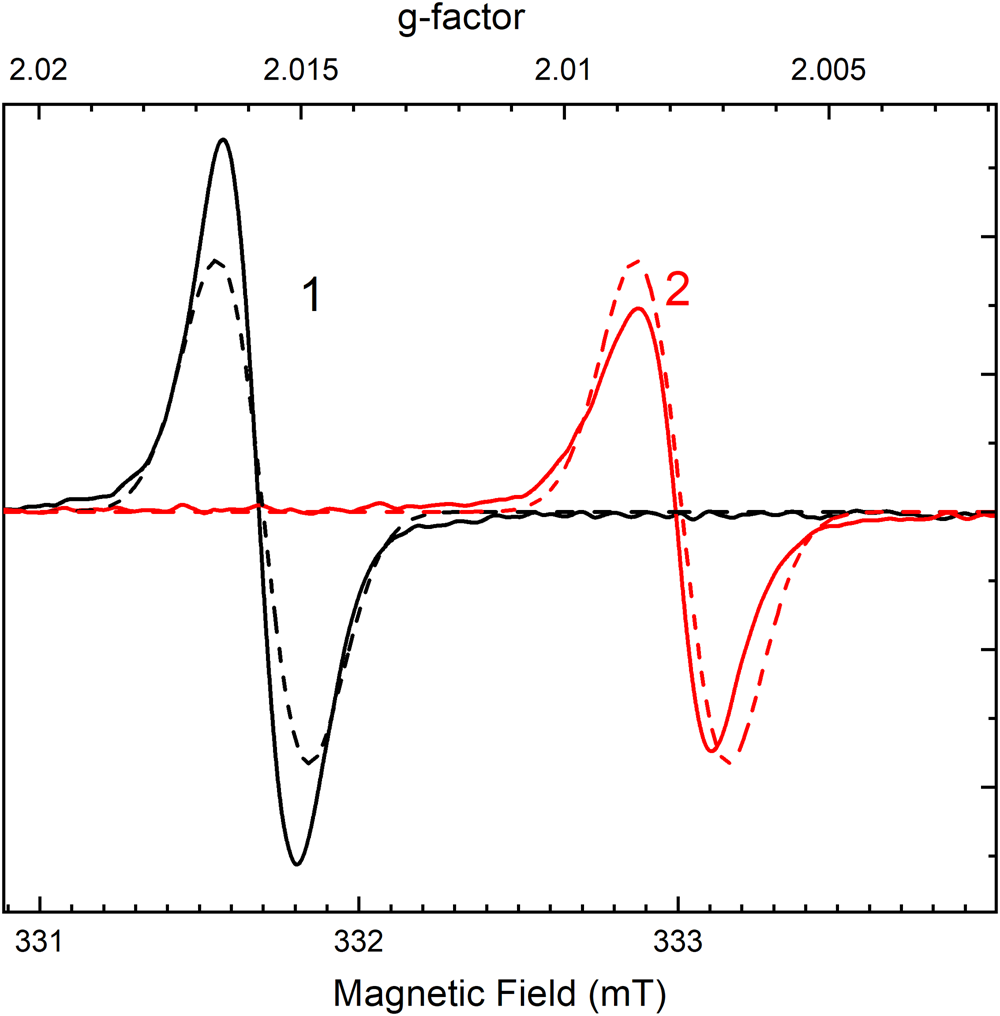
In fluorcarletonite and carletonite an intense ESR signal with g-factor of gxx = 2.016 and gzz = 2.008 is registered (Fig. 6). The intensity of the ESR signal is decreased in the annealed samples. The temperature dependence of the ESR signal is given in Fig. 5. The intensity of the absorption band at 600 nm is correlated with ESR signal intensity in the annealed sample.
Electron spin resonance curve of initial fluorcarletonite sample oriented along (solid curve 1) and perpendicular (solid curve 2) to the c axis. Dashed curves are calculated ESR signals along and perpendicular to the c axis.

The colour and ESR signal of the bleached samples is partially restored by irradiation with VUV photons with a wavelength shorter than 150 nm or by X-rays.
Luminescence
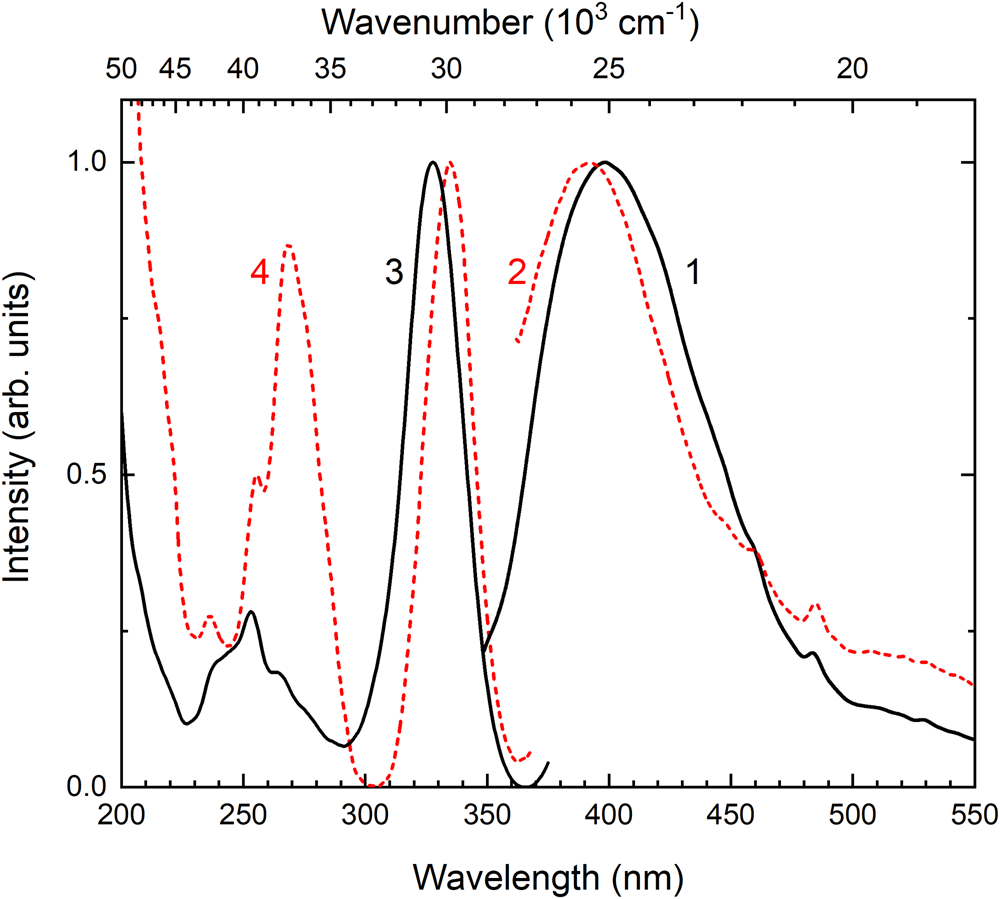
In fluorcarletonite and carletonite samples, wide luminescence bands excited at ~330 nm were found (Fig. 7, curves 1 and 2). The luminescence band maxima are located at 400 nm in fluorcarletonite and 390 nm in carletonite. Excitation spectrum of fluorcarletonite demonstrates four bands with slightly different maxima at 327 nm (30,580 cm–1), 265 nm (37,735 cm–1), 255 nm (39,215 cm–1), and 239 nm (41,840 cm–1) (Fig. 7, curve 3). In the excitation spectrum of carletonite four bands, peaked at 335 nm (29,850 cm–1), 269 nm (37,175 cm–1), 255 nm (39,215 cm–1) and 236 nm (42,370 cm–1), are registered (Fig. 7, curve 4). The rise at ~200 nm is observed in the spectra of both samples in the region of fundamental absorption.
Photoluminescence spectra of fluorcarletonite (curve 1) and carletonite (curve 2) under 330 nm excitation and excitation spectra of fluorcarletonite (curve 3) and carletonite (curve 4) monitored at 400 nm.

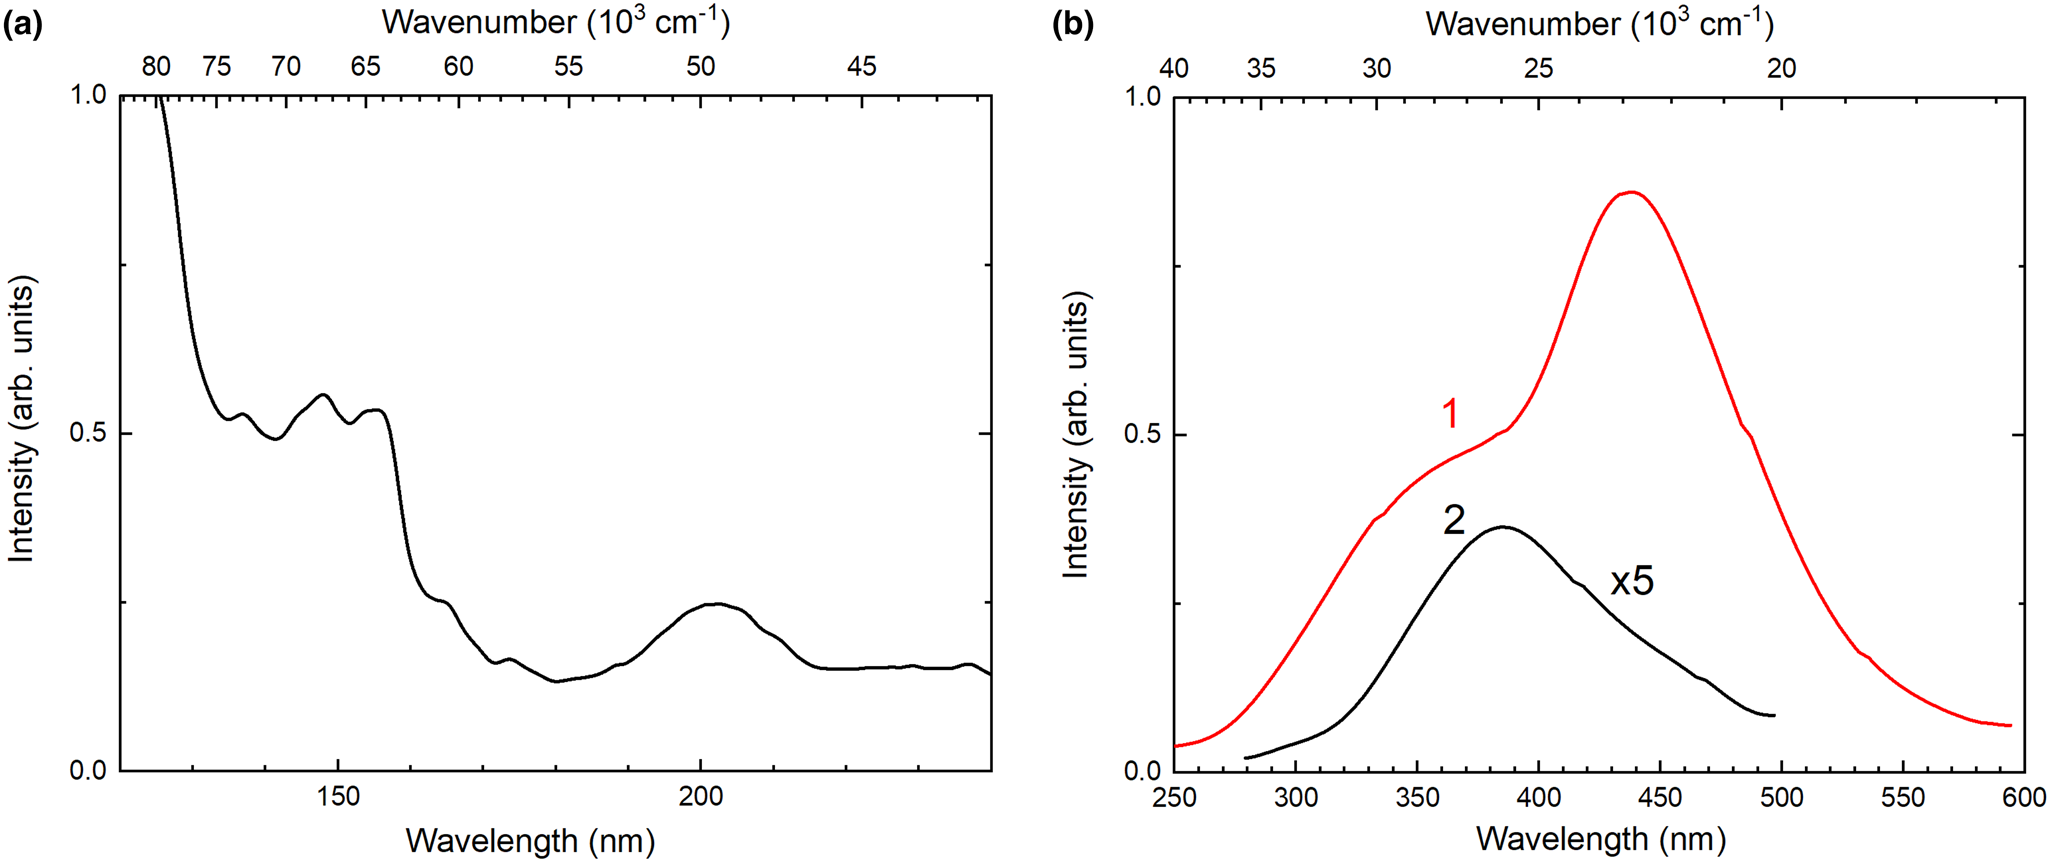
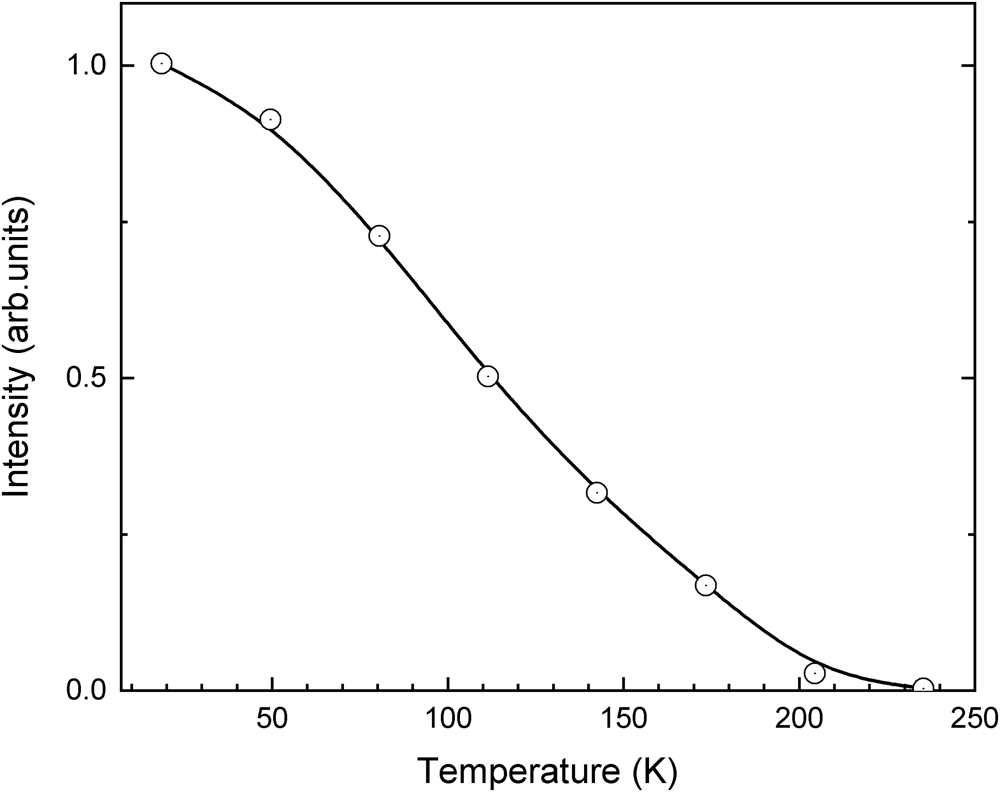
An intense luminescence at 440 nm is observed under excitation of fluorcarletonite and carletonite by VUV photons with a wavelength of 160 nm at 7 K temperature (Fig. 8b). This luminescence has strong temperature dependence and it is quenched at a temperature higher than 235 K. Temperature dependence of 440 nm luminescence is shown in Fig. 9. The excitation spectrum of 440 nm luminescence contains a band peaked at 200 nm (50,000 cm–1) and an intense plateau at 150 nm (66,500 cm–1) (Fig. 8a).
The excitation spectrum of intrinsic luminescence in fluorcarletonite (a) monitored at 440 nm and luminescence spectra (b) measured at 7 K (curve 1) and 290 K (curve 2) under 150 nm excitation. Curve 2 is increased fivefold.

Temperature dependence of the intensity of intrinsic luminescence at 440 nm.

Calculation results
The optimised local structures for different orientations of a single H2O molecule at Ow11 and Ow12 sites in carletonite are shown in Supplementary Fig. S1. This represents the most energetically favourable configurations of H2O in carletonite. The most stable orientations were found to be those forming the maximum number of hydrogen bonds with surrounding CO3 or SiO4 oxygens. The configurations with the lowest total energies (Supplementary Fig. S1b,c) were used as starting points to model the crystal structures of the H2O-containing carletonite and fluorcarletonite where the occupancies of the Ow11 and Ow12 sites were set to 1 and 0.5, respectively. The average length of hydrogen bonds obtained in optimised structural models was calculated to be 1.93 Å for water molecules both at Ow11 and Ow12 sites.
The structural geometric parameters of the optimised models match well with the calculated values for the experimentally obtained crystal structure of natural fluorcarletonite and carletonite (see Table 5 and Supplementary Table S9). The average bond lengths for Si atoms in the simulated and experimental models vary within 1.62–1.63 Å and 1.61–1.62 Å, respectively. The average distances for the K-polyhedra are 2.98–3.01 Å (simulated model) and 2.99 Å (experimental model) for fluorcarletonite and 2.97–2.99 Å and 2.98 Å for simulated and experimental models of carletonite, respectively; and the <Ca–O> distances are 2.44–2.46 Å and 2.45–2.47 Å vs 2.46 Å for simulated and experimental models of fluorcarletonite and carletonite, respectively. The average C–O distance in the carbonate group is 1.30 Å for the optimised and 1.29 Å for the experimental models, respectively. There are some differences only observed in the Na polyhedra when comparing the simulated models with the natural fluorcarletonite and carletonite crystal structures. The lower limits of the average Na–O distances in the simulated models are slightly lower than in the experimental ones with <Na–O> values ranging from 2.39 to 2.51 Å and from 2.40 to 2.51 Å in the experimental models of fluorcarletonite and carletonite, respectively, whereas in the simulated ones, these values are equal to 2.35–2.50 Å and 2.33–2.50 Å, respectively.
The analysis of the tables shows that the calculated geometric parameters generally fall within the ranges of values obtained for the simulated and experimental models. As the optimised models exhibit minimal structural deviations, we further believe that the absorption spectra obtained by the ab initio modelling is feasible.
The calculated optical absorption spectra of (CO3)•–1 is given in Fig. 10. The lowest energy transition occurs at 668 nm (1.87 eV) and has 0.022 oscillator strength. This transition corresponds to the excitation of an electron located at 4b2 to 5b2 molecular orbital of (CO3)•– within C2v symmetry and is of 2B2 → 2B2 type. The second transition with 0.14 oscillator strength occurs at 475 nm (2.61 eV). This corresponds to electronic excitation from 8a1 to 5b2 molecular orbital and is of 2B2 → 2A1 type.
(a) Calculated optical absorption spectra of (CO3)•–1 in fluorcarletonite at C1 site; and (b) molecular orbitals of (CO3)•– involved in transitions at 475 nm (top) and at 662 nm (bottom).

The calculated optical absorption spectra of (CO3)•–1–8 are given in Fig. 11. The spectra of (CO3)•– located at C1 and C2 have different intensity ratios for peaks located near 470 nm and 650 nm: for (C1O3)•– the peak near 650 nm is more intense than the peak near 470 nm which agrees with experimental data. However for the (C2O3)•– spectrum the intensity ratio is reversed.
Calculated optical absorption spectra of (CO3)•– in fluorcarletonite: (a) (CO3)•– located at C1 (C2v point group); and (b) (CO3)•– located at C2 (Cs point group).

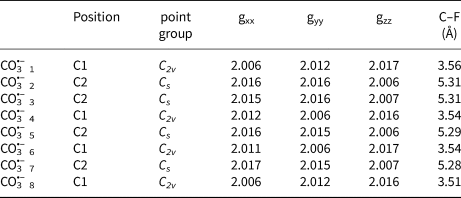
The summary of calculation results for (CO3)•– is given in Table 6.
Calculated point groups, g-tensor components and C–F distance for different (CO3)•– radicals in fluorcarletonite.

The densities of electronic states of fluorcarletonite and carletonite are quite similar (Fig. 12). The top of the valence band (VB) in both crystals is formed by 2p states of oxygens which belong to CO3 groups (Fig. 12c). These states are slightly hybridised with Ca 4s states. The occupied fluorine 2p states in fluorcarletonite are located deep in the VB. The electronic band gap estimated within PBEsol exchange-correlation functional is ~4.5 eV. The bottom of the conduction band (CB) is formed by CO3 related oxygen and carbon states.
Calculated density of states for (a) fluorcarletonite and (b) carletonite; and (c) electronic charge density corresponding to states at the top of the VB in fluorcarletonite.

Discussion
The blue colouration of fluorcarletonite and carletonite is due to the presence of an absorption band in the 450–750 nm region (Fig. 4). An anisotropic ESR signal is also observed in the initial samples (Fig. 6). The intensity of the absorption band and the ESR signal decreases with sample annealing (Fig. 5) and returns after X-ray irradiation. This indicates that the nature of the staining is related to radiation-induced defects.
Similar absorption bands and ESR were observed previously in other irradiated materials containing carbonate anion groups (CO3)2–, including cancrinite (Shendrik et al., Reference Shendrik, Kaneva, Radomskaya, Sharygin and Marfin2021; Kaneva and Shendrik, Reference Kaneva and Shendrik2022), calcite (Chantry et al., Reference Chantry, Horsfield, Morton and Whiffen1962; Serway and Marshall, Reference Serway and Marshall1967), irradiated Maxix beryl where (CO3)2– anion groups are located in channels (Pinheiro et al., Reference Pinheiro, Krambrock, Guedes and Spaeth2007). The observed ESR and absorption bands are associated with the formation of (CO3)•– hole radicals.
Thus, the blue colouration of fluorcarletonite and carletonite crystals is also due to the presence of (CO3)•– radicals that were formed due to the natural irradiation of them. This conclusion is confirmed by the excellent agreement between the experimental absorption and ESR spectra and ab initio calculations (Figs 4 and 6).
In the electronic structure of fluorcarletonite, the CO3 related electronic states are located just below the top of the VB. Therefore, in the excited state, the singly occupied electronic state in (CO3)•– which has type 5b2 in terms of the C2v point group (Fig. 10) is expected to occur within the band gap of the crystal. However, the hole state located at 5b2 is also expected to move to the band gap. Therefore the absorption within the 450–750 nm range corresponds to intramolecular transitions within the (CO3)•–, occurring within the band gap of the crystal.
The observed absorption band in the 450–700 nm region is attributed to electronic transitions from the basic 12B2 term to the excited 22B2 state in the molecular complex (CO3)•–, where the hole is localised on the 2p orbital of oxygen (Olsen and Burnelle, Reference Olsen and Burnelle1970; Moseley et al., Reference Moseley, Cosby and Peterson1976). This transition has a sufficiently high oscillator strength equal to 0.013–0.021 (for different (CO3)•–). The obtained oscillator strength agrees well with that calculated earlier for calcite in Chantry et al. (Reference Chantry, Horsfield, Morton and Whiffen1962). According to Smakula's formula (Smakula, Reference Smakula1930), we can calculate the concentration of carbonate radicals in the studied sample of fluorcarletonite as 5.84⋅1018 cm–3. A second transition at ~500 nm has a lower oscillator strength.
The absorption band observed in the experiment has a vibrational structure. The position of the peaks corresponds well to the measured vibrational modes for (CO3)•– radicals in Moseley et al. (Reference Moseley, Cosby and Peterson1976), Bisby et al. (Reference Bisby, Johnson, Parker and Tavender1998) and Shkrob (Reference Shkrob2002). In our case, the distances between phonon peaks are at ~1130, 1040 and 620 cm–1. These values are close to those obtained in Bisby et al. (Reference Bisby, Johnson, Parker and Tavender1998) for (CO3)•– radicals in sodium persulfate: 701, 1062 and 1159 cm–1.
The temperature dependence of the stability of carbonate radicals (Fig. 5) shows that their ground states are located relatively deep in the band gap. The depth of the trap can be estimated from the Garlick–Gibson approximation (Garlick and Gibson, Reference Garlick and Gibson1948). The thermally stimulated bleaching of fluorcarletonite and carletonite is not described by first order kinetics because at least two non-equivalent configurations of the hole (CO3)•– centres exist. According to structural data two non-equivalent (CO3)2– complexes are found in the unit cell. The (CO3)•– hole trap depth is in the order of 1.1 eV. Thus, (CO3)•– radicals begin to decompose at sufficiently high temperatures, which makes fluorcarletonite and carletonite promising as the basis for materials that are generators of carbonate radicals.
At room temperature, the wide luminescence band peaked at ~400 nm is attributed to Ce3+ ions in fluorcarletonite and carletonite (Fig. 7). A similar luminescence has been observed previously in other silicate minerals such as agrellite (Kaneva et al., Reference Kaneva, Shendrik, Mesto, Bogdanov and Vladykin2020b), fedorite (Kaneva et al., Reference Kaneva, Shendrik, Radomskaya and Suvorova2020c), and in many other alkali silicates (Gaft et al., Reference Gaft, Reisfeld and Panczer2015). The Ce3+ ions can substitute Ca2+ ions. Four bands in the excitation spectrum are related to transitions from the ground 4f state of Ce3+ ion to the 5d state split in the crystal field of the low-symmetry Ce–O ligand. Despite the quite similar structure, the positions of the peaks in the excitation and emission spectra of fluorcarletonite and carletonite are slightly different from each other. The Ca2+(Ce3+) ligand in fluorcarletonite and carletonite has the same symmetry group, however, mean distances between Ca2+(Ce3+) and oxygen ions are different according to structural data. The slightly different crystal field leads to differences in excitation and emission spectra of fluorcarletonite and carletonite.
At lower temperatures, another intense band appears (Fig. 8); at the same 440 nm position in both fluorcarletonite and carletonite. This luminescence is excited in the region of fundamental absorption. Analysis of its temperature behaviour (Fig. 9) and excitation spectrum ((Fig. 8) let us assume that this luminescence could be attributed to the intrinsic luminescence of fluorcarletonite and carletonite. This luminescence is registered first time in phyllosilicates. Luminescence in the region of 2–3 eV corresponds to the decay of electronic excitations of (CO3)2– complexes in cancrinite (Kaneva and Shendrik, Reference Kaneva and Shendrik2022). Ab initio calculation shows that excitation peaks at ~50000 cm–1 are attributed to transitions from 2p oxygen states to mixed C and O 2p and 2s and Ca 3d states in fluorcarletonite and carletonite (Fig. 12).
In cancrinite UV irradiation with photons having energy at ~50,000 cm–1 creates (CO3)•– radicals, however this does not occur in fluorcarletonite and carletonite. It has been shown that the creation of radiation defects in cancrinite is associated with the decay of electronic excitations into a hole and electron defects. A hole defect is a (CO3)•– radical and an electron defect is a vacancy capturing an electron (Kaneva and Shendrik, Reference Kaneva and Shendrik2022). Halogen vacancies require substantially less energy than oxygen or cation vacancies. However, chlorine vacancies are formed in cancrinite. There is less energy to create chlorine vacancy in comparison with the fluorine ones. Therefore, the threshold energy of formation of radiation defects in fluorcarletonite and carletonite is higher and lies in the region of energies above 66,000 cm–1, which is confirmed by our experiment.
Regarding the localisation of (CO3)•– defects responsible for colouration, the following considerations could apply as the CO3 located at C1 and C2 crystal-chemical sites possess different characteristics. The point symmetry for C1O3 is C2v, whereas it is Cs for C2O3; the oscillator strengths for the lowest-energy optical transition is 0.020 for C1O3 and 0.015 for C2O3; and the C1 is closer to the F site than the C2 (~3.5 Å vs ~5.3 Å). Assuming that (CO3)•– is formed in fluorcarletonite due to the decay of electronic excitation into the F-centre at the fluorine site and (CO3)•– radical, the latter is expected to form close to the F site, i.e. at C1. This is confirmed by agreement between measured absorption spectra and spectra calculated for (C1O3)•– (Figs 4 and 11).
The C1O3 diradicals are further distinguished into two groups: one is oriented approximately parallel to the bc plane and the other parallel to the ac plane. For the first one the gxx and gzz are 2.006 and 2.016–2.017, respectively. For the other gyy and gzz are 2.006 and 2.016–2.017, respectively. From the ESR experiment, g || and g ⟂, are 2.008 and 2.016, respectively. Therefore, we can conclude that (CO3)•– is located at the C1 site.
Conclusions
Natural fluorcarletonite and carletonite are not just structural analogues; they are minerals that have their own individual characteristics, as well as similarities.
This detailed crystal-chemical investigation has revealed features, some of which have not been noted previously for the compounds. In the crystal structure of carletonite the K atom is split over two different positions, populated by ~89 and 6%, whereas the K site in fluorcarletonite is ordered, although the geometrical and structure distortion parameters in the samples studied have quite similar values. The fluorcarletonite specimen, compared to carletonite, has significantly higher F and K and lower Na and Ca content.
The complex computational approach that combines ‘periodic’ and ‘molecular’ ab initio calculations was applied to investigate the nature of the blue colouration of fluorcarletonite. The results of simulations are in agreement with experimental findings that (CO3)•– hole defects are indeed responsible for the colouration of the fluorcarletonite and carletonite samples studied. The analysis of optical absorption spectra and values of the g-tensor suggest that localisation of (CO3)•– defects in the crystal structure takes its place at C1 sites.
The photoluminescence attributed to 5d–4f transitions in Ce3+ ions located is found at ~400 nm. The intrinsic luminescence due to electronic excitation decay near (CO3)2– complexes is observed at ~440 nm. The (CO3)•– radicals are formed in carletonites due to the electronic excitation decay.
Acknowledgements
This research was supported by the Russian Science Foundation (project no. 22–27–00183, https://rscf.ru/project/22-27-00183/). The authors thank Pavel Plechov and Mikhail Mitichkin who donated the carletonite and fluorcarletonite samples studied in this work. The study was carried out using the facilities of the Centers for Collective Use: “Center for isotopic-geochemical investigations” at the Vinogradov Institute of Geochemistry SB RAS and “Baikal analytical center for collective use” at the Favorsky Irkutsk Institute of Chemistry SB RAS. We are grateful to the Irkutsk Supercomputer Center of SB RAS for providing computational resources of the HPC-cluster «Akademik V.M. Matrosov» [HPC1] to perform calculations using the programs. We are also grateful to the Supercomputing Center of the Novosibirsk State University for provided computational resources [HPC2]. We are grateful to reviewers for their valuable comments.
Supplementary material
The supplementary material for this article can be found at https://doi.org/10.1180/mgm.2023.15.
Competing interests
The authors declare none.