1. Introduction
Many scholars now accept that, at some point during the last forty years, the United States transitioned from a Fordist economy rooted in mass production to a post-Fordist “knowledge economy.” However, there is surprisingly little consensus about how we should define or characterize the knowledge economy we now inhabit. One view, popular among economists since the emergence of new growth theory in the 1990s, suggests that the knowledge economy is rooted in rapid technological change and the prospect that firms and nations can generate competitive advantages by focusing on the generation of ideas rather than the manufacturing of products.Footnote 1 From this perspective, many forms of state action can promote technological change, but the most important policies are those pertaining to intellectual property (IP), as these policies surmount a free-rider problem endemic to the innovation environment: Firms and nations that invest in developing new technologies often struggle to appropriate the economic benefits of those investments in the absence of some form of legal protection because subsequent actors can simply copy the first mover.Footnote 2 Because certain forms of IP, especially patents and trade secrets, resolve this problem and enhance the incentive to invest in technological development, “economists have long seen the patent system as a crucial lever through which policymakers affect the speed and nature of innovation in the economy.”Footnote 3 Thus, one would accordingly expect the knowledge economy transition to intensify the degree to which business managers and government actors come to view intangible IP, rather than labor and machines, as the “key economic asset that drives long-run economic performance.”Footnote 4
Despite its prevalence in economic thinking, the view that the American knowledge economy (AKE) is organized around the production and utilization of IP has gained only marginal acceptance among political scientists.Footnote 5 Rather, the knowledge economy is more often conceptualized as a by-product of technologically based shifts in the occupational structure and the increasing economic and political power of educated workers, an idea that dates back at least to Daniel Bell's theory of the post-industrial society.Footnote 6 Accordingly, some follow Bell in relating the knowledge economy to the “service transition,” the long, gradual shift in the share of national income flowing from the provision of services rather than the production of goods, and to post-industrialism more broadly.Footnote 7 Others contend that IP plays only a marginal role in the knowledge economy because technology is more firmly rooted in the skills of educated workers.Footnote 8 Though also rooted in economic thinking, these perspectives borrow less from new growth theory and more from the theory of skill-biased technological change, in which technological advances in computing asymmetrically reward those middle-class, better-educated workers who can use computers to become more productive.Footnote 9 To the extent that such theories identify an economic asset at the root of the knowledge economy, they generally point to human capital or “skills” and downplay the role of IP.Footnote 10
If there is disagreement about whether the institutions of the AKE are geared toward IP production or human capital formation, there is also disagreement about the political forces shaping AKE development. Two prominent theories, one associated with Iversen and Soskice and one with Hacker et al., agree that knowledge economies are politically constructed and that the state plays a major role in shaping knowledge economy development.Footnote 11 But the theories have starkly different views on which actors have political power in relation to the state and the ways in which those actors have shaped the institutions of the AKE. Iversen and Soskice contend that knowledge economy policies are produced at the behest of decisive middle-class voters who strongly demand policies that promote human capital formation. They write, for example, that because the “advanced sectors” of the knowledge economy are “skill intensive,” education is “by far the most important path” to inclusion in the knowledge economy, and so decisive aspirational voters who are invested in the knowledge economy or want their children to participate in it support policies that favor these sectors, “notably through investment in education and research and development, coupled with strong competition rules.”Footnote 12 Iversen and Soskice contend that, when combined with the geographic immobility of knowledge economy workers on which the advanced sectors depend, this intense electoral connection means that capital does not have structural power and that business interests are therefore politically weak.Footnote 13
In contrast, a group of scholars working to establish a new field of American political economy suggests that American political institutions are unique in ways that give a strong advantage to organized business interests.Footnote 14 For this group of scholars, American political institutions are exceptional in the extent to which they divide political power among multiple venues, both horizontally between branches of government and vertically between national and subnational levels of government. In this perspective, these unique characteristics of American political institutions make policy change extremely difficult in the United States, especially when it comes to national policies that shape the macroeconomic order. These factors also give a decisive advantage to organized interests over ordinary voters by opening multiple venues to contest proposed policy changes and defend the status quo, especially for those organized business interests that have the resources and patience to navigate the nation's complex institutional landscape and repeatedly defend their demands over long time frames. Accordingly, “despite frequent elections and the valorization of representative government, voter influence in American politics is highly mediated and conditional.”Footnote 15 These scholars also contend that these forces explain why the United States has lost its dominant position in providing key public goods that promote knowledge economy development, like higher education and the public financing of research and development (R&D).Footnote 16
The key claim advanced in this article is that, when we focus on the policy outputs and institutional changes that facilitated the knowledge economy transition, the theory advanced by the American political economy group better fits the historical data. During the crucial years of knowledge economy formation, from 1980 to 1994, many of the policies demanded by aspirational middle-class voters, from increased spending on R&D or higher education to more robust forms of industrial policy, failed to materialize, while the policies demanded by technology firms and their business managers, chiefly patent reform and decreased antitrust scrutiny, enjoyed easy bipartisan support. Iversen and Soskice's theory of advanced capitalist democracies does describe some of what happened within the Democratic Party in the United States, as some within the party tried to advance policies that had broad appeal to highly educated, increasingly suburban, middle-class constituents. But from 1980 to 1994, the Democratic Party enjoyed unified control over government in only two years and faced significant obstacles to policymaking even then. Accordingly, in a setting of divided government and an increasing partisan divide over the proper role of the state in managing the macroeconomic order, Democratic aspirations were effectively narrowed to a subset of market-oriented reforms that would strengthen and expand the global reach of IP rights and reduce antitrust scrutiny of high-tech businesses. It is in this sense that the AKE is organized around the production and private-sector utilization of IP and not human capital formation.
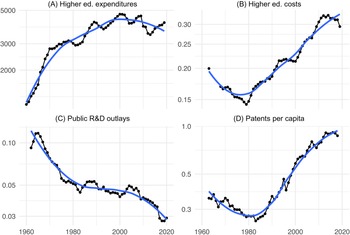
The argument can be summarized pictorially with the four graphs displayed in Figure 1, each of which shows the time-series evolution of an important knowledge economy policy indicator for the sixty-year period between 1960 and 2020. Panel A shows that per capita tax appropriations for higher education (spending per adult aged 18–24) grew dramatically during the prior Fordist period, but grew much more slowly between 1980 and 1994 and ultimately plateaued around the year 2000. Similarly, Panel B shows that the average cost of tuition and fees at four-year colleges relative to the median family income declined during the prior Fordist period but then increased dramatically after 1980. Together, these two graphs suggest that, to the extent there was a period in which decisive voters succeeded in demanding increased public financing to make higher education more affordable for the median family, it was the prior Fordist period. When Ronald Reagan took office in 1981, a majority of adults in nationally representative surveys believed that the nation was spending too little on improving the nation's education system (a margin that grew to 67 percent during his tenure), and much larger majorities of registered voters (78 percent) opposed seeking a balanced budget if it meant spending less on education.Footnote 17 And yet these demands failed to materialize into policy changes that would make a college education more affordable for the median family. Similarly, Panel C shows that federal outlays as a share of the total budget (the trends are similar when shown as a share of gross domestic product, GDP) declined substantially after the mid-1960s, and that trend has continued to the present day. In these and other ways, as the knowledge economy transition accelerated, the U.S. government failed to meaningfully respond to the demands of aspirational middle-class voters in the way predicted by Iversen and Soskice.Footnote 18 But elected officials were capable of generating bipartisan consensus in favor of patent reform, as described herein, and the outpouring of new legislation and policy they passed dramatically reversed the long, slow decline in domestic per capita patent applications that characterized the prior Fordist period, as shown in Panel D.
Each panel in this figure displays a time-series showing how various economic indicators evolved between 1960 and 2020. Panel A shows total state tax appropriations for higher education at the state level, in 2019 dollars, per collage age adult (18–24). Panel B shows the average undergraduate tuition and fees paid to degree granting institutions as a percentage of the national median family income. Panel C shows federal outlays for research and development (R&D) as a share of the total budget. Panel D shows the annual number of utility patents of U.S. origin applied for on a per capita basis (patents per thousand people). The vertical axes in all plots are displayed on the log scale to make it easier to visualize changes within periods. The blue line in each plot is a smoothed representation of the data that enables better visualization of the underlying trends. Higher education expenditures come from annual Grapevine reports housed by the College of Education at Illinois State University. Data on the population (both the college age population and total population) and the median family income come from the Federal Reserve Bank of St. Louis. Data on undergraduate education costs come from the 2020 Digest of Education Statistics housed by the National Center for Education Statistics, Table 330.10. Data on federal R&D outlays come from the Historical Trends in Federal R&D data sets maintained by the American Association for the Advancement of Science. Annual patent data come from the U.S. Patent Statistics Chart of the U.S. Patent and Trademark Office.

In the argument that follows, I adhere to a long tradition in comparative political economy by assuming that modes of economic production (or growth regimes) are politically negotiated, and I turn to the historical record to understand the political moment in which the idea of a knowledge economy took hold in American politics and to analyze the ways in which that political movement altered central institutions of American political economy.Footnote 19 The analysis reveals, first and foremost, that the AKE is not about the production of knowledge per se—which was equally important during the Fordist era and the Cold War—nor is it a growth regime geared toward increasing economic opportunities for the electorate through education and training. It is instead a growth regime organized around the production and private-sector utilization of IP. Political representatives remained committed to producing technological knowledge to maintain military supremacy and produce economic prosperity in both periods. Where the AKE differed was in the political consensus about who would own and control the dissemination of that knowledge. Accordingly, I define the AKE as a politically negotiated plan for generating economic prosperity wherein the production of commodified technological knowledge, or IP, is the primary means for achieving economic development.
Beyond identifying the relationship between the AKE and IP, an analysis of AKE development produces other important insights for political scientists. I will emphasize three such contentions in the argument that follows. The first is that, while the AKE ultimately generated strong bipartisan support, the Democratic Party was always its most forceful advocate. In the crucible of the 1970s and early 1980s, a neoliberal faction within the Democratic Party—the “Atari Democrats”—successfully pushed the party to embrace the knowledge economy as an alternative to Keynesianism that was distinct from the Republican alternative, which was oriented around market fundamentalism. Their initial visions were relatively ambitious as they saw technology not only as a means to provide hope for communities experiencing deindustrialization but also as a means to address social problems like environmental degradation and resource depletion. But those more capacious visions of the AKE foundered in a divided government led by a president who believed the state had a limited role to play in a capitalist society. The consensus that emerged therefore centered on a much more limited set of market-oriented reforms to strengthen and expand IP rights. The “lost alternative” of this formative period, from 1980 to 1994, is one where the state could have played a much stronger role in facilitating and harnessing technological development to produce desirable social outcomes.Footnote 20 Some of the most politicized moments of AKE development involve Democratic attempts to recapture this lost alternative, as President Clinton discovered with the Advanced Technology Project and President Obama discovered with Solyndra.Footnote 21
The second contention is that, in addition to Democratic Party leaders, IP producers and the subset of professionals that service IP producers, like IP attorneys and venture capitalists, are the key political actors in the story of AKE development, not decisive middle-class voters. Though knowledge economy rhetoric naturally offers much to those who value education as a source of status and a vehicle for economic mobility, and though this made the knowledge economy more attractive to Democratic rather than Republican Party officials in the 1980s, political discourse about the AKE in its formative years was fundamentally about identifying the decisive businesses, not the decisive voters, that would restore the nation's military and economic supremacy. Accordingly, organizations representing IP producers, not middle-class voters, played a pivotal role in altering central institutions of American political economy—from the courts to universities to institutions for negotiating multilateral trade agreements—to hasten AKE development.
The lobbying successes that IP producers enjoyed from 1980 to 1994 are somewhat striking and counterintuitive because IP producers are an extremely heterogeneous bunch. Private-sector IP producers hail from many different industries and sectors of the economy and include brand name (Pfizer and Merck) rather than generic drug companies; the designers of genetically modified plants and seeds (Monsanto and DuPont) rather than farmers; and a host of well-known internet search (Google), software (Microsoft), and computer technology (IBM and Apple) companies. But universities and the consortia in which they partner with private firms are also IP producers. Despite their diversity, IP producers are united by a common interest in maximizing the rents they can generate from their most important capital asset, their IP.Footnote 22 Bound by this common interest, and backed by political leaders who believed the nation's economic and military supremacy depended on that same outcome, IP producers successfully negotiated dramatic changes in the institutions of American political economy.Footnote 23 And these institutional changes, in turn, dramatically reversed the slow reduction in domestic IP production that unfolded throughout the 1960s and early 1970s (see Figure 1, Panel D) and that symbolized, for many, American technological decline.
A third insight is that, by making AKE development depend so intensely on IP, Democratic Party leaders all but had to abandon their party's historical animosity toward rising industrial concentration and market power. The ideological pressures on the party to jettison its historical commitments to robust antitrust enforcement came from several quarters, including a broader neoliberal critique that global integration, rather than government oversight through antitrust agencies, would better secure the conditions needed to keep American businesses engaged in intense competition.Footnote 24 But the party's newly developed commitments to the AKE also motivated this shift. When President Reagan took office, the two biggest antitrust suits that remained on the books were those against technological leaders AT&T and IBM, and Reagan's top antitrust official quickly dispatched both.Footnote 25 When Democrats regained the presidency in 1992 and had the opportunity to enhance antitrust enforcement, the political consensus behind the AKE had gathered substantial momentum, and companies like AT&T and IBM had become the U.S. equivalent of national champions. After going to such great lengths to broaden and strengthen IP rights to increase the global market power of the nation's technology titans, the party could not reasonably restore a system of more interventionist antitrust oversight that might halt the titans’ progress. The ideological tension created by this aspect of AKE development continues to generate intraparty conflict today, as progressive reformers call for breaking up some of the nation's biggest technology firms.
Many popular accounts of the Democratic Party's turn toward the knowledge economy emphasize the work of the New Democrats, led by Bill Clinton, after his victory in the presidential election of 1992. Admittedly, the Democratic Party's relationship to Silicon Valley was fully evident by the late 1990s when John Doerr, one of the nation's most prominent venture capitalists, had the vice president's personal phone number on his speed dial and routinely organized teams of high-tech business managers to lobby the Clinton administration on everything from securities litigation reform and stock-option accounting to H1-B visas and charter schools.Footnote 26 But in this article, I view Clinton's victory in 1992 as the logical culmination of political forces that came into being roughly twenty years earlier when George McGovern won the Democratic Party's nomination in the presidential race of 1972. Those forces produced substantial institutional change, hastening AKE formation during the Reagan and H. W. Bush administrations, but had mostly played out by the time Bill Clinton took office.
The argument is organized as follows. In Section 2, I characterize the “historical site of change” encapsulated by the postwar consensus on macroeconomic policy and technological development, emphasizing the network of interrelated institutions that this consensus produced.Footnote 27 To emphasize that technological innovation was extremely important during this period, I will refer to this institutional matrix collectively as the American knowledge society (AKS). In Section 3, I show how Atari Democrats and IP producers substantially altered this institutional matrix to hasten AKE development, focusing on three different geographies of political activism. Though the AKE is mostly a product of national politics, it is situated within a global knowledge economy from above and is abutted by entrepreneurial states from below. The history of AKE development conveyed in this section supports the claim that the AKE is fundamentally about IP, that Democratic Party officials and IP producers played a pivotal role in designing the institutions that continue to shape AKE development today, and that the Democratic Party's turn toward the AKE forced it to abandon its past concerns about market power. In lieu of analyzing a single component of AKE development or offering a single in-depth case study, I survey multiple important institutional changes to provide an overarching framework for understanding AKE development that might motivate future studies in greater historical depth. In Section 4, I conclude by summarizing the argument and suggesting the ways in which contemporary politics is still shaped by the difficult political choices and outcomes generated in the AKE's formative years.
2. Political Institutions of the American Knowledge Society
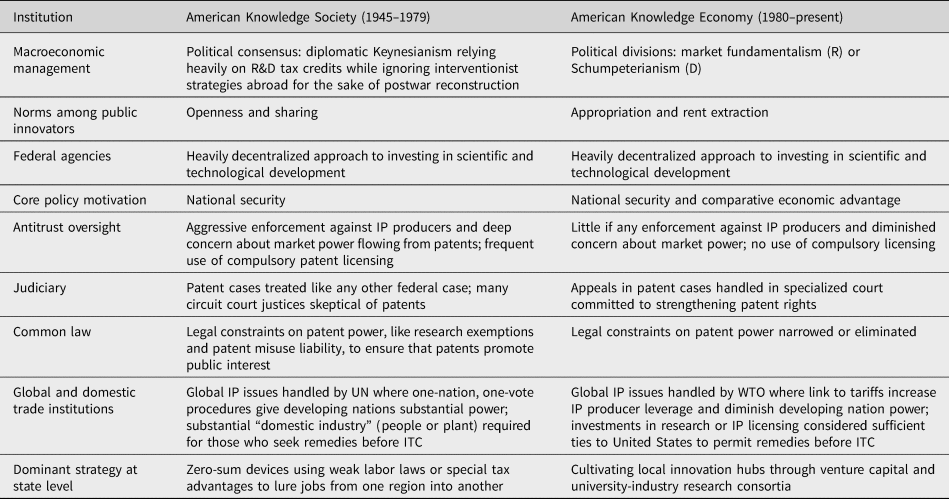
The postwar political consensus on economic policy and technological development, and the institutional matrix that this consensus produced, has nine major components (summarized in Table 1). First, in terms of macroeconomic management, both parties relied primarily on Keynesian tools for increasing aggregate demand, like robust social welfare policies that would increase consumption. In doing so, both parties were guided by the belief that these tools would create an economic environment conducive to maximizing aggregate private-sector investments in R&D.Footnote 28 In contrast, the United States did not engage in the kinds of centrally coordinated microeconomic investment policies, or industrial policies, that—when paired with more orthodox fiscal policies for running budget surpluses—lay at the heart of postwar economic management in Germany and Japan. At the same time, international economic policy remained subservient to a foreign policy that prioritized the security benefits attained from rebuilding the economies of formerly fascist powers over the economic interests of domestic manufacturing firms. Accordingly, domestic manufacturers found themselves competing not with foreign firms but with foreign governments in an increasingly global marketplace.Footnote 29
The AKS and AKE Differ Mostly in Their Approach to IP

Note: This table shows the main differences and similarities between the political institutions and policies that shaped innovation during the Fordist period, which I refer to as the American knowledge society (AKS), and those that shaped and continue to shape the American knowledge economy (AKE) of today.
The political consensus underpinning this form of diplomatic Keynesianism slowly evolved to recognize two domains in which the federal government would take a more proactive role in facilitating technological development. In 1950, Congress created the National Science Foundation (NSF) to invest federal money in the kinds of precommercial scientific research usually conducted in universities, and to distribute those monies according to a meritocratic system of peer review. In articulating the NSF's role, Congress sided mostly with MIT engineer and Raytheon founder Vannevar Bush over alternatives advocated by progressive Senator Harley Kilgore. Kilgore had hoped to create a robust central agency for coordinating a science policy developed not just by elite scientists but also by a broader range of interests, including labor. Kilgore also believed that the NSF should promote competition rather than IP-based monopolies by investing in applied research and using nonexclusive licenses to disseminate the fruits of publicly funded research. Bush proved more politically adept. Congress ultimately created an agency that would be somewhat insulated from politics and would not interfere with corporate prerogatives on technological development or practice industrial policy.Footnote 30
At the same time, ownership of patents on publicly funded technologies remained with the federal government, and federal institutions developed a practice of broadly distributing IP through nonexclusive licensing, consistent with Kilgore's preferences. These norms of sharing and openness, held by government and university officials alike, are the AKS's second major feature. Some universities did petition federal agencies for the power to manage their own patents, but in their licensing agreements with private firms, those universities often followed the federal government's practice of using IP to promote competition. For example, Stanford University licensed the Cohen-Boyer patents on recombinant DNA technology, the patents that launched the biotechnology revolution, on a nonexclusive basis to hundreds of organizations, despite private opposition from firms like Genentech and Cetus, because that approach was believed to be more consistent with the public-service ideals of the university.Footnote 31 As this example reveals, IP producers in the AKS were often divided because they had different institutional motivations, with public IP producers like government agencies and universities expressing norms of openness and sharing over norms of appropriation.
Slowly, a political consensus also emerged that existing financial institutions did not sufficiently invest in the small businesses, or start-up companies, that could create new technological products to compete with those offered by more established firms. Accordingly, President Eisenhower first agreed to create a modestly funded Small Business Administration (SBA) if Congress would eliminate the Reconstruction Finance Corporation in 1952. And in 1958, Congress gave the SBA the power to support and oversee privately operated Small Business Investment Companies (SBICs) that would lend to and purchase stock in promising small businesses. The Kennedy administration aggressively promoted SBICs, and in the early years, while only 10 percent of SBIC funds accrued to technology start-ups, the SBICs would ultimately lay the groundwork for the modern venture capital industry.Footnote 32
The way in which these early political debates unfolded ultimately committed the United States to a heavily decentralized and unplanned form of science and technology policy, which is the third component of the AKS's institutional matrix.Footnote 33 Part of the reason the NSF could not obtain a broader mandate is that, in the eight years (from 1942 to 1950) that it took to achieve consensus over its founding, Congress created other agencies—the Atomic Energy Commission, the Office of Naval Research, the Joint Research and Development Board, and the National Institutes of Health—that had jurisdictional claims on the nation's technological development. These institutions then opposed the political effort to consolidate and centralize power under the umbrella of the NSF. The federal government achieved some coordinating power with the creation of the Office of Science and Technology (the predecessor of the modern Office of Science and Technology Policy) within the White House in 1962, but having no power over the aggregate research budget, it would play a more limited role by wrangling the pluralist system of agencies with scientific priorities.Footnote 34
As the Cold War unfolded, the basic Keynesian consensus that produced the AKS merged much more deeply with the national interest in developing technologies to meet national security imperatives, the fourth component of the AKS's institutional setting. In 1950 the Korean War began, and in 1957, the Soviet Union placed the first artificial satellite into orbit. Though national security imperatives influenced most if not all federal institutions of scientific and technological development,Footnote 35 those imperatives found their most influential expression in the nascent venture capital industry with the creation of the Defense Advanced Research Projects Agency (DARPA) in 1958. The federal government always had the power to shape the technological prerogatives of its defense contractors through the procurement process, but this required massive amounts of investment, and the government's flexibility virtually dissolved upon entering into a contract. DARPA proved that the government could use much smaller amounts of money to generate intense competition for the development of new technologies on ambitious time frames, especially since its legislative authorization removed the elaborate grant-writing and refereeing procedures utilized by the NSF and gave the agency the discretion to start and stop funding as it deemed necessary.Footnote 36 But even outside of DARPA, the AKS nurtured deep ties with the national security state in both civilian venture capital and academic research.Footnote 37
In the AKS of the postwar period, patents were an established but contentious policy tool for promoting technological development. In 1938, President Roosevelt appointed patent reformer, Thurman Arnold, to lead the antitrust division of the Department of Justice (DOJ). Arnold viewed patents as a monopolistic device that enabled corporate managers to inhibit technological development, create cartels, raise prices, and stifle economic growth. Arnold and his successor, Wendell Berge, could not convince Congress to reform the nation's patent laws, so they instead deployed the full force and power of the DOJ against established corporations with large patent holdings. During Arnold's five-year tenure, the DOJ instituted 213 investigations and ninety-three lawsuits, almost as many as had been filed over the prior forty-eight years, and Arnold and Berge together succeeded in forcing corporations to license their patents more broadly (compulsory licensing) in at least 107 cases involving about 40,000 patents. Aggressive levels of antitrust enforcement in turn influenced business strategy, as established firms turned away from the practice of acquiring the technology of emerging competitors to focus instead on promoting in-house R&D.Footnote 38 Patents remained a constitutionally sanctioned tool to protect investments in new technologies, but antitrust officials heavily policed the anticompetitive risks flowing from the acquisition of large, valuable patent portfolios. The DOJ's commitment to policing patent abuse constitutes the fifth feature of the AKS.
A sixth feature of the AKS was that patent lawsuits were treated just like any other case involving federal law: the case was first tried in a local district court, and then, if either of the parties appealed the case, the appeal went to the regional circuit court. This institutional structure created opportunities for circuit splits on important legal questions as the circuit courts adopted conflicting perspectives that only the Supreme Court could reconcile. Patent cases were no exception, and most of the circuit courts viewed patents with skepticism (consistent with prevailing attitudes at the DOJ), though at least three circuits developed a more pro-patent reputation. Members of Congress accepted the conflict that this structure created because it tended to sharpen legal arguments before the Supreme Court was asked to intervene. But they also believed that distributing power among several circuit courts would help to avoid the problems of regulatory capture that could arise with courts of specialized jurisdiction. In 1975, for example, a special Commission rejected a proposal to create a special court that would hear all appeals in patent cases nationwide, warning that the judges would suffer from “tunnel vision” and be susceptible to the influence of special interests.Footnote 39
Seventh, the antipatent skepticism protected by the judiciary's structure inspired the development of a body of federal case law that imposed restraints on the use of patents. For example, though exploratory R&D could technically cause a firm to be liable for patent infringement, a common law “research exemption” protected those who made or used a patented invention for purposes of testing the patent's written disclosure and determining whether the invention worked as claimed.Footnote 40 Similarly, the doctrine of sovereign immunity shielded state universities and agencies from patent infringement liability.Footnote 41 The defense of “patent misuse” allowed those accused of infringement to avoid liability by showing that the patent holder acted in derogation of federal patent policy.Footnote 42 When the Supreme Court intervened in patent disputes, it would often emphasize the limits of patent law. In 1969, for example, the Court argued that the Sherman Act “made it clear that the grant of monopoly power to a patent owner constituted a limited exception to the general federal policy favoring free competition.”Footnote 43 Legal doctrines like these created uncertainty in the legal framework governing IP rights, which in turn made it difficult for IP producers to leverage their patents to extract rents.
Eighth, the AKS remained situated in a global economy that prioritized democratic procedures for determining how nations across the globe would adopt and regulate IP production. The Paris Convention for the Protection of Industrial Property of 1883 remained the dominant legal framework at the global level, but the World Intellectual Property Organization (WIPO) within the United Nations took over its administration after 1974. IP issues that did not fall within WIPO's jurisdiction were generally handled by the United Nations Conference on Trade and Development (UNCTAD), which sought to maximize trade, investment, and economic development but also to integrate developing countries into the world economy on an equitable basis, a goal that, according to some, could not be achieved under the General Agreement on Trade and Tariffs. As agencies of the United Nations with broad membership, both WIPO and UNCTAD gave developing nations, including many former colonies, substantial political power in shaping negotiations over global IP rights through its one-country, one-vote procedures.
As has been true throughout American history, much of the initiative for engaging in more activist policies to promote economic development in the AKS resided within the states. At the same time, the dominant policy tools that state governments used to promote economic development were zero-sum devices like promising tax benefits or antilabor policies to lure established businesses away from one region and into another. This dominant approach to regional economic development is the AKS's ninth major feature. The Southern states largely pioneered the use of the devices, and they may have been effective in luring manufacturing into the region, but they also had limitations. State governments often granted these incentives with no strings attached, leaving many in the position of the cuckold after choosing a partner with a history of being unfaithful. Firms that are willing to leave New England for South Carolina might, after all, be just as willing to leave South Carolina for Mexico or China. The zero-sum nature of the incentives also created interjurisdictional conflict, and as more states came to offer the same set of incentives, the devices lost some of their ability to significantly influence managerial decision making. These limitations would become more troubling in the 1970s. Throughout most of the postwar period, these devices remained the primary tool for shaping economic development at the state level, and state leaders used them not to promote technological development but to relocate jobs from one state to another.Footnote 44
In sum, the AKS was rooted in a diplomatic form of Keynesian economic management that subsidized the reconstruction of formerly fascist powers and that used broad, untargeted tools like R&D tax credits to spur investment in new technologies paired with a decentralized matrix of new institutions, like DARPA and the NSF, committed to ensuring the nation's technological supremacy during the Cold War. Firms could and did patent their inventions, but Keynesian tools and defense procurement, not IP, were the preferred mechanisms for incentivizing technological investment in the private sector. On the contrary, antitrust officials aggressively policed anticompetitive abuses by the largest private IP producers, while public IP producers, for their part, remained committed to norms of openness and sharing rather than appropriation. The politics of the AKS was inherently federal as state officials pursued economic prosperity through zero-sum devices that lacked any coherent vision for promoting local innovation, and the skepticism developing nations had toward IP kept global institutions focused on other objectives. Both the institutional structure for adjudicating patent cases and the substance of federal patent law perpetuated skepticism about whether IP played a valuable role in the American political economy.
In all but two of these characteristics, the AKS is distinct from the AKE. When it comes to these nine institutions, the only ways in which the AKE resembles the AKS is in its continued reliance on a heavily decentralized mode of investing in technological development at the federal level and in its deep ties to the national security state. As the Democratic Party turned toward the AKE, and as IP producers became the heroes in the nation's story of economic salvation, the seven remaining components of the AKS would either be abandoned or experience substantial reform.
3. Political Alternatives to Keynesian Decline and the Atari Democrats
The 1970s unraveled the Keynesian consensus that lay at the foundation of the AKS. The postwar project of rebuilding the Japanese and German economies by giving their firms preferential access to American consumers succeeded on a much quicker timescale than anyone had anticipated. As the United States found its dominant position in global technology and commodity markets threatened, its elected officials struggled to develop post-Keynesian alternatives for producing economic prosperity. Traditional tools like tax cuts and government spending could still be used to increase consumption, but as domestic markets became more exposed to foreign imports, more and more of that consumption would accrue to the benefit of foreign producers. The Federal Reserve could lower interest rates to stimulate investment, but at a risk of exacerbating inflation, and with no capital controls, that investment might simply move overseas. Food shortages, rising mortgage rates, and America's dependence on foreign oil cartels produced exceptionally high levels of inflation that elected officials from both parties tried to manage on the backs of American workers, freezing wages and advocating for yet more global competition to reduce prices.Footnote 45 And that inflation accelerated in the midst of economic stagnation, not expansion as Keynes had predicted, creating a pervasive anxiety that the old order was broken and that the nation had found itself in a new and unforeseen state of “stagflation.”Footnote 46
The political failures at the heart of this economic calamity produced, in turn, dramatic changes within both political parties. The Republican Party somewhat quickly settled on an alternative based on the market fundamentalism associated with economists like Friedrich von Hayek and his followers at the Chicago School of Economics. President Reagan interpreted his victory in 1980 as an absolute mandate against Keynesian economics and pursued a radically different vision rooted in tax cuts financed by foreign borrowing, expansive deregulation, and greater global economic and financial integration.Footnote 47 In practice, Republican leaders still relied on Keynesian tools like deficit spending to manage the macroeconomic order, especially defense spending. And parts of their agenda had bipartisan origins. The deregulatory movement, for example, began with President Carter and continued to draw support from some factions within the Democratic Party during President Reagan's tenure.Footnote 48 But in articulating their first-order preference for the political economy, Republican officials generally sought to promote economic growth by limiting the role of the state in macroeconomic management, and they joined in efforts to promote technological innovation only insofar as they could do so in a manner consistent with that fundamental objective.Footnote 49
The Democratic Party's response emerged only gradually over the course of the 1970s. In some ways, the Democratic turn toward the knowledge economy began in 1972. In the presidential election of that year, George McGovern became the first Democratic candidate to overtly court suburban knowledge economy workers in places like Boston's Route 128 corridor and Southern California with an economic message of patent reform and technological innovation. McGovern's target audience worked primarily in the defense and aerospace industries and faced increasing unemployment from severe cuts in military spending during President Nixon's first term; they connected with McGovern's message of igniting an economic conversion in which federal science and technology policy would be deployed to achieve peacetime objectives, like energy independence and environmental protection, rather than military preparedness. As political activists, these same workers played an important role in propelling McGovern to victory in the Democratic primary.Footnote 50
The evolution of Democratic Party platforms in this period similarly suggests that, in 1972, McGovern attempted to change the party's conception of the relationship between technology and the economy. The party's 1964 platform, for example, argued that conventional macroeconomic policy would be used to continue the “42 months of uninterrupted [economic] expansion” that began with President Kennedy's tenure in 1961. The document mentioned “technology” fourteen times, but mostly in relation to the space program. It acknowledged a link between technological change and increasing productivity and higher living standards but conceived of such a relationship as flowing mostly from industrial automation.Footnote 51 The party's 1968 platform displayed similar notions. It was the first to contain that all-important buzzword of the AKE—innovation—but the party's pledge, in this context, was to “assist small business in taking advantage of technological innovations,” not to promote small business (or start-ups) as engines of innovation. Many of the remaining references to technology conveyed the party's commitment to ameliorating the social and environmental “hazards” and “complexities” that the “march of technology” had wrought. The document asserted that the United States was supreme in its technological capacity and that the party's challenge was to deal with the social and environmental costs of that supremacy, consistent with escalating regulatory demands of the third-wave consumer movement.Footnote 52
But the party's 1972 platform began with an entirely different proposition: that the nation's technology supremacy was in decline because the Nixon administration had let defense and aerospace programs languish. The party therefore pledged to substantially increase public- and private-sector investment in R&D, to rethink the relationship between government and industry when it came to technological development, and to apply the fruits of technological experimentation in aerospace and defense “to the city, the environment, education, energy, transportation, health care and other urgent domestic needs.”Footnote 53 McGovern's early effort to redefine the party's relationship to technological change was famously unsuccessful, however. In the general election against Richard Nixon, McGovern lost in every state except Massachusetts, leading to one of the most lopsided electoral college victories (520–17) in the nation's history. Unsurprisingly, technological development was a marginal concern in the party's 1976 platform, which focused much more heavily on dealing with unemployment and inflation.Footnote 54
However, as the economic crises of the 1970s accelerated during the Carter administration, it became clear that the Democratic Party, in the throes of the New Left, had no vision for producing economic prosperity. In tilting so hard against the corruption of the Watergate era and challenging the legitimacy of the entire system of democratic capitalism, activist voices within the Democratic Party failed to produce any meaningful alternative to Keynesianism. In fact, their acerbic attack on capitalism ignited a dramatic response by the managers of manufacturing firms, many of whom bridled at the accusation that they were responsible for all of the nation's social and economic turmoil.Footnote 55 Many business managers became active in politics in the middle of the decade to halt what they accurately perceived to be the decline in domestic manufacturing and its roots in poor economic management, with persistent budget deficits that crowded out private borrowing, reduced capital formation, and structurally disadvantaged exports. The New Left remained aloof to their plight. The pejorative many Democratic officials used to refer to American manufacturers—“smokestack industries”—succinctly captured their indifference to American industrial decline and the havoc it was wreaking across the nation. That indifference extended not just to corporate employers but also to blue collar employees as organized labor found itself on the outside looking in at the party's 1976 convention.Footnote 56
Ultimately, if slowly, the Democratic Party found its alternative to Keynesianism at the very end of the decade in the idea of the AKE, as domestic economic malaise juxtaposed with the miraculous ascendance of Japanese and German industry became politically intolerable. To restore global competitiveness and increase productivity, the nation would try to leverage its advantage in producing not knowledge, per se, but IP—a commodified form of knowledge embodied in patents that would allow IP producers to extract substantial economic rents in global marketplaces. The party's rhetoric about innovation and entrepreneurship found easy support among those liberals for whom an economy that conferred yet more wealth and status on the highly educated sounded ideal. But the party's vision for the AKE was primarily shaped by other actors and constraints. As indicated below, it was profoundly shaped by the IP producers that rewrote global trade agreements and advised presidential administrations on industrial innovation policy and economic competitiveness. And it was shaped by the unique nature of American political institutions, as the imperatives of divided government forced a significant narrowing of Democratic aspirations. But it was also substantially shaped by the political entrepreneurship of a faction within the Democratic Party who came to be known (sometimes derisively) as the Atari Democrats.
The Atari Democrats were a group of neoliberal Democrats, many of them “Watergate babies” from the class of 1974, who grew increasingly indifferent in the late 1970s to the social welfare programs of the prior decade that mostly defined the party's legacy. The most prominent Atari Democrats in Congress included Colorado Senator Gary Hart (George McGovern's former campaign manager), his successor Tim Wirth, Massachusetts Congressman (and later Senator) Paul Tsongas, and Tennessee Senator Al Gore. But they also included some newly elected Democratic governors with aspirations for federal office, like Jerry Brown in California, Michael Dukakis in Massachusetts, and (later) Bill Clinton in Arkansas. As a subset of the party's emerging neoliberal faction, the Atari Democrats were bound together by the tenets of the neoliberal perspective: that the party's primary role was to promote economic growth, not implement economic redistribution; that doing so required proactively thinking about the future rather than reactively fighting against injustices of the past; and that the government had to accept hard constraints on what it could accomplish and look for ways of collaborating with the private sector to achieve its goals. But the Atari Democrats additionally believed that technological innovation and small-business entrepreneurship were the key to generating economic prosperity and remedying a host of social and environmental problems.Footnote 57
The Atari Democratic vision for the AKE was shaped by economic thinking, especially the theory of Joseph Schumpeter and the empirical findings of David Birch, but also by their individual experiences in dealing with American industrial decline and the challenge of producing economic growth in a world of limited resources.Footnote 58 As a senator, Paul Tsongas helped negotiate an agreement in the early 1980s to convince computer company, Wang Laboratories, to locate in his hometown of Lowell, Massachusetts, a longstanding hub of textile manufacturing that was, at the time, being torn asunder from deindustrialization. Jerry Brown spoke of similar motivations based on an epiphany he had while touring New England during his 1980 presidential bid. Cognizant of the resource constraints at the heart of “no growth” liberalism and observing firsthand what no growth meant to communities experiencing deindustrialization, Brown came to see the successes of the Silicon Valley (already evident in 1980) as a path forward. As Brown's chief economic adviser described Brown's transformation, “When he came home from the campaign all of a sudden it was crystal clear. His concerns had been fused: One, industrial decay; two, the resource trap; and three, high-tech.”Footnote 59
The intraparty debates over the party's future were fractious, and the Atari Democrats did not succeed in realigning the party toward the AKE overnight. When President Reagan decisively defeated the incumbent, Jimmy Carter, in 1980, their movement gained momentum, but they still faced resistance from other parts of the party membership. In 1982, for example, Tim Wirth worked with Dick Gephardt of Missouri and Gillis Long of Louisiana to develop and publish the House Democrats’ new vision for economic growth rooted in technological development, partnerships with private industry, and adjustment assistance for displaced workers. Only nine months later, a rival faction of 148 House members produced a contrary statement, one that failed to win the Speaker's endorsement but nevertheless revealed the growing schism within the party.Footnote 60
In the physical world, Newton's third law suggests every action is met with an equal and opposite reaction; in the social world, similar laws suggest that most attempts to create new forms of political or economic power are often met with forceful counter-mobilizations or, to use an economic term, the creation of countervailing power.Footnote 61 Predictably, then, as the Atari Democrats pushed the Democratic Party to speak more forcefully on behalf of the suburban, middle-class professionals invested in the knowledge economy, they encountered forceful resistance from the Republican opposition. The Republican Party's alternative to Keynesianism, rooted in market fundamentalism, sought to promote economic growth by minimizing the role of the state in the economy, and party leaders could not support policies that sought to enhance the state's role, even if for the sake of stoking technological development. Political conservatives therefore began portraying deindustrialization as a myth and, with the support of interest groups like the Business Roundtable, argued that new industrial policies would devolve into an exercise where the state was “picking industrial winners” or protecting industrial losers.Footnote 62 As early as 1975, Irving Kristol, the godfather of neoconservatism, blamed “mass education” for creating a “New Class” of liberals who were “sent to college in order to help manage its affluent, highly technological, mildly paternalistic, ‘post-industrial society’ ” and warned that this New Class was an elitist and vehemently anticapitalist group.Footnote 63 In later years, sensing that the Democratic Party's emphasis on college education might allow liberals to build a durable multiracial and worker-inclusive political coalition, political conservatives initiated a long-lasting culture war to discredit public universities and undermine the political status of the knowledge economy workers that they produced.Footnote 64
In a setting of divided government, these developments significantly narrowed the set of potential institutional reforms that were available to hasten knowledge economy formation. In a sense, as the Democratic Party turned toward Schumpeter and the Republican Party turned toward Hayek, the fragmented power of American political institutions all but guaranteed that new laws and institutions promoting the AKE would have to occupy the small space where Schumpeter and Hayek agreed. And that small space was defined by new policies, like patent reform, that sought to rectify what economists referred to as “market failures” in the innovation environment while minimizing the state's role in shaping economic outcomes.
The archival papers and legislative record of one Atari Democrat, Paul Tsongas, illustrate this narrowing of Democratic aspirations. First and foremost, archival sources suggest that Tsongas went to great lengths to ensure that his policy proposals aligned with the demands of high-tech business managers. For example, the records show Tsongas surveying business leaders, like J.A. Marshall of DataCon, to better understand high-tech's position on U.S.-Japanese trade relations.Footnote 65 They show him advertising his legislative “record in high technology” to business managers like John Moriarty of Data General.Footnote 66 And they show him soliciting feedback on new policy proposals from business managers like Fred Garry of General Electric.Footnote 67 In these and other ways, Tsongas worked to keep his new policy proposals consistent with high-tech business demands, and those demands tended to focus on policies that shunned any meaningful new role for state action. In providing comments for Tsongas's proposal to create a new Agency for Technological Innovation, for example, Fred Garry of General Electric rejected the idea of creating new agencies to match Japan's Ministry of International Trade and Industry (MITI), as these agencies would substitute “government judgment for that of business managements in the allocation of industrial resources.”Footnote 68 At the same time, Garry favored proposals that would strengthen patent rights, give industry exclusive rights to IP developed with federal funds, and increase tax write-offs for “acquired technology, including unpatented know-how.”Footnote 69
Tsongas also tried to advance new policies that arguably would have met broader middle-class demands, but when he did so, he was generally unsuccessful. He introduced the High Technology Morrill Act (98 S.631), which would have sequestered a tax on resource extraction from federal lands to create a $2.5 billion trust fund to improve the quality of science and technology education in the United States. But the bill was ultimately whittled down to a much smaller experimental effort, with $90 million appropriated in two fiscal years, and it was incorporated into a much larger bill disbursing conventional block grants consistent with conservative demands (98 S.1285). Even here, on an issue promoting middle-class demands to improve educational access and quality, Tsongas designed his proposal in a way that would only disburse funds to universities that partnered with industry. Tellingly, when he took to the floor of the Senate to support the proposal, he did so not on grounds that the bill had broad popular support, but that it was firmly supported by the members of the Massachusetts High Technology Council, a lobbying consortium of over 100 high-tech business managers. In the same Congress, Tsongas also introduced bills that would have promoted skills training and education for U.S. workers (98 S.2111), required the National Academies to form panels with industry representation to advise Congress on economically strategic technologies (98 S.248), and created a new Agency for Technological Innovation with the power to coordinate the government's role in promoting technological development (98 S.3071). None of these proposals advanced beyond introduction.
In contrast, Tsongas generally succeeded in promoting new policies that either reduced the role of the state in the economy or sought to rectify market failures in the innovation environment. In advertising his legislative record on high-tech issues to business leaders, he claimed to be “one of the first to introduce and advocate legislation in 1982 to relax antitrust laws to encourage the formation of joint R&D ventures,” and he “supported the industry position which provides for … full immunity.”Footnote 70 This proposal was again advanced in the 98th Congress by Strom Thurmond (R-SC) and ultimately became law (P.L. 98-462). Tsongas also held himself out as a major supporter and cosponsor of legislation that ultimately became the Small Business Innovation Research Act (P.L. 97-219).Footnote 71 That act effectively created a federal venture capital fund within the SBA to address the market failure flowing from the concentration of technological investment within large firms and established universities, despite evidence that small businesses were the principal source of technological innovation in the United States. The bill that created these funds (97 S.881) also generated significant bipartisan support and was cosponsored by three Republicans, including Orrin Hatch (R-UT).
In short, Tsongas succeeded when he advanced bills that met business demands and that aligned with conservative thinking about macroeconomic management, but he generally failed when he attempted to advance bills that met much broader middle-class demands to improve the quality of the nation's educational system, increase opportunities for job training and “up-skilling,” or align the full force of the national government behind a set of concretely defined technological objectives. Tsongas even seems to have been aware of the power imbalance between organized business interests and the middle-class voters committed to the project of building a knowledge economy. For example, Tsongas joined an organization called the National Coalition for Science and Technology and signed a letter urging other members of the “science and technology community” to join on the grounds that their interests were “near the very bottom of the list” when it came to special interest representation in Washington and that, if this situation continued, “we risk seeing this country fall behind other nations that do give appropriate emphasis to science education and research.”Footnote 72 Paul Tsongas was only one Atari Democrat, though his position as the head of the Innovation Working Group of the Senate Democratic Policy Committee made him an important representative of the group's demands. And yet, the struggles he faced in advancing his own legislative agenda largely explain, at a granular level, why policies that would have promoted AKE formation through human capital formation and public investment largely failed, while those that focused on IP and rectifying market failures largely succeeded, as documented in Figure 1.
In many ways, the Democratic Party's relationship with the AKE would not become settled until 1992, when Bill Clinton's victory in that year's presidential race demonstrated that the neoliberal vision of an AKE had electoral viability. And yet ironically, by 1994, only two years into Clinton's first term, the AKE's formative period came to a close as most of the policy reforms that define the institutional complex of the AKE had already become law. Against the background of severe electoral losses in presidential elections throughout the 1980s—Jimmy Carter in 1980, Walter Mondale in 1984, and Michael Dukakis in 1988—IP producers and Atari Democrats worked within the constraints of divided government to produce major policy reforms in the one market-oriented domain of technology policy on which they could garner substantial bipartisan support: IP law. The last major reform came at the end of 1994, when President Clinton signed the Uruguay Round Agreements Act, which converted the General Agreement on Trade and Tariffs (GATT) into the World Trade Organization (WTO) and bound member nations to the Agreement on the Trade-Related Aspect of Intellectual Property Rights (TRIPS).
4. Three Geographies of American Knowledge Economy Development
4.1 The Global Knowledge Economy
The story of how IP producers in the United States changed institutions for negotiating multilateral trade agreements to create the global knowledge economy (GKE) is a story of surprising corporate influence over global economic policy, though it has failed to elicit much interest in international political economy or the lobbying subdiscipline of American politics. The story culminates with the adoption of TRIPS in 1994. In essence, TRIPS required member nations, including many developing nations, to draft and enforce IP laws that met certain basic criteria. The leaders of many developing nations viewed the agreement as a new form of colonialism. They begrudgingly assented because they needed access to U.S. markets in agricultural products and textiles, and IP producers succeeded in making that access contingent upon accepting TRIPS.
Two business managers—the chief executive of Pfizer, Edmund Pratt, and that of IBM, John Opel—played a central role in the passage of TRIPS, but in doing so, they represented a much broader coalition of domestic IP producers that relied intensely on patents to compete in the global economy. In 1986, Pratt and Opel organized an interest group known as the Intellectual Property Committee (IPC) to push global patent reform onto the agenda for the next round of trade negotiations under the GATT. The IPC consisted of the executives of Pfizer, IBM, Merck, General Electric, DuPont, Warner Communications, Hewlett-Packard, Bristol-Myers, FMC Corporation, General Motors, Johnson & Johnson, Monsanto, and Rockwell International.Footnote 73 General Motors was the only firm that could be characterized as a domestic manufacturer despite its international operations, but in 1980 it owned significant IP assets.Footnote 74 The remaining companies were all multinational IP producers in aerospace and defense, pharmaceuticals and chemicals, computer hardware and telecommunications, and agritech.
The IPC's main political achievement was to create an international coalition of IP producers that shifted the forum for negotiations over global patent reform from the UN to GATT.Footnote 75 IP producers had first pushed for global patent standards in 1981 and 1982 by way of a revision to the Paris Convention before the UN agency, WIPO. Developing nations opposed these efforts on grounds that turning American patent law into a global standard would undermine their ability to do things like manage public health crises. For example, in the 1980s, South Africa could import patented HIV drugs at low prices to deal with its AIDS crisis because manufacturers could legally locate in places that either had no patent law or had a patent law that did not allow for drug patents, or used state-sanctioned compulsory licenses to force drug manufacturers to take much smaller royalties on sales in developing nations. Purging this heterogeneity in national patent laws would therefore hobble the South African government in its ability to fight an epidemic. For the leaders of many developing nations, IP producers could already enforce patents and charge supra-competitive prices to affluent consumers in developed countries, which provided sufficient rents to encourage innovation. For IP producers, substantial rents were lost on what they perceived as IP theft. Standardizing patent laws would expand the geographic scope of their IP so that each new piece of IP they produced could potentially earn a market position approaching global monopoly.
The political problem that IP producers encountered was that the UN's democratic one-country, one-vote procedures—an institutional legacy of the AKS—allowed developing nations to form a coalition that opposed global patent standards. Accordingly, IP producers pursued the same reforms under GATT where developed nations had more influence and where global patent standards could be linked to other issues that developing nations cared about, such as agricultural tariffs. Such a strategy might have failed if the IPC had pursued it alone, but it built a global coalition of IP producers from within the Japanese Keidanren and the Union of Industrial and Employers’ Confederations of Europe. Together with some Canadian companies, “the Quad” successfully lobbied their respective governments to add IP standards to the Ministerial Declaration that defined the basis for the Uruguay Round of trade negotiations in 1986. Subsequently, during negotiations, U.S. officials refused to grant any concessions on textile or agricultural subsidies to developing nations in the absence of an agreement over patent reform.Footnote 76
To procure passage of TRIPS, IP producers settled on a political strategy of unilaterally punishing nations that would not adopt American patent standards to obtain bilateral resolutions that would then provide leverage against other developing nations in multilateral negotiations over TRIPS. In the pursuit of that strategy, they took advantage of some existing institutional mechanisms. The Trade Act of 1974 (P.L. 93-618), for example, is best known in scholarly literature for creating “fast track” authority that empowers the president to negotiate international trade agreements that Congress must consider without amendments or filibuster. But another provision, Section 301, required greater executive monitoring of and response to unfair trade practices and also gave American businesses the power to petition the office of the U.S. Trade Representative (USTR) to investigate such practices. Another provision created a new institution—the Advisory Committee for Trade Policy and Negotiation—so that IP producers could have more direct and systematic input into the substance of U.S. trade policy.Footnote 77 President Carter appointed Pratt to that Advisory Committee in 1979, and Pratt became the chairman in 1981.
IP producers also successfully lobbied for new laws and institutions that would increase their negotiating leverage. The first set of policy victories came with the International Trade and Investment Act (Title III of the Trade and Tariff Act of 1984, P.L. 98-573), which revised the Trade Act of 1974 to make the act of denying adequate patent protection a form of unfair trade practice against which the president had the authority to unilaterally retaliate.Footnote 78 Other provisions in the bill removed obstacles that the IP producers faced in asserting their patent rights abroad. The bill empowered the USTR to initiate its own investigations of inadequate foreign patent protection so that domestic firms did not have to formally file a petition and risk retaliation abroad. Another provision required the USTR to identify the most significant barriers to foreign investment, estimate the trade-distorting impact, and annually report the results of its investigations to Congress. The bill also gave the president the authority to enter into bilateral or multilateral trade agreements that would “obtain and preserve the maximum openness with respect to international trade and investment in high technology products and related services” (Section 305) and to consider the extent of patent protection when deciding whether to designate a country as a “beneficiary developing country” under the Generalized System of Preferences (GSP; Section 503).
Scrutiny of the provision linking patents to the GSP reveals the political tensions inherent in the emerging GKE. Starting in 1976, many developing countries came to rely on the GSP because it provided a nonreciprocal reduction in tariffs that made agricultural and manufactured goods produced abroad competitive in domestic markets. American financial interests supported the system because the foreign companies in which American banks had invested might struggle to repay their debts without preferential treatment.Footnote 79 IP producers realized that linking GSP access to global patent standards would provide leverage over developing nations, since IP producers could now make progress on tariff reductions in agricultural goods and textiles contingent upon the adoption of global patent standards. Section 503 did just that, and the United States began exercising its bilateral power under Section 503 almost immediately, moving first against Korea and Brazil in 1985.Footnote 80 Far from being the stylized economy in which firms and nations freely developed comparative advantages based on factor prices, the GKE appeared to some as an economy in which wealthy nations dictated the terms and patterns of trade. At the same time, when the United States asserted itself under Section 503, it agreed to expose its own domestic growers and manufacturers to more competition, and even subsidize that competition, so long as IP producers could obtain stronger patent rights abroad.
The second set of policy victories came from various sections of the Omnibus Trade and Competitiveness Act of 1988 (P.L. 100-418). Parts of the 1988 act escalated the USTR's investigation and reporting requirements and made it easier to retaliate against countries with inadequate IP protection.Footnote 81 The 1988 act also amended the Tariff Act of 1930 to explicitly condone the practice of allowing patent holders to seek additional remedies, like an import ban, before the International Trade Commission (ITC). In a move emblematic of the new GKE politics, the law also loosened the “domestic industry” requirement for obtaining remedies in that forum. The ITC traditionally required petitioners to prove that they had a substantial domestic presence before initiating an action, which generally required “significant investment in plant or equipment” or “significant employment of labor or capital” within the United States. To further empower IP producers, the 1988 act revised this requirement so that it could be met by showing “substantial investment” in the exploitation of a patent, “including engineering, research and development, or licensing” (P.L. 100-418 Section 1342). Petitioners before the ITC no longer needed to be firms that produced something or employed workers in the United States but could be multinational companies that only developed new technologies in the United States. Small, technical provisions like this one, buried in colossal omnibus bills, reveal how the AKE developed under the assumption that American national interests and the interests of IP producers were fully aligned. Institutions built at the dawn of the twentieth century to respond to the needs of American manufacturers and industrial workers were adapted to respond to the needs of IP producers and investors, even if those interests were at odds with traditional manufacturing.
These institutional shifts enabled IP producers to exercise tremendous influence on the process of negotiating bilateral and multilateral trade agreements, which culminated in TRIPS. In fact, IP producers seemed to exert substantial influence during the negotiations for TRIPS itself. For example, when the USTR needed concrete evidence of the economic losses associated with “IP theft” to convince foreign negotiators that it was a problem, the agency solicited the IP producers’ perspective by entering a notice in the Federal Register that allowed IP lobbyists to formally provide commentary. IP producers and their interest groups participated, virtually alone, in this process, and the claims embedded in their economic reports routinely became official statements. A revolving door also opened with former USTR negotiators joining the staffs of IP firms during the Uruguay Round of negotiations. The representatives of IP firms even joined official representatives of the U.S. government at the actual negotiating table, passing notes as the negotiations proceeded.Footnote 82 This is not to say that all members of the global IP producer coalition were always aligned. Significant divisions and tensions remained.Footnote 83 But IP producers overcame those differences to align behind a specific set of rules and institutions to govern the GKE, and they found U.S. government officials deeply receptive to their demands.
In sum, multinational IP producers substantially shaped the institutions of the GKE in which the AKE is situated. The IP producers’ goal was to accelerate global integration so that they could minimize costs by locating the production of goods and commodities abroad while maximizing the global rents they could extract from their IP rights—even if that meant the U.S. government would have to actively subsidize competition against growers and manufacturers at home. They pursued that goal with singular focus over the course of fourteen years, and while TRIPS represents the culmination of this effort, many smaller institutional reforms that IP producers lobbied for throughout the 1980s ultimately made TRIPS possible. The story of these developments is difficult to square with a theory suggesting that middle-class voters are decisive in demanding pro-competitive policies, as few voters (and, indeed, few close political observers) were even aware of these developments, let alone championing them. And the policies demanded did not seek to promote competition across the global economy. They instead sought to expose “smokestack industries” to intense competition while dramatically expanding the monopolistic position of those firms that could produce new and valuable IP. Rather, the story of these developments conforms much more closely with the view that IP producers found pro-business Republicans and pro-IP Democrats receptive to their policy demands, and the alignment of those interests enabled IP producers to achieve incredible success in domains of public policy that garnered little attention in the broader public.
4.2 The National Industrial Innovation Debate
As Democrats embraced the AKE as a salve for the nation's declining economic competitiveness, an important political debate unfolded about the role the federal government would play in the AKE transition. The industrial policy debate, as it came to be known, was sprawling and expansive. But the debate mostly revolved around the question of whether the United States should create centralized institutions for coordinating federal investments in scientific research and technological development, much as MITI did in Japan.Footnote 84 It began during the Carter administration and reached its apex during President Reagan's first term, but it fizzled out by 1984 when Walter Mondale decided that Reagan was more vulnerable on the question of fiscal policy in that year's presidential election. An ideological reframing of the question as whether the United States should have an industrial policy enabled partisans to take sides but hobbled the overall debate. The question was not whether the United States should have an industrial policy—it already had one. One legacy of the AKS was a decentralized industrial policy developed ad hoc by a plethora of executive agencies with different legislative mandates and responsibilities to different congressional oversight committees. The real question was whether the federal government should try to coordinate those policies and investments to some politically consensual end. Confusion also arose as to whether industrial policy should be forward-looking, to facilitate AKE development, or backward-looking, to prevent industrial decline.Footnote 85
Partly because of the confusion surrounding the industrial policy debate, the conventional historical narrative is that it ended without generating any policy consensus at the federal level, which left the federal government with the decentralized architecture of the AKS and paved the way for entrepreneurial states to fill the policy void.Footnote 86 As suggested above, conservatives bristled against the prospect of an activist government “picking winners” in the marketplace while liberals, despite their passion, failed to produce a coherent vision of what industrial policy in the United States should look like. This perspective is accurate, but it omits an important area in which political consensus did develop and that became essential for the construction of the AKE: industrial innovation policy rooted in patent reform.
In early 1978, President Carter assembled an advisory committee of “approximately 500 private sector participants and 250 representatives from 28 federal agencies” to address the nation's productivity slump and to propose a package of industrial policy reforms that would help end the recession.Footnote 87 The Advisory Committee on Industrial Innovation created a series of subcommittees to address a wide range of domestic policies, from trade and environmental policy to federal procurement, but it is the subcommittee on patent and information policy that would go on to chart the path of the AKE transition. IP producers and the service workers that supported them were heavily represented on the subcommittee, as its membership included representatives from machine manufacturer Allis-Chalmers, drug maker Merck, defense contractor Itek, robotics company Unimation, camera technology company Eastman-Kodak, chemical company FMC, and oil company Phillips Petroleum, along with eight others who were mostly prominent patent attorneys or lobbyists.
As with the other subcommittees, the patent subcommittee drew its membership largely from corporate managers and legal professionals, though a separate public interest subcommittee commented on their final report, and a labor subcommittee submitted its own separate report. The public interest commentary is short and mostly unremarkable, but it opposed further attempts by industry to expropriate economic gains flowing from publicly funded research, and it opposed the practice of assigning all rights in inventions to IP producers with few if any royalty rights going to the actual inventors. The even briefer labor commentary agreed on these points but went further, calling for the use of compulsory licensing when patents have clear social benefits and for expansive federal investments in R&D that did not just meet military and aerospace needs but also supported innovations to address urban, environmental, and other social problems.
But it was the IP producers’ final report, issued in 1979, that would go on to provide a prescient blueprint for AKE development in the divided government of the Reagan and Bush administrations, when the House remained under Democratic control. The report made five major patent reform proposals, all of which would come to pass by 1994. First, it recommended the creation of a central court to hear patent appeals to eliminate jurisdictional conflicts, which Congress did when it created the Court of Appeals for the Federal Circuit in 1982. Second, it recommended that Congress give corporations exclusive rights in patents on publicly funded research, which Congress did when it passed the Bayh-Dole Act of 1980 and the Stevenson-Wydler Act of 1980. Third, it recommended that patent terms be extended when commercialization is delayed due to federal regulations, which mostly impacted drug companies that had to obtain Food and Drug Administration (FDA) approval before they could go to market with a new patented drug. Congress did so in the context of a much broader overhaul of pharmaceutical patenting with the Hatch-Waxman Act of 1984. Fourth, it promoted a foreign policy that would encourage other nations to adopt American patent standards, which Congress and the USTR achieved with TRIPS. Fifth, it recommended that Congress clarify that emerging technologies like computer software and biotechnology could receive patent protection, which Congress did not do.Footnote 88 But the Supreme Court mostly resolved the question of biotechnology patenting in 1980, and its broader admonition that patent law protected “anything under the sun made by man” gave IP producers what they wanted.Footnote 89
IP producers had another problem, though. Patents promote innovation at the risk of future anticompetitive conduct, and the AKS had emboldened antitrust officials to attack mergers involving the acquisition of patents and to police the ways in which corporations abused their patent rights under the doctrine of patent misuse. Toward the end of their report, IP producers recommended a host of measures to “keep the Department of Justice from inhibiting innovation.”Footnote 90 In retrospect, their recommendations seem modest. They could not have foreseen that Reagan's commitment to market fundamentalism would all but eliminate antitrust scrutiny of mergers and acquisitions.Footnote 91 Nor could they have anticipated the rising influence of the Atari Democrats. DOJ officials in the Clinton administration made no attempt to roll back the lax merger guidelines from the Reagan era, but sought instead to clarify, for IP producers, that in the DOJ's perspective, patents did not confer market power, and even if such market power was established, the Department would not assume that such power violated the antitrust laws.Footnote 92
The executive branch can substantially change antitrust enforcement priorities without congressional action, but Congress joined in these efforts to promote the AKE by reducing the antitrust oversight of IP producers. With the National Cooperative Research Act of 1984, it eliminated antitrust liability for joint ventures engaged in R&D. With the Patent Misuse Reform Act (1988), it narrowed the acts that constitute patent misuse. And with the National Cooperative Research and Production Act (1993), it eliminated antitrust liability for joint ventures engaged not only in R&D but also in manufacturing. As other scholars have noted, federal attitudes toward patents and antitrust policy have evolved in tandem over time.Footnote 93 But the law is not itself an agent that develops according to the internal logic of capitalist imperatives; it is an output of political processes. The Democratic turn toward the knowledge economy, simultaneous with the Republican turn toward the market, motivated and drove these crucial shifts in antitrust institutions.Footnote 94
Figure 2 further reinforces how dramatically congressional attitudes toward patents and antitrust changed over the postwar period. It shows, for every year from 1945 to 2020, the share of all congressional hearings dealing with patent or IP issues (black line) and those dealing with antitrust issues (gray line). Consistent with existing scholarship on antitrust reform, the share of congressional hearings dealing with antitrust issues rose significantly after 1945, peaked in the early 1980s, but then rapidly declined following President Reagan's decision to substantially narrow antitrust oversight.Footnote 95 From about 1945 to 1962, congressional interest in patent reform was roughly correlated with its increasing concern over antitrust and market power. But after a series of hearings in 1961 and 1962 about monopolistic pricing by drug companies and making federal patent policy consistent across agencies, IP became decoupled from the congressional interest in antitrust until the late 1970s. From that point through the middle of the 1990s, IP and patent reform issues began taking up more and more of the congressional agenda, and they have continued to do so since the 1990s, albeit more episodically. As Figure 2 suggests, the period of AKE development, from 1980 to 1994, was characterized by declining interest in antitrust oversight and accelerating interest in IP reform.
This time-series shows the share of all congressional hearings that involved patent (black line) or antitrust (gray line) issues. Data on hearings come from ProQuest Congressional. Antitrust hearings include any hearing that contained the terms “antitrust” or “anti-trust” in the hearing description; patent hearings include any hearing that contained the terms “patent” or “intellectual property” but not “land” in the hearing description (land grants were historically referred to as land patents). The curves have been smoothed to avoid overplotting.

The politics and legal technicalities behind many of these bills is much more complex than the sketch above suggests, but these complex historical contingencies should not obfuscate the general trend, which was to strengthen patent laws and diminish antitrust enforcement to the benefit of IP producers. In the process, government officials abandoned most of the tools—institutional legacies of the AKS—that were meant to ensure some public quid pro quo in exchange for stronger patent rights and exclusive rights in publicly funded R&D. The Bayh-Dole Act, for example, gave universities the power to enter into exclusive licenses with IP producers only if the invention would be manufactured substantially in the United States. At the same time, Congress made it quite difficult if not impossible to police this command by exempting these arrangements from the Freedom of Information Act.Footnote 96 As a result, no one knows whether patents developed with public funds have only been licensed to IP producers that commit to domestic manufacturing. The early political consensus seemed to favor an AKE that would benefit American workers, but the interests of multinational IP producers remained protected by a lack of transparency.
The outpouring of patent reform legislation also altered the AKE's political dynamics. In the conventional way that new policies create new interest groups to support them,Footnote 97 the Bayh-Dole Act led to the creation of the Association of University Technology Managers, an interest group representing the patent licensing offices of universities. This group has repeatedly blocked efforts to make patented technologies more broadly available for R&D.Footnote 98 Now that universities stand to benefit from the lucrative rents that patents can generate, they more readily align themselves, politically, with their corporate benefactors. In this fashion, many universities have abandoned norms of openness and sharing and have instead accepted norms of appropriation, contributing to the creation of the “market university.”Footnote 99
In some respects, the creation of the Federal Circuit was the most significant and politically interesting victory as it involved the controversial construction of a novel judicial institution that would not only move the nation from the AKS to the AKE but would also insulate those developments from political pressure. The period of congressional activism in patent reform described above, from 1980 to 1994, is actually an anomaly and reflects the intense bipartisan commitment to hastening the AKE transition. In most periods, most American patent law has been made by courts, by federal judges resolving legal questions and disputes that arise under the patent laws. Patent law is therefore an area of law that lawyers can shape while avoiding the demands of coalition building and the multitude of veto points that obstruct federal policy reform. The main problem that IP producers had with the federal judiciary was that patent lawsuits in federal district courts were, like most other cases involving federal law, being appealed to regional circuit courts, and eight of the eleven circuit courts still viewed patents as monopolistic devices that should be treated with skepticism.Footnote 100 IP producers therefore wished to eliminate this institutional and ideological legacy of the AKS.
The solution the IP producers settled on was to create a special appellate court staffed with pro-patent lawyers that would hear appeals in patent cases from all the federal district courts. That is precisely what the Federal Courts Improvements Act of 1982 did. Its passage was by no means guaranteed. Personal accounts suggest that two factors made a difference. First, President Carter's industrial innovation review transformed the issue from a small technocratic debate about appellate reform pushed by bureaucrats within the DOJ to a central plank in the AKE platform. Second, the agency officials who had worked on the issue in the past organized corporate patent lawyers into a vocal interest group to overcome the opposition of trial lawyers. Of the eighty-five letters signed in support of the bill, seventy-six were signed by corporate patent counsel, and the companies that turned out in support of the act represented three-quarters of the nation's industrial product.Footnote 101
Some of those who helped create the court would end up serving on it. Pauline Newman, the corporate patent attorney for FMC who served on the patent subcommittee of Carter's industrial innovation review, was the first judge appointed to the court in 1984. Randall Rader, counsel to the Senate Judiciary Committee that approved the act, joined her on the bench in 1990. Even when lawyers with patent backgrounds remained a minority on the court, they decided a strong majority of the court's patent cases, and the court's strong pro-patent perspective played some role in causing a flood of patent applications that were approved and held valid at much higher rates in judicial disputes.Footnote 102 Absent Supreme Court intervention, which is rare in patent cases, the Federal Circuit mostly dictates the substance of patent law. As an Article III court, it is staffed by judges who, after surviving Senate confirmation, receive lifetime tenure and remain relatively immune from politics.
The creation of the Court of Appeals for the Federal Circuit, and its staffing with pro-patent judges, emphasizes the prominent role of the judiciary in shaping American political economy, especially its role in defining the exact contours of the property rights that undergird the American form of capitalism.Footnote 103 Because AKE development was so tightly tethered to stronger IP rights, and because the AKS had institutionalized an ideological aversion to patent rights in the federal judiciary, Congress had to substantially alter the structure the federal judiciary to create a pro-patent haven that had the power to quickly reorient the legal basis of American capitalism.
The substantial body of patent reform legislation from 1980 to 1994, summarized in Table 2, belies the notion that the industrial innovation debate produced no consensus at the federal level.Footnote 104 True, the parts of the debate concerning reindustrialization and central planning were quickly dispatched during Reagan's presidency. When the headwinds favoring AKE development confronted a president who believed the state had a limited role to play in a capitalist society, it became clear that the AKS's opaque and decentralized structure for investing in science and technology would remain, as would the strong preference for investments that bolster national security.Footnote 105 Congress amended the Employee Retirement Income Security Act (ERISA) in 1979 to allow pension fund managers to invest as much as 5 percent of a fund in venture capital, which caused a massive surge in venture capital investment.Footnote 106 As noted above, the Small Business Innovation Research Act of 1982 essentially created a federal venture capital program administered by the SBA. The NSF began experimenting with university-industry research centers to draw together scientists from across multiple institutional settings. To help the semiconductor industry better compete against Japanese firms, the Reagan administration established a research consortium (SEMATECH) in Austin, Texas in 1987. Starting in 1988, the Advanced Technology Program and the Manufacturing Extension Partnership, both administered by the National Institute of Standards and Technology, provided federal matching grants for promising new technologies and used experts to help manufacturers make use of advanced technologies.Footnote 107 These and other policies tried to fill gaps in the AKS's system of technological production, promote collaboration and the public-private partnerships that were so central to the Atari Democrat's neoliberal vision, and shore up declining industries that impacted national security. They are extensions of the AKS into the modern era.
IP Reform Had Deep Bipartisan Support

Note: This table shows the Congress number, public law number and title, and main purpose of major patent reform legislation (rows with white background) and, for comparison, some more partisan bills from the same time period (rows with gray background). The table includes the relevant actions in the House of Representatives (with parenthetical citations to the Congressional Record) and the House roll call vote where available. Bills passed by voice vote on suspension require a two-thirds majority (or 290) to pass.
But within the constraints of divided government, a strong bipartisan consensus also developed in favor of industrial innovation policies that would be achieved through market-oriented mechanisms like patent reform, and that movement altered central institutions of American political economy to hasten AKE development. Table 2 reveals the strong bipartisan majorities that aligned behind the most significant reforms. For each major piece of patent reform legislation, the table shows the vote on each major House action (usually a vote to pass or a vote to adopt a Senate version), but it also shows comparable votes for more controversial nonpatent legislation in similar time frames (rows with gray backgrounds). For example, in the 96th Congress, when Democrats held 276 seats, the Bayh-Dole and Stevenson-Wydler Acts both breezed through the House by voice vote on suspension with at least a two-thirds majority (290 votes in favor), but a bill to centralize and coordinate federal education programs in a new Department of Education only narrowly survived with 215 votes. Then, in the 98th Congress, when Democrats held 269 seats, three major patent reform initiatives passed by large margins (366, 418, and 368 votes in favor), but a more controversial bill to revise Social Security financing passed much more narrowly on party lines (284 votes in favor). Many of the Atari Democrats’ more ambitious proposals for the AKE foundered in this same time frame. But when they focused on IP rights as a tool for facilitating AKE development, they were able to build commanding bipartisan majorities. And their successes, in this regard, belie the notion the industrial policy debate produced no meaningful federal action.
4.3 The Entrepreneurial States
As the federal debate on industrial policy consolidated around patent reform, entrepreneurial states (and cities) began to address federal policy shortcomings. The move came with a dramatic shift in the way state and local officials conceived of economic development. State and local governments have always played a prominent role in managing economic affairs, but in the days of the AKS, most governors engaged in zero-sum attempts to lure footloose firms away from other states with the promise of special tax incentives and cheap labor. As the nation reoriented its economic priorities and moved toward the AKE, state and local representatives began to align behind a different consensus. State officials began to perceive wage stagnation less as an advantage and more as a sign of economic decline; they focused less on using capital subsidies and cheap labor to steal low-paying jobs from other states and more on incubating new businesses and industries that could export products to other states and even to other nations.Footnote 108
The movement caught on fast, and by the middle of the 1980s the vast majority of states had designed policies to hasten their integration into the AKE despite, and in the face of, growing budget shortfalls. By 1986, at least twenty-five states had adopted some form of venture capital program providing a state equivalent to the federal programs administered through the SBA, and some developed novel techniques like earmarking portions of public employee retirement funds for local venture capital investment.Footnote 109 By 1984, thirty-four states had sponsored some form of high-technology development program, and forty-four states had adopted some form of university-industry research center comparable to the federal innovation centers sponsored by the NSF to promote technology transfer.Footnote 110 In the 1970s governors mostly traveled abroad to lure foreign capital into their states; by 1984, states spent two-thirds of their trade-related expenditures on promoting exports in a manner similar to the federal Export-Import Bank.Footnote 111
The institutional similarity between these programs and their federal equivalents can obscure their very different motivations: entrepreneurial states tended to adopt knowledge economy policies to redress the severe imbalances of the AKE. State venture capital pools were partly used to remedy the extreme geographic concentration in private venture capital. State-sponsored university-industry collaborations were often meant to correct the heavy defense orientation of federal efforts. State export promotion focused on smaller firms that often did not receive assistance from the Export-Import Bank. Though the entrepreneurial political leaders for the states turned to the same policy tools that sculpted the decentralized federal system of investment, they used those tools to achieve local purposes and soften the blow of a federal policy that benefited regions already rich in AKE infrastructure, multinational firms, and defense contractors.
The importance of entrepreneurial states in AKE development is also reflected in the prominent role of state governors in defining the Democratic Party's turn toward the AKE. In fact, in some ways, the party's evolving commitments to the AKE can be told through the presidential aspirations of three governors: Jerry Brown (California), Michael Dukakis (Massachusetts), and Bill Clinton (Arkansas).Footnote 112
Brown's attempts at winning the presidential nomination in 1976 and 1980 would spectacularly fail, but as governor of California, Brown led the way in articulating the Democratic vision for AKE development. As the debate over industrial policy that began under the Carter administration devolved into a debate over patent reform during the Reagan administration, Brown inaugurated his own Commission on Industrial Innovation and appointed prominent IP producers like Steve Jobs and David Packard and marketing expert Regis McKenna to serve on it. The commission's final report, issued in September 1982, called for a fully developed industrial policy that would revitalize existing industries like steel, ensure the competitiveness of new industries like semiconductors, and counter the industrial policies of nations like Germany and Japan. Where conservatives maligned industrial policy as “picking winners,” Brown's commission wore that accusation as a badge of honor. To accomplish its goals, the commission claimed, “we need a national strategy designed to encourage the spread of ‘winning technologies’ … throughout our entire industrial structure.”Footnote 113
Where Brown failed to attain the Democratic nomination, Dukakis eventually succeeded, and in some respects, his career better represents the shifting politics of the Atari Democrat movement. Like other Atari Democrats, Dukakis won his first gubernatorial election in 1974 by distancing himself from the urban, ethnic old guard of the Massachusetts Democratic Party and echoing George McGovern's message of liberating technological development from its dependency upon the Pentagon. Dukakis then lost to Edward King in 1978 after IP producers, organized as the Massachusetts High Technology Council, campaigned against him on the issue of limiting property taxes. But Dukakis then mended his relationship with the council—which did not have a single unionized company among its more than a hundred members—during his time out of office. After cultivating ties with economic advisers at MIT and Harvard like Lester Thurow and Robert Reich, he came back to victory in 1982. During his second term, Dukakis sought to turn Massachusetts into the “very model of the high tech state,”Footnote 114 and the period of economic revitalization that he presided over from 1982 to 1988 came to be known as “the Massachusetts Miracle.”
Whether any of Dukakis's policies actually played a role in producing the perceived miracle is uncertain. The state's economic revitalization may have had more to do with the fact that President Reagan dramatically increased defense spending while slashing federal support for state governments under the auspices of the “new federalism,” a combination of policies that limited fiscal support for conventional state industrial policy while bestowing federal largesse in defense-heavy states like California and Massachusetts.Footnote 115 In 1985, Raytheon alone received $2.3 billion in defense contracts,Footnote 116 and aggregate defense production came to roughly $12 billion or 8.3 percent of Massachusetts's net product;Footnote 117 in the same year, the state's entire general operating fund came to only $5.6 billion.Footnote 118 The Pentagon's central role has led some to argue that the economic turnaround is not that miraculous and to characterize the governor's role in it as minor.Footnote 119 Dukakis claimed political credit nevertheless. And in doing so, he tied his own political career and the future of the Democratic Party to both the broader goal of AKE development and the specific policies that characterized his tenure, like more conservative forms of welfare reform combined with “public-private” partnerships to promote start-up formation.
Clinton ultimately succeeded where both Brown and Dukakis failed, and he did so in an election cycle in which knowledge economy politics dominated. To prevail in the Democratic primary, Clinton had to defeat both Brown and Paul Tsongas. Clinton then had to compete in the general election against an incumbent Republican president with strong ties to the business community and a third-party candidate, H. Ross Perot, who founded Electronic Data Systems and effectively created the industry of information technology outsourcing. In a field crowded with politicians giving voice to the demands of technology entrepreneurs, Clinton prevailed by carefully cultivating relationships with California's Silicon Valley and by naming a technology wonk, Al Gore, to be both his running mate and his technology czar. Clinton also astutely distanced himself from “Massachusetts liberal” Dukakis, while embracing virtually all of Dukakis's governing agenda.Footnote 120 Clinton's calculus paid dividends. He ultimately won the public endorsement of Xerox CEO Paul Allaire, Apple CEO John Sculley, Hewlett-Packard CEO John Young, and twenty-nine other IP executives.Footnote 121
Young's endorsement of Clinton in the 1992 race illustrates the key political shift that took place between 1980 and 1992, which allowed the Democratic Party to convert its commitments to the AKE into electoral benefits. Throughout the 1980s, as Democrats began to articulate their allegiance to the AKE, business managers for IP producers largely remained aligned with Reagan and Bush.Footnote 122 But the Reagan era also widened political cleavages among these executives in a way that precipitated Young's conversion. When Jerry Brown released his blueprint for national industrial policy in September 1982, Reagan grew angry at the idea of Democrats claiming the mantle of entrepreneurship and started his own Commission on Industrial Competitiveness, which Young chaired.Footnote 123 The commission released its report in January 1985. It painted a bleak picture of declining American competitiveness by almost any chosen metric and recommended policies that looked like industrial policy rebranded as “competitiveness strategy.” Reagan ignored the report in its entirety despite a joint resolution demanding a presidential response supported by thirty senators in each party.Footnote 124 Reagan abhorred the idea of industrial policy and pursued AKE development mostly through broad untargeted tax cuts intended to promote investment coupled with massive increases in defense spending. If Japan had MITI, the United States would have DARPA.Footnote 125 Young and the other executives who endorsed Clinton in 1992 believed that the federal government would have to do much more to resolve the competitiveness crisis, and Clinton quite effectively gave voice to those demands.
The institutional shifts that demarcate the transition from the AKS to the AKE are summarized in Table 1. Though most of these changes took place at the national and global level, political leaders at the state level also played a role in shifting strategies for economic development from the zero-sum devices of the AKS to the innovation-oriented devices of the AKE, and they did so in ways that met local needs and rectified imbalances in the federal framework. And because demonstrated state leadership in facilitating AKE development increasingly became a strong political asset, state leaders—in their attempts at the presidency—played a substantial role in articulating the Democratic Party's relationship to the AKE. Ironically, the governor of Arkansas, not California or Massachusetts, would become the defining Democratic spokesperson for the AKE. He achieved that victory in part because the industrial policy debate widened political cleavages among technology executives and elected officials during the Reagan and Bush administrations. For those who viewed SEMATECH as a handout to “California crybabies,” the future lay with Bush. For those, like John Young, who saw research consortia like SEMATECH as exemplary federal policy, the future lay with Clinton.
5. Conclusion
The AKE is not a foreordained product of globalization, automation, or technological development. Nor is it a natural form of political economy that attains when the economic beneficiaries of those outcomes, namely highly educated workers, formulate and express political demands. It is instead a politically generated consensus for producing economic prosperity and economic advantage against other nations in which IP and the businesses that produce it play a leading role. As is true in many other domains of American political development, policy entrepreneurs and organized interest groups, not rational voters, played the most important role in reconfiguring essential institutions to facilitate the transformation. In the actual story of AKE development, Atari Democrats and IP producers, not decisive middle-class voters, had the most enduring legacy.
Intellectual property in general, and patents in specific, are at the center of the AKE, but are by no means the whole story. The AKE relies, for example, on a massive, decentralized infrastructure for investing in scientific and technological development as well as the commercialization of new technologies. But that infrastructure is a legacy of the AKS, and as such, it does not distinguish the AKE, institutionally, from what came before. Similarly, American businesses can acquire substantial market power through devices other than patents (first-mover effects, network effects, control of internet user information, etc.). But these forms of acquiring market power were never at the heart of the political consensus behind the AKE, even if that consensus accepted rent-seeking by technology firms as an acceptable price to pay for increasing the nation's competitive position. Only when we focus on that consensus, and on the institutional changes it produced, does it become clear that the AKE is unique in its dependence on IP as a source of generating economic advantages for American businesses and for the nation.
Plenty happened after 1994, the end of the period discussed in this article, that contributed to AKE development. But those events are mostly contemporary manifestations of dynamic processes that were unleashed in the formative period of AKE development, from 1980 to 1994, when Congress erected the AKE's institutional architecture. New programs were added to the alphabet soup of federal initiatives, and TRIPS gave way to TRIPS+ and then the Trans-Pacific Partnership, but these are natural extensions of what happened before. The Democratic Party deepened its commitments to the AKE under Presidents Clinton and Obama and continued to encounter intense conservative opposition only when it imagined a major role for the state other than addressing national security imperatives. The Democratic Party continued to ignore the social and political ramifications of allowing their chosen national champions to acquire unprecedented market power, and the party now faces escalating demands to restore the Brandeisian tradition of robust antitrust enforcement.Footnote 126 And, because the narrow neoliberal vision of the AKE that emerged between 1980 and 1994 inherently exacerbates many forms of existing inequality, growing factions within the party are questioning whether social democracy or some other form for arranging the American political economy would better serve the national interest.Footnote 127 These and other contemporary controversies arguably have roots in the political choices made during the AKE's formative period, and their resolution may depend on more direct confrontation with the limits of the Democratic vision for the AKE that emerged in that era.
Acknowledgments
The author thanks the anonymous reviewers, Daniel Carpenter, Kathleen Thelen, Herman Mark Schwartz, Kirsten Walters, and the members of the American Politics Research Workshop at Harvard University for helpful comments.