I. INTRODUCTION
Sn-rich alloys, such as Sn–0.7Cu, Sn–3.5Ag, and Sn–3.5Ag–0.7Cu, are widely used in the solder interconnects where electromigration has been a major reliability concern. Reference Tu1 When Sn-rich solders form an interconnect with Cu metallization, the electromigration damage may take the forms of hillock formation, interfacial voids, Reference Liang, Chen, Han, Xu, Tu and Lai2–Reference Boettinger, Johnson, Bendersky, Moon, Williams and Stafford4 polarity-effect in the growth of the interfacial intermetallic compounds (IMCs), Reference Yang and Shang5–Reference Hsu, Chou, Liu, Chen, Yao, Chou and Tu8 softening of the solder alloy, Reference Zhu, Liu, Zhang, Wang and Shang9 and weakening of the interface. Reference Ren, Nah, Tu, Xiong, Xu and Pang10 Although the importance of the electromigration damage to solder interconnects has been widely recognized and the electromigration behavior of Sn-rich solder interconnects extensively studied, not many solutions are currently available to combat or mitigate electromigration damages in solder interconnects. Among them, adopting electrical designs to minimize the driving force for electromigration, e.g., the current density, Reference Ho, Lee and Subramanian11,Reference Lienig12 introducing alloy elements in the solder alloys, Reference Zhang, Guo and Shang6,Reference Chen and Huang13–Reference Lu, Shih, Kang, Goldsmith and Flaitzb15 and replacing Cu with more stable metallizations have been reported to slow down the electromigration process. Reference Kumar, He and Chen16 However, these solutions are highly limited by other design and processing considerations such as the need for further device miniaturization, susceptibility to oxidation, and slow wetting kinetics.
In the tetragonal phase, β-tin exhibits highly anisotropic properties. Reference Dyson17–Reference Yeh and Huntington20 When Sn is connected with Cu to form a diffusion couple, the diffusivity of Cu in Sn is strongly direction-dependent so that the diffusivity along the c-axis is 500 times faster than that along the a-axis. One important consequence of this anisotropy in the Cu diffusivity is that the electromigration damage based on the Cu diffusion becomes highly dependent on the Sn grain orientations. Lu et al. were the first to report such a strong correlation between the orientation of the Sn grains and the electromigration degradation mechanism in Sn–Ag and Sn–Cu solder joints. Reference Lu, Shih, Lauro, Goldsmith and Henderson21 Wang et al. also observed that the Sn grain structure was important in controlling the kinetics of the IMC growth and void formation under electromigration. Reference Wang, Lu, Gupta, Stiborek, Shirley, Chae, Im and Ho22 The effect of Sn grain orientation on the dissolution of the Ni substrate and the precipitation of IMC had also been reported recently. Reference Huang, Yang, Ke, Hsueh and Kao23 Ho et al. reported a mathematical analysis based on crystallography and electromigration theory used to rationalize strong dependences of the Cu–Sn IMC growth and Cu consumption on Sn. Reference Ho, Yang and Hsu24 Chen et al. have investigated the relationship between the “polarity effect” of electromigration and the Sn grain orientation in Sn–Ag–Cu solder joints and found that the difference in the intermetallic layer thickness between the anode and the cathode, Δd, followed a parabolic function of the cosine of the angle, α, between the c-axis and the current direction. Reference Chen, Guo, Liu and Shang25 From these studies, it has become evident that if the fast diffusing c-axis could be turned away from the current direction, e.g., by creating a <100> texture parallel to the current direction in a solder joint, the Cu-diffusion-based electromigration damage may be greatly inhibited.
During solidification of the liquid alloys, it has been shown that magnetic fields may promote the development of the solidification texture as the grains tend to orient with their easy magnetization axis along the direction of the magnetic field. Reference Li, Wu, Sassa and Asai26–Reference Tahashi, Ishihara, Sassa and Asai28 In view of the anisotropic nature of β-tin, it may be possible to induce a preferred texture in Sn-rich solder grains by applying a magnetic field during its solidification; if the grain texture could be made so that the c-axis of the Sn grains is turned away from the current direction, significant improvement may be gained in inhibiting Cu diffusion and the resulting electromigration damage in a solder joint. In this study, a magnetic field was applied on the Sn–Ag–Cu/Cu solder joints during the reflow process. By examining the Sn grain orientation in the solidified solder joint and its electromigration behavior, we found that the magnetic anisotropy of β-Sn was indeed conducive to the <100> texture development in the reflow of Sn–Ag–Cu joint and the resulting texture was resistant to electromigration.
II. EXPERIMENTAL
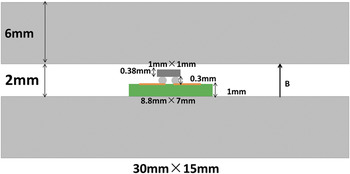
The Sn–3.0Ag–0.5Cu alloy with a melting temperature of about 217 °C was used to make flip chip solder interconnects. The diameters of the Sn–Ag–Cu solder balls were about 300 μm. To make the flip-chip solder interconnect, solder balls were first placed on the Cu under bump metal (UBM) of the printed circuit board (PCB), the soldering flux was then applied before the solder joints were reflowed at 250 °C for about 60 s in a reflow oven. During the reflow process, a magnetic field of 0.3T generated by double parallel rectangular magnets was applied on the assembly as shown in Fig. 1. The direction of magnetic field was perpendicular to the PCB plane. The reference group samples were prepared by replacing the parallel rectangular magnets with the similarly sized iron plates. To prevent oxidation, the entire fixture was immersed in an oil bath held at a constant temperature of 25 °C in the electromigration testing. The sample temperature was measured by a K-type thermocouple placed next to the solder interconnect. The current in the samples was 5 A (average current density about 7 × 10³ A/cm2), the initial temperature of the samples was about 90 ± 5 °C, and the time under current stressing was 120 h. After current stressing, the interfaces between the solder and the substrate were examined by scanning electron microscopy (SEM). The orientation of the tin grains was analyzed by electron backscattered diffraction (EBSD). The compositions of the precipitates and phases between the solders and substrates were analyzed with the energy dispersive spectrometer (EDS).
The sketch of the magnetic-field reflowing device and the solder interconnect.

One of the clear consequences of electromigration in solder interconnects is the polarity effect in the growth of the interfacial IMC at the two electrodes. The polarity effect manifests itself in the difference between the intermetallic layers at the two electrodes. So, the differences of IMC thickness Δd of solder joints were measured after current stress to study the effect of reflowing in the magnetic field on the electromigration. The thickness of the IMCs was determined with the measurement tools in SEM and Photoshop software. The SEM photos were first introduced into the Photoshop software, and then the area of the IMC was measured by the pixel analysis. The average thickness was calculated according to the following formula:
 $${d_{{\rm{IMC}}}} = {S \mathord{\left/ {\vphantom {S L}} \right. \kern-\nulldelimiterspace} L}\quad ,$$
where d IMC, S, and L were the thickness, area, and length of the IMC, respectively. In this article, all the thickness refers to the average thickness.
Magnetic measurements were performed on a superconducting quantum interference device (SQUID) (XL-7, Quantum Design, San Diego, CA) in a temperature range between 2 and 300 K. The tin single crystals along the a-axis and c-axis were packed into a plastic pipe, respectively. The assemblies were placed inside the SQUID and the relation between the magnetic field intensity H and the magnetic induction intensity M of the assemblies was measured and the magnetic susceptibility determined as:
 $$\chi = 4\pi \rho {M \mathord{\left/ {\vphantom {M H}} \right. \kern-\nulldelimiterspace} H}\quad ,$$
where ρ is the density.
III. RESULTS AND DISCUSSION
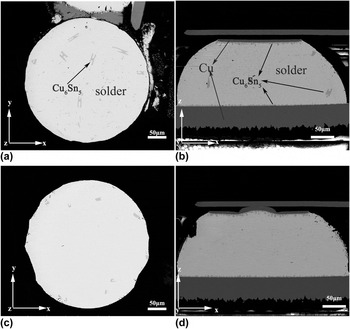
Figures 2(a) and 2(b) show the microstructure of the solder joints in the as-reflowed state for samples reflowed in a magnetic field. In the as-reflowed state, a layer of scallop-type IMCs were observed at the Sn–Ag–Cu/Cu interfaces, which were determined as Cu6Sn5 by the EDS analysis. A very thin layer of Cu3Sn also formed between the Cu6Sn5 scallops and the Cu, but was difficult to recognize in the SEM image. The IMC formed at both interfaces is symmetrical. In addition, some irregularly shaped IMCs were sparsely distributed in the solder ball. Compared with the solder joints reflowed without magnetic field, as shown in Figs. 1(c) and 1(d), there was no major difference observed.
SEM image showing the microstructures of Sn–Ag–Cu solder balls after reflowing (a), (b) in and (c), (d) without the magnetic field.

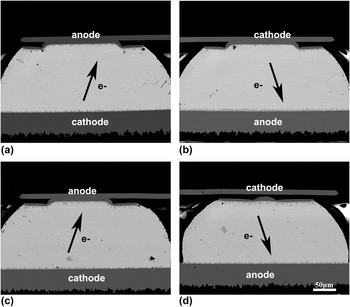
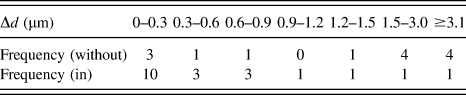
Figure 3 shows the microstructure of the solder joints after current stressing for 120 h. Compared with the initial microstructures, the IMC layers at the anode appear to be thicker than that at the cathode, evidence of the “polarity effect”. For the solder joints reflowed without magnetic field, as shown in Figs. 3(a) and 3(b), the average difference in the IMC thickness, Δd, was 1.87 μm. Among the 14 balls measured in the experiments, about 21% of them showed Δd less than 0.3 μm, while 64% of them had Δd more than 1.2 μm, as listed in detail in Table I. However, in the solder joints reflowed in magnetic field, as shown in Figs. 3(c) and 3(d), the average Δd was only 0.82 μm. Among the 20 balls measured in the experiments, about 50% of them showed Δd less than 0.3 μm, while only 15% of them had Δd more than 1.2 μm. The thinner IMC indicates that reflowing in the magnetic field has retarded the electromigration in the solder joints.
Typical microstructures of the solder joints reflowing (a), (b) without and (c), (d) in a magnetic field after current stressing.

The distribution of the differences in IMC thickness, Δd.

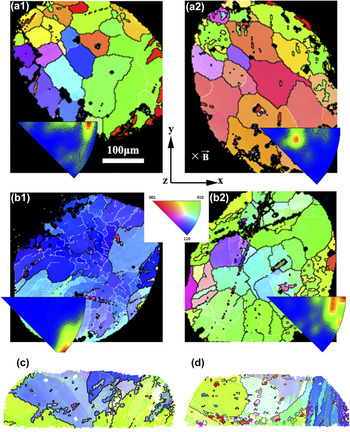
Figures 4(b1) and 4(b2) show the typical EBSD maps of the solder joints reflowed in the magnetic field. The inverse pole figures along the z-axis (IPF-z) parallel to the current direction are shown at the bottom right corner of each sample, which reflects the orientation distribution around the electron flow direction. Figures 4(c) and 4(d) show the orientations along the y-axis of the solder joints corresponding to Figs. 3(c) and 3(d). For the solder joints reflowed in the magnetic field, a preferred orientation was observed in the solder balls, compared to those reflowed without the magnetic field as shown in Fig. 4(a1) and 4(a2). The texture was identified as <001> deviated from the magnetic field direction, through an angle α that can be specified only by choosing threshold intensity.
Sn IPF-z maps of Sn–Ag–Cu solder joints reflowed (a1) (a2) without a magnetic field and (b1) (b2) in a magnetic field and (c) (d) Sn IPF-y maps of the solders corresponding to Figs. 3(c) and 3(d).

Table II lists the distribution of angle α measured in the twenty solder balls. It can be seen that the angle α in most of the samples is larger than 45°; in nearly half of the samples are even larger than 75°. Therefore, it was concluded that the c-axis of Sn grains tends to move away from the magnetic field direction during the solidification. Otherwise, the average grain size of the solders reflowed in the magnetic field was about 64 μm, while that of those reflowed without the magnetic field was 54 μm.
The distribution of the Sn grain orientations in the solder balls.

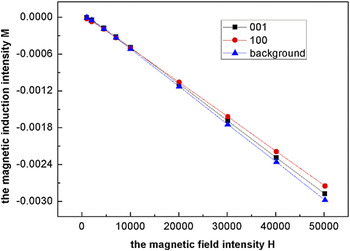
To understand the relation between the orientation of the Sn grain and the magnetic field, the magnetic susceptibility of the Sn grain along the a-axis and c-axis was determined by plotting the magnetic field intensity, H, versus the magnetic induction intensity, M, for the two samples with the magnetic field aligned either with the a-axis or c-axis of the tin single crystal as shown in Fig. 5. For reference, the background signals were also measured. The relations can be expressed as:
 $${M_c} = - 5.94 \times {10^{ - 8}}H + 9.46 \times {10^{ - 10}}\quad ,$$
 $${M_a} = - 5.55 \times {10^{ - 8}}H + 1.81 \times {10^{ - 10}}\quad ,$$
 $${M_{{\rm{background}}}} = - 6.09 \times {10^{ - 8}}H + 2.37 \times {10^{ - 10}}\quad .$$
H versus M of the assembly of the a-axis and c-axis tin single crystal and the background.

After removing the background, the magnetic susceptibilities of the Sn single crystal along the a-axis and c-axis are found to be
 $${\chi _a} = {8.0010^{ - 6}}\quad ,$$
 $${\chi _c} = {1.7710^{ - 6}}\quad .$$
By applying a magnetic field, the free energy change of the system during solidification, ΔG, can be written as ΔG = ΔG 0 + ΔE, where ΔG 0 is the change of free energy without the magnetic field and ΔE is the change due to the magnetic field. ΔE generally takes the following expression Reference Asai, Sassa and Tahashi29 :
 $$\Delta E = - {{\Delta \chi } \over {2\mu }}{B^2}V\quad ,$$
where μ is the magnetic susceptibility, B is the magnetic flux density, and V is the volume of the particle. In the temperature range of this study, μ = μ0, where μ0 is the vacuum permeability. In the above analysis, χ was taken as a constant. However, in an anisotropic material, the magnetic susceptibility varies with the crystallographic orientation as a second-order tensor
 $\tilde \chi$
, which can be expressed as:
 $$$\tilde \chi = \left[ {\matrix{ {{\chi _{11}}} & {{\chi _{12}}} & {{\chi _{13}}} \cr {{\chi _{21}}} & {{\chi _{22}}} & {{\chi _{23}}} \cr {{\chi _{31}}} & {{\chi _{32}}} & {{\chi _{33}}} \cr } } \right]\quad .$$$
Thus, the magnetic energy should be rewritten as:
 $$$E = - {V \over {2\mu }}\left[ {\matrix{ {{\chi _{11}}} & {{\chi _{12}}} & {{\chi _{13}}} \cr {{\chi _{21}}} & {{\chi _{22}}} & {{\chi _{23}}} \cr {{\chi _{31}}} & {{\chi _{32}}} & {{\chi _{33}}} \cr} } \right] \cdot \vec B \cdot \vec B\quad .$$$
For a body-centered tetragonal structure of β-Sn in Fig. 6, the a-, b-, and c-axes of the Sn unit cell are chosen as the axes of the coordinate system. If the direction of the magnetic flux density vector makes an angle of α with the c-axis, the projection of the magnetic vector onto aOb-plane makes an angle of β with the a-axis. The magnetic flux density vector can be decomposed into three components along a-, b-, and c-axes as:
 $$\vec B = \mathop \sum \nolimits {B_i}{e_i} = B\sin \alpha \cos \beta {e_1} + B\sin \alpha \sin \beta {e_2} + B\cos \alpha {e_3}\quad ,$$
where B i is the component in the x i -axis, e i is the unit vector, and B is the magnitude of the magnetic flux density vector.
Three components of
 $\vec B$
vector along a-, b-, and c-axes of tin unit cell.

For simplification, suppose B ji = 0 with j ≠ i, Eq. (8) can be written as
 $$$$E = - {V \over {2\mu }}\left[ {\matrix{ {{\chi _a}} & 0 & 0 \cr 0 & {{\chi _b}} & 0 \cr 0 & 0 & {{\chi _c}} \cr } } \right] \cdot \left( {\matrix{ {{B_1}} \cr {{B_2}} \cr {{B_3}} \cr } } \right) \cdot \left( {\matrix{ {{B_1}} \cr {{B_2}} \cr {{B_3}} \cr } } \right)\quad .$$$$
Since χ a = χ b , the magnetic energy becomes
 $$E = - {V \over {2\mu }}{B^2}\left[ {\left( {{\chi _c} - {\chi _a}} \right){{\cos }^2}\alpha + {\chi _a}} \right]\quad .$$
When the crystals of anisotropic magnetic properties are placed in a magnetic field, the crystals tend to reorient to the direction with the lowest free energy. Because χ c is smaller than χ a , the a-axis of β-tin is preferably aligned to be parallel to the magnetic field. During solidification in a magnetic field, the materials exist in a weak constraint medium (fluid) so that the crystallites formed may be rotated by the magnetization force to maintain the preferred orientation. Reference Asai, Sassa and Tahashi29 After solidification, the crystallites or grains would settle into a texture in which the c-axes of Sn grains are perpendicular to the magnetic field.
When the sample solidifies in the magnetic field, the c-axes of the different grains take an angular distribution. Assuming an axisymmetric distribution of the c-axis, with respect to the direction of B , the distribution can be calculated using the Boltzmann distribution.
 $$f\left( \alpha \right) = \exp \left( { - {{\Delta E} \over {kT}}} \right)\quad ,$$
where ΔE is the difference in the magnetization energy between two crystal orientations:
 $$\Delta E = - {V \over {2\mu }}{B^2}\left( {{\chi _c} - {\chi _a}} \right){\cos ^2}\alpha \quad .$$
Another condition indispensable for the crystal orientation is that the magnetization energy difference should be larger than thermal energy, i.e., Reference Dyson17
 $$|\Delta E{|_{{\rm{max}}}} = - {V \over {2\mu }}{B^2}\left( {{\chi _c} - {\chi _a}} \right) > kT\quad .$$
Take T = 500 K, B = 0.3T, it is found that when the diameter of grain is larger than 0.4 μm, ΔE is greater than kT. Since the grain size of β-Sn in the reflowed samples was several micrometers, the difference in the magnetization energy is large enough to affect the orientation of the Sn grain, producing the texture with the c-axis perpendicular to the magnetic field.
The polarity effect is caused by the migration of the dominant diffusing species, Cu, driven from the cathode to the anode by the electron wind under current stressing. Reference Schaich30,Reference Huntington and Grone31 Considering the anisotropic structure of β-Sn, the atomic flux of Cu in Sn should be expressed as25:
 $${J^E} = {C \over {kT}}{Z^*}eE\left( {{D_a} + {D_c}{{\cos }^2}\alpha } \right)\quad ,$$
where D a and D c are the diffusion coefficients of Cu in tin along the a-axis and c-axis, α is the angle between the c-axis and the current direction. It is clear that when the c-axis was turned away, or perpendicular to, the current direction due to the magnetic field, Cu diffusion is suppressed in the solder interconnect due to the slower rate of Cu diffusion along the orientation perpendicular to the c-axis.
IV. CONCLUSION
The magnetic susceptibilities of tin single crystal along the a-axis and c-axis were measured to be 8.00 × 10⁻⁶ and 1.77 × 10⁻⁶, respectively. Due to the difference in the magnetization energy along the a-axis and c-axis of the Sn grain, liquid Sn tends to solidify into a texture with the c-axis of Sn grain rotated close being perpendicular to the magnetic field direction when solders are reflowed in a magnetic field. The resulting grain texture was found to reduce the polarity effects of the electromigration in solder interconnects because of the slow rate of Cu diffusion in tin along the a-axis.
ACKNOWLEDGMENTS
This work was supported by the National Basic Research Program of China, Grant No. 2010CB631006, the Natural Science Foundation of China, Grant Nos. 51171191 and 51101161, the Major National Science and Technology Program of China, Grant No. 2011ZX02602, National key scientific instrument and equipment development projects of China, Grant No. 2013YQ120355, and Natural Science Foundation of Liaoning Province, Grant No. 2013020015.