I. INTRODUCTION
In recent years, amorphous Co-Fe-Si-B alloy ribbons have attracted considerable attention due to its excellent soft magnetic and magnetoimpedance (MI) properties.Reference Tannous and Gieraltowiski1, Reference Phan and Peng2 Soft magnetic properties of these alloys are attributed to almost zero magnetocrystalline anisotropy and very low saturation magnetostriction.Reference Tannous and Gieraltowiski1 Further, these alloys possess high transverse permeability through transverse domain structure. When magnetic field is applied, the transverse permeability decreases by many orders of magnitude causing increase in skin depth which leads to high MI properties. The superior soft magnetic and MI properties of these materials arise due to amorphous structure. Of the several soft magnetic alloys, Co-Fe-Si-B based amorphous alloys are found to exhibit large soft magnetic and MI properties. Studies carried out on Co-Fe-Si-B alloys indicate that boron (B) acts as a glass former and a few studies have been carried out to assess the glass forming ability (GFA) of these alloys.Reference Sun, Man, Dong, Shen, Kimura, Makino and Inoue3–Reference Arvindha Babu, Arout Chelvane, Sathya Prasad and Akhtar9 Recently, Arvindha Babu et al.Reference Arvindha Babu, Arout Chelvane, Sathya Prasad and Akhtar9 have reported the effect of wheel speed on amorphous phase formation, soft magnetic and MI properties of Co69Fe7Si14B10 alloys. Higher wheel speed (higher cooling rate) led to the formation of amorphous phase with better soft magnetic and MI properties whereas lower wheel speeds (lower cooling rate) yielded orthorhombic Co2Si phase deteriorating the soft magnetic and MI properties.
Similar to B, Zr can also be added with Co-based alloys as a glass former as it exhibits all requirements as a glass former.Reference Luborsky10 It is seen, from Miedema’s model for enthalpy of formation, that Co-B has an enthalpy of mixing ΔHmix = −9 kJ/mol atoms, while for Co-Zr it is found to be −41 kJ/mol atoms.Reference Niessen, deBoer, Boom, deChatel, Mattens and Miedema11 Since enthalpy of formation of Co-Zr is more negative, Zr addition is expected to increase GFA of Co-Fe-Si-B alloys. Hence addition of Zr for B has been attempted. In addition, Co-Zr based alloys have very low magnetostriction thus leads to very high magnetic permeability.Reference Kekalo, Nemova and Taranitchev12 In the present study, an attempt has been made to improve the soft magnetic properties of Co69Fe7Si14B10 alloys by replacing B with Zr. GFA, structure, soft magnetic and MI properties of these alloys have been investigated in detail.
II. EXPERIMENTAL
Alloys of nominal composition Co69Fe7Si14B10-xZrx (x = 0, 2.5, 5, 7.5 and 10) were prepared by melting the pure elements (purity 99.95%) in a vacuum arc melting furnace. Rapidly solidified ribbons (2 mm wide and 30 μm thick) of these alloys were prepared using a vacuum melt spinner at a wheel speed of 47 m/s. Structural characterization was carried out using x-ray diffraction (XRD) using Cu-Kα radiation (Model: Philips-PW1830, Bangalore, India). A transmission electron microscope (TEM) (FEI Tecnai-20T, Hillsboro, OR) was used to observe the microstructural features. The samples were thinned from both sides of ribbon using precision ion polishing system (PIPS) by bombarding with Ar ion. Thermal characterization of the alloys and melt spun ribbons was carried out using a differential thermal analysis (DTA) (DuPont 910 DSC, TA Instruments, New Castle, DE) at a constant heating rate of 20°C/min. Room temperature magnetization measurements were made using a vibrating sample magnetometer (ADE EV7) on rectangular strips of dimension, 2 mm × 10 mm cut from the ribbon. Room temperature coercivity and permeability measurements were carried out using a B-H loop recorder (Ferrites India, Pune, India) on the ribbon samples wound in the form of toroids at 50 Hz (line frequency). Room temperature MI measurements were carried out on 5-cm long ribbon samples with Cu-leads connected on to the sample by using pressure contacts. The impedance measurements were carried out using an impedance analyzer (Agilent 4294A, Penang, Malaysia). The applied ac current flowing across the sample was kept constant at 10 mA. The external field (H) was generated by a Helmholtz coil with axis perpendicular to the earth’s magnetic field to allow field variation from 0 to 76 Oe.
III. RESULTS AND DISCUSSION
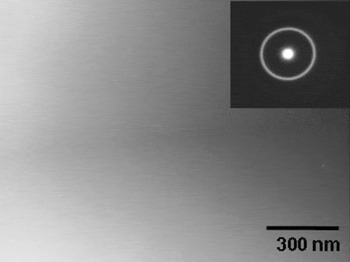
Figure 1 shows XRD patterns of all as spun ribbons prepared at the wheel speed of 47 m/s. A broad halo peak was observed in the XRD patterns of all as spun ribbons indicating the formation of a complete amorphous phase in all the alloys. Figure 2 shows typical TEM bright-field image of x = 0 alloy ribbon and inset shows the corresponding Selected Area Electron Diffraction pattern (SAD). Featureless contrast in the bright-field image and a bright halo in the SAD pattern confirm the formation of amorphous phase.
XRD patterns of as spun ribbons of all alloys.

TEM bright-field image of x = 0 as-spun ribbon.

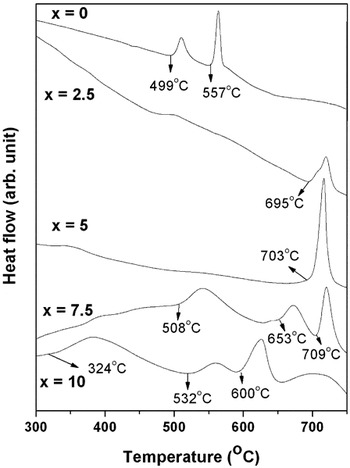
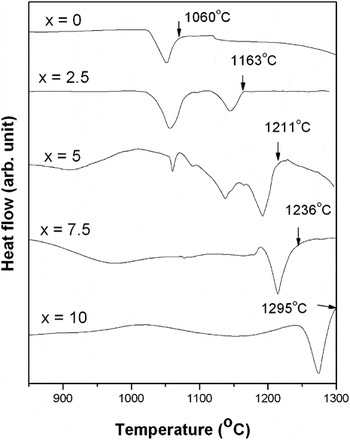
Figure 3 shows DTA thermograms of all as spun ribbons up to 750 °C obtained at the heating rate of 20 °C/min. It can be observed from the plot that as spun ribbon containing no Zr exhibits two exothermic peaks with the onset temperature of crystallization at 499 and 557 °C indicating that these ribbons crystallize in two stages. (x = 2.5 and 5) ribbons exhibit only one exothermic peak with the onset of crystallization temperature at 695 and 703 °C respectively. Replacing B with 5 at.% Zr changes the crystallization behavior from two stages to a single stage. It is interesting to note that, x = 7.5 amorphous ribbon has three exothermic peaks with onset temperatures at 508, 653 and 709 °C. A similar behavior is observed for x = 10 amorphous ribbon suggesting that these ribbons crystallize in three stages. The thermal stability of amorphous phase appears to increase more on addition of Zr up to 5% whereas it is decreased beyond 5% Zr. Figure 4 shows the DTA thermograms of arc-melted ingots obtained at the heating rate of 20 °C/min. In all alloys, the endothermic peaks observed indicate the melting. In (x = 0, 7.5 and 10) alloys, only one melting peak is observed whereas (x = 2.5 and 5) alloys show two and three melting peaks respectively. It is noteworthy that liquidus temperature (temperature at which the alloy becomes completely liquid) increases with increasing Zr content.
DTA thermograms of as-spun ribbons at a heating rate of 20 °C/min.

DTA thermograms of arc-melted ingots at a heating rate of 20 °C/min.

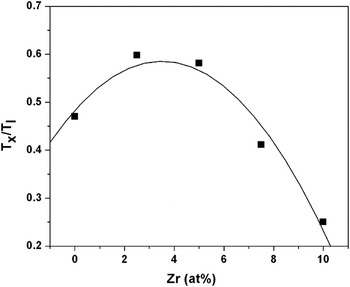
GFA is related to three temperatures (Tg—glass transition temperature, Tx—onset of crystallization temperature and Tl—liquidus temperature) and it can be measured either using a single parameter or by a proper combination of these three temperatures.Reference Kekalo, Nemova and Taranitchev12 For the alloys, which show well-defined glass transition temperature, reduced glass transition temperature, Tg/Tl or undercooled region, ΔT = Tg-Tx have been used to find out the GFA. However, for the alloys which do not show a well-defined Tg, Mondal and Murty have recently proposed a GFA parameter, α = Tx/Tl, which has a good relation with critical cooling rate for glass formation.Reference Mondal and Murty13 Since Co69Fe7Si14B10-xZrx (x = 0, 2.5, 5, 7.5 and 10) alloys do not show a well-defined Tg ,Tx/Tl term has been used to calculate the GFA of these alloys. Figure 5 shows the variation of Tx/Tl with Zr content. In can be observed that Tx/Tl increases initially with Zr content and then decreases for higher Zr content. Although liquidus temperature increases with increase in Zr content, the change in Tx in a random manner appears to change the GFA. Based on this calculation, (x = 2.5 and 5) alloys are considered as better glass formers.
Variation of GFA parameter (Tx/Tl) with Zr content.

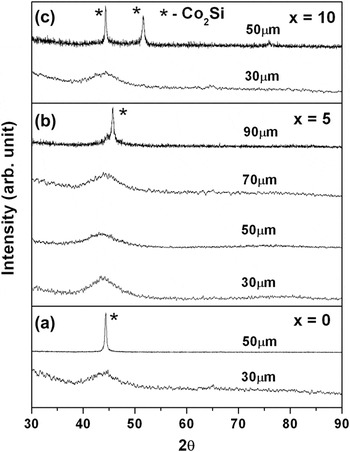
To verify the GFA parameter α, melt spinning experiments have been carried out to produce the ribbons having thickness from 30 to 90 μm by varying the ejection pressure during melt spinning experiment. Figure 6(a) shows XRD patterns of x = 0 as spun prepared at different ejection pressures having a thickness of 30 and 50 μm. It can be seen that complete amorphous phase formation is observed in the case of 30-μm ribbon whereas Co2Si phase is observed for 50-μm ribbon. In case of (x = 5) alloy, complete amorphous formation is observed for thickness up to 70 μm and Co2Si phase formation takes place for 90-μm ribbon [Fig. 6(b)]. (x = 2.5) alloy ribbons follows the same behavior as that of (x =5) alloy ribbons. (x = 10) ribbon forms amorphous phase up to 30 μm [Fig. 6(c)] and (x = 7.5) ribbons follows the same trend. This result establishes experimentally that (x = 2.5 and 5) alloys are better glass formers than other alloys. As compared with alloys having only B or Zr, alloys having combination of Zr and B possess higher GFA. Based on this study, it may be concluded that GFA parameter, α = Tx/Tl can be used for calculating GFA of Co-Fe-Si-B-Zr alloys.
XRD patterns of as spun ribbons of (a) x = 0, (b) x = 5 and (c) x = 10 alloys having different thickness.

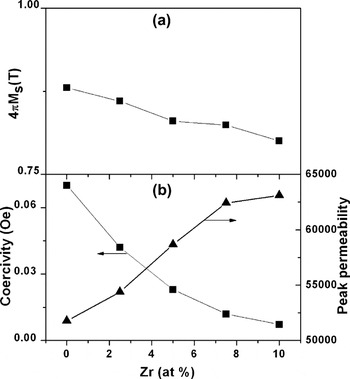
Figure 7(a) shows the variation of 4πMs with Zr content which shows that saturation magnetization decreases with the increase in Zr content. It is reported that in Co-based alloys, both B and Zr decrease the saturation magnetization.Reference Mendes, Machado, Pereira, Rezende, Montenegro, Altoe and Missell6 In our study, the replacement of Zr for B decreases the saturation magnetization. This suggests that Zr has more pronounced effect in decreasing the saturation magnetization than B. The coercivity (Hc) and the peak permeability (μp) have been derived from the B-H loops obtained in B-H loop tracer. Figure 7(b) shows the variation of coercivity (Hc) and peak permeability (μp) with Zr content. It can be observed that coercivity decreases and peak permeability increases with the increase in Zr content. Although saturation magnetization [Fig. 7(a)] decreases with increase in Zr content, the decrease in coercivity with Zr content leads to the increase in peak permeability. Generally, magnetocrystalline anisotropy and magnetostriction are the two important parameters which affect the soft magnetic parameters. In our study, all alloys form amorphous phase thus leading to almost zero magnetocrystalline anisotropy. It is reported that the Co-Zr based amorphous alloys have very low magnetostriction thus lead to high magnetic permeability.Reference Kekalo, Nemova and Taranitchev12 In our study, the improvement in soft magnetic properties with the replacement of Zr for B may be attributed to the decrease of magnetostriction.
Variation of soft magnetic properties (a) 4πMs and (b) coercivity and peak permeability with Zr content.

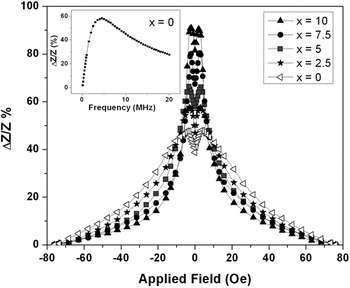
Figure 8 (Inset) shows the variation of MI with frequency for x = 0 as spun ribbon. The MI value is found to increase with increasing frequency upto 5 MHz and decreases with further increase in frequency. The initial increase in MI value is attributed to decrease in skin effect which causes the transverse permeability to increase resulting in a net increase in MI. The decrease in MI values at higher frequencies is due to the damping of domain wall motion as result of eddy currents around domain walls.Reference He, Guo, Shen, He and Kronmuller14Figure 6 shows the variation of MI with applied magnetic field at 5 MHz for all as-spun ribbons. It can be observed that the MI increases initially with the applied field and decreases for higher applied fields in both positive and negative field directions. This two-peak behavior is due to the presence of transverse anisotropy in the material. The MI value increases when the applied steady magnetic field is less than the anisotropy field and attains a maximum (peak) value when the steady field balances the transverse anisotropy field. With further increase of the steady magnetic field, the magnetization rotation dominates the transverse magnetization process leading to a decrease in the transverse permeability which ultimately reaches a very low and constant value. It can be observed that peak MI value does not change much with Zr content and the peak MI value increases with the increase in Zr content. A maximum of 90% MI is observed in x = 10 as spun ribbon. The sharpness of the peak also increases with Zr content which shows that impedance response of the material per unit magnetic field increases. The increase in MI properties with Zr may be attributed to enhancement of soft magnetic properties (coercivity and peak permeability).
Magnetoimpedance as a function of magnetic field measured at 5 MHz for as-spun ribbons. (Inset shows MI as a function of frequency for x = 0 alloy).

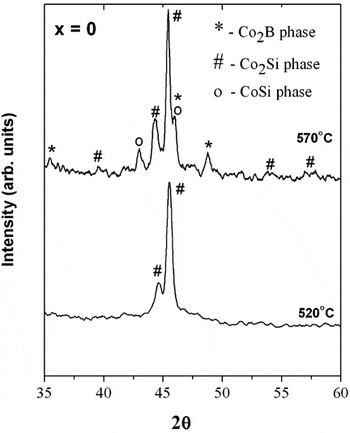
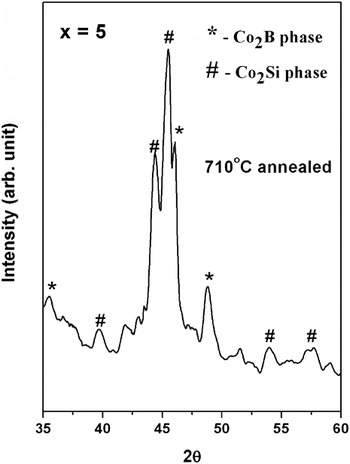
Figure 9 shows XRD patterns of (x = 0) ribbon annealed at 520 and 570 °C. It can be observed that annealing at 520 °C leads to the formation of orthorhombic Co2Si phase which corresponds to the first exothermic peak observed in DTA thermogram. Annealing at 570 °C forms tetragonal Co2B and cubic CoSi phases together, which correspond to the second exothermic peak in DTA thermogram. Figure 10 shows XRD patterns of (x = 5) ribbon annealed at 710 °C which shows the co-formation of orthorhombic Co2Si phase and tetragonal Co2B phases. This corresponds to the exothermic peak at 703 °C in (x = 5) DTA thermogram. Similar phase formation is observed for (x = 2.5) alloy ribbons. This indicates that Co2Si and Co2B phase formation is shifted to higher temperatures with Zr replacement for B. Figure 11 shows XRD patterns of (x = 10) ribbon annealed at 450, 550 and 650 °C. Annealing at 450 °C forms orthorhombic Co2Si phase, at 550 °C forms cubic Co2Zr phase and at 650 °C forms cubic CoSi phases which correspond to first, second and third exothermic peaks in x = 10 DTA thermogram respectively. Similar trend was exhibited by (x = 7.5) alloy ribbon on annealing.
XRD patterns of annealed ribbons of x = 0 alloy.

XRD pattern of annealed ribbon of x = 5 alloy.

XRD patterns of annealed ribbons of x = 10 alloy.

It was seen from B-H loop measurements that very high coercivity (85—105 Oe) and very low permeability (50—80) were observed for annealed ribbons. This is attributed to the presence of magnetocrystalline anisotropy arising from the crystalline nature of the annealed ribbons. No MI effect was observed for each of all annealed ribbons, which is attributed to magnetic hardness of the secondary phases formed during annealing.
IV. CONCLUSION
Rapidly solidified ribbons of Co69Fe7Si14B10-xZrx (x = 0, 2.5, 5, 7.5 and 10) alloys were prepared using melt spinning and its GFA, structural and soft magnetic properties have been studied. All alloys form amorphous phase on melt spinning, however alloys with Zr content 2.5 and 5 at.% are found to have high GFA parameter (α = Tx/Tl) values than other alloys. (x = 2.5 and 5) alloys form amorphous phase up to 70 mm thickness whereas other alloys form glass up to 30 mm thickness which corroborates well with GFA calculation. Saturation magnetization of the amorphous ribbon decreases on replacement of B by Zr which reveals Zr has more pronounced effect in decreasing saturation magnetization. Replacement of B by Zr decreases the coercivity and increases the permeability leading to an increase in MI value up to 90%. Annealing of amorphous ribbons leads to the formation of CoSi, Co2Si, Co2B and Co2Zr phases causing deterioration of soft magnetic and MI properties due to the presence of magnetocrystalline anisotropy.
ACKNOWLEDGMENTS
This work was supported by Defence Research and Development Organization, Govt. of India. The authors are grateful to Dr. A.K. Singh, DMRL, Hyderabad, India, for x-ray diffraction studies and A.P. Srivastava, BARC, Mumbai, India, for TEM studies. The authors are thankful Dr. G. Malakondaiah, Director, DMRL, Hyderabad, India, for continued support and permission to publish this work.