Introduction
Mastitis is recognized as the most important disease in dairy production as it affects profitability by adversely affecting udder health. Poor udder health affects milk production and quality, resulting in multiple economic losses (Colleau and Le Bihan-Duval, Reference Colleau and Le Bihan-Duval1995). Improvement of udder health is therefore desirable for numerous reasons (Shook, Reference Shook1989).
There has been an increase in clinical mastitis cases caused by environmental bacteria in well-managed herds, despite improvements in udder health management (Gonzalez et al., Reference Gonzalez, Jasper, Kronlund, Farver, Cullor, Bushnell and Dellinger1990). Dunklee et al. (Reference Dunklee, Freeman and Kelley1994) suggested that developments in health care allow immunologically inferior animals to reproduce. Although improvement of health care standards is welcome, breeding principles that have long-lasting, cumulative and permanent effects should be developed and implemented.
Direct selection for resistance to mastitis is not widely practiced because of its low heritability (Amin et al., Reference Amin, Gere and Kishk2002; Zwald et al., Reference Zwald, Weigel, Chang, Welper and Clay2004; Koivula et al., Reference Koivula, Mantysaari, Negussie and Serenius2005) and the fact that mastitis incidences are difficult to measure. In view of its medium to high genetic correlation with and its higher heritability than mastitis, Mrode and Swanson (Reference Mrode and Swanson1996) considered somatic cell count (SCC) as the most suitable indicator of mastitis resistance. SCC is relatively easy and inexpensive to measure and is routinely recorded in most animal recording schemes, including South Africa. The distribution of SCC is positively skewed and its variances among groups or herds are heterogeneous (Ali and Shook, Reference Ali and Shook1980); hence, SCC is usually transformed logarithmically to somatic cell score (SCS). SCS and mastitis are however, not considered as expressions of the same trait, as shown by their genetic correlation of about 0.50 to 0.70 (Mrode and Swanson, Reference Mrode and Swanson1996; Rupp and Boichard, Reference Rupp and Boichard1999; Koivula et al., Reference Koivula, Mantysaari, Negussie and Serenius2005).
The use of udder conformation traits as indicator traits has been suggested as a means of improving the accuracy of selection for resistance to mastitis (DeJong and Lansbergen, Reference DeJong and Lansbergen1996; Gengler and Groen, Reference Gengler and Groen1997; Mrode et al., Reference Mrode, Swanson and Winters1998). These traits are routinely measured in most animal breeding schemes. In addition, linear-type traits are more heritable than mastitis incidence and SCS (Rupp and Boichard, Reference Rupp and Boichard1999; DeGroot et al., Reference DeGroot, Keown, Van Vleck and Marotz2002; Marie-Etancelin et al., Reference Marie-Etancelin, Astruc, Porte, Larroque and Robert-Granie2005).
In South Africa, selection in Jersey cattle has been mostly on milk yield, which has resulted in a considerable increase in genetic merit for milk production, over the past two decades (Mostert et al., Reference Mostert, Banga, Groeneveld and Kanfer2004 and Reference Mostert, Theron, Kanfer and van Marle-KÖste2006b). Selection on milk production has been observed to have an adverse effect on udder health (Castillo-Juarez et al., Reference Castillo-Juarez, Oltenacu and Cienfuegos-Rivas2002; Hansen et al., Reference Hansen, Lund, Sorensen and Christensen2002; Koivula et al., Reference Koivula, Mantysaari, Negussie and Serenius2005). Serrano et al. (Reference Serrano, Perez-Guzman, Montoro and Jurdo2003) pointed out that a fixation of alleles that diminish mastitis resistance occurs in breeds that have a long history of selection to improve milk yield. However, in South Africa, selection for milk yield may have changed the frequency of alleles that confer resistance to mastitis as a correlated response to selection on milk yield. Use of SCS to improve mastitis resistance as the only indicator trait results in low accuracy of selection, which can be improved by incorporating other indicator traits, such as udder-type traits, into the selection criteria. Genetic correlations between SCS and udder-type traits are needed to properly evaluate the usefulness of selection on udder characteristics. This would help identify udder-type traits that may help reduce the rate of increase of mastitis incidence associated with increase in milk yield.
The primary objective of this study was to estimate genetic parameters of udder health and udder-type traits in order to enable more accurate selection for improved udder health in South African Jersey cattle. There is a current national effort to build a comprehensive selection index for Jersey cattle in South Africa. Information generated from this study should be useful in building a robust index.
Material and methods
Traits
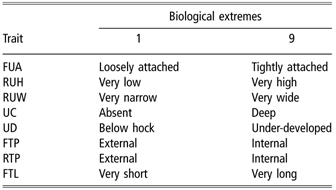
Traits included in the analyses were SCS for the first three lactations (SCS1, SCS2 and SCS3) and udder-type traits (fore udder attachment (FUA), rear udder height (RUH), rear udder width (RUW), udder cleft (UC), udder depth (UD), fore teat placement (FTP), rear teat placement (RTP) and fore teat length (FTL)). Udder-type traits were classified by 55 Jersey Cattle Breeders Society classifiers on cows in their first lactation, on a linear biological scale of one to nine. These cows were aged between 17 and 36 months at calving and between 18 and 40 months at classification. Average age at calving was 28 months with a standard deviation of 6 months, while age at classification averaged 32 months with 6 months’ standard deviation. The biological extremes and illustrations of udder-type traits are shown in Table 1.
Udder-type traits and their scoring system
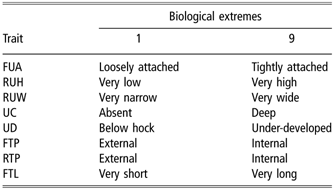
FUA = fore udder attachment; RUH = rear udder height; RUW = rear udder width; UC = udder cleft; UD = udder depth; FTP = fore teat placement; RTP = rear teat placement; FTL = fore teat length.
Data
Test-day data were obtained from the National Milk Recording Scheme of South Africa and type traits data were obtained from the South African Jersey society. Lactation data comprising the first three lactations were edited to remove animals with missing birthdates, calving dates and sires. As SCC has a skewed and lognormal distribution (Schukken et al., Reference Schukken, Leslie, Weersink and Martin1992), and its variances among groups are heterogeneous, SCS was defined by logarithmic transformation (log10SCC) of SCC (Ali and Shook, Reference Ali and Shook1980). Average SCS for each lactation was calculated and cows with less than four test-day SCS records per lactation were removed. Further edits were done to remove: (i) test-day milk yield less than 1 kg and greater than 70 kg and (ii) lactation length less than 5 days and greater than 300 days for udder-type traits at classification (Mostert et al., Reference Mostert, Theron, Kanfer and van Marle-KÖste2006a). Lactations less than 150 and greater than 305 days for SCS were also not included. These are considered not to represent ‘official lactations’ under the standards of the South African National Animal Improvement Scheme.
Two seasons of calving were defined, namely summer (October to March) and winter (April to September). Although information on lactation number was available, a restriction was imposed on age at calving to exclude cows with lactation numbers that did not fall within the standard ages. The restriction was that the respective ages of cows in the first three lactations were 17–40, 29–53 and 41–67 months (Mostert et al., Reference Mostert, Banga, Groeneveld and Kanfer2004 and Reference Mostert, Theron, Kanfer and van Marle-KÖste2006a). Test-day data were merged with udder-type data.
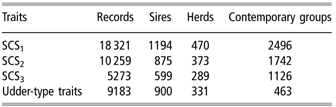
Contemporary groups for lactation SCS were created by concatenating herd, year and season of calving. Herd, year, season of classification and classifier were concatenated to create cotemporary groups for udder-type traits. Each contemporary group included in the analyses had at least five cows and two sires. Cows without a first lactation SCS record were removed to take into account the selection of cows, which made subsequent records and to avoid selection bias. The final data set is shown inTable 2.
Structure of the Jersey data analysed
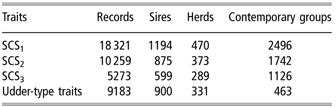
SCS1 = first lactation somatic cell score; SCS2 = second lactation somatic cell score; SCS3 = third lactation somatic cell score.
Covariance component estimation
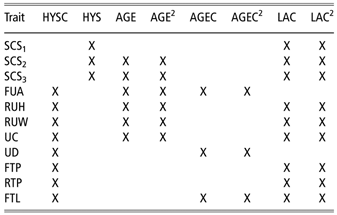
The (co)variance components for SCS and udder-type traits were estimated using variance component estimation-restricted maximum likelihood (VCE-REML) version 5 of Kovac and Groeneveld (Reference Kovac and Groeneveld2003). A series of multi-trait analyses for SCS and udder-type traits were conducted. In addition to contemporary group, fixed effects included for SCS were lactation length and age at calving, while for udder-type traits were lactation length and age at classification. These fixed effects are shown in Table 3. The mixed model equation used for the multi-trait analyses is given below

The expectations and covariance structures for the multi-trait analysis are as follows:

where yi is the vector of records for the ith trait, βi is the vector of fixed effects for the ith trait, vectors of random effects consisted of random animal additive genetic (ui) and residual environmental (ei) effects, incidence matrices Xi and Zi relate fixed and random animal additive genetic effects to observations, respectively, A is the numerator relationship matrix, I is an identity matrix,  and
 are, respectively, the genetic and residual variances for the ith trait and
 and
 are the genetic and residual covariances between traits.
Effects included in the covariance component estimation
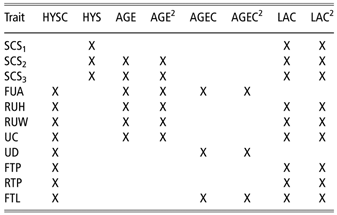
X indicates effect included; HYSC = herd–year–season of classification-classifier; HYS = herd–year–season of calving; AGE = age at calving; AGE2 = square of age at calving; AGEC = age at classification; AGEC2 = square of age at classification; LAC = lactation length; LAC2 = square of lactation length; SCS1 = first lactation somatic cell score; SCS2 = second lactation somatic cell score; SCS3 = third lactation somatic cell score; FUA = fore udder attachment; RUH = rear udder height; RUW = rear udder width; UC = udder cleft; UD = udder depth; FTP = fore teat placement; RTP = rear teat placement; FTL = fore teat length.
Trends
Genetic trends of SCS and udder-type traits were estimated by first estimating breeding values using the prediction and estimation programme (PEST) of Groeneveld et al. (Reference Groeneveld, Kovac and Wang2001) for each trait. Then averages within year of birth were calculated and plotted. Phenotypic records of SCS were averaged within year of birth and plotted to yield phenotypic trends.
Results
Descriptive statistics
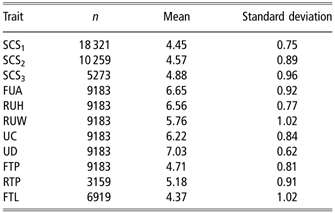
The structure of the data set and descriptive statistics of traits for the data used are shown in Table 4. SCS had highest (4.88) and lowest (4.45) scores in the third and first lactations, respectively. Nearly half of the animals did not have udder-type scores. Scores of udder-type traits ranged from 4.37 for FTL to 7.03 for UD.
Summary statistics for the Jersey data
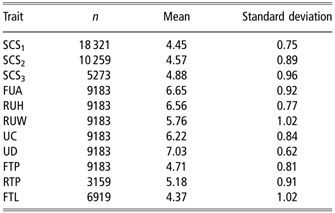
SCS1 = first lactation somatic cell score; SCS2 = second lactation somatic cell score; SCS3 = third lactation somatic cell score; FUA = fore udder attachment; RUH = rear udder height; RUW = rear udder width; UC = udder cleft; UD = udder depth; FTP = fore teat placement; RTP = rear teat placement; FTL = fore teat length.
Heritability estimates
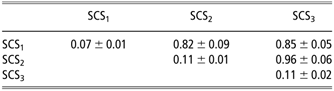
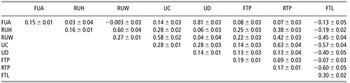
Heritability estimates of SCS shown in Table 5 in the first three lactations were very low. The respective heritability estimates for the first three lactations were 0.07 ± 0.01, 0.11 ± 0.01 and 0.11 ± 0.02. Estimates of heritabilities for udder-type traits ranged from 0.14 ± 0.01 for UD to 0.30±0.02 for FTL. These are shown in Table 6.
Heritability estimates (diagonal) and genetic correlations (above-diagonal) among lactational somatic cell score (SCS)
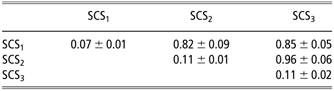
SCS1 = first lactation somatic cell score; SCS2 = second lactation somatic cell score; SCS3 = third lactation somatic cell score.
Heritability estimates (diagonal) and genetic correlations (above-diagonal) among udder-type traits

FUA = fore udder attachment; RUH = rear udder height; RUW = rear udder width; UC = udder cleft; UD = udder depth; FTP = fore teat placement; RTP = rear teat placement; FTL = fore teat length.
Genetic correlations
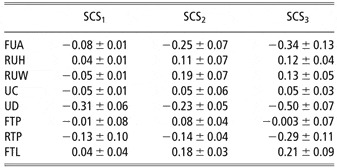
The genetic correlations among lactational SCS were all generally high and are shown in Table 5. The lowest genetic correlation (0.82 ± 0.09) was between lactations one and three, while the highest genetic correlation of 0.96 ± 0.06 was between second and third lactational SCS. Table 6 contains the genetic correlations among udder-type traits. The highest genetic correlation was 0.81 ± 0.03 between FUA and UD. The lowest correlation was very low (−0.003 ± 0.03) between FUA and RUW. The genetic correlations between udder-type traits and lactation SCS are shown in Table 7. The correlations ranged from −0.003 ± 0.07 between FTP and SCS in third lactation, to −0.50 ± 0.07 between UD and SCS in third lactation.
Genetic correlations between lactation somatic cell score (SCS) and udder-type traits

SCS1 = first lactation somatic cell score; SCS2 = second lactation somatic cell score; SCS3 = third lactation somatic cell score; FUA = fore udder attachment; RUH = rear udder height; RUW = rear udder width; UC = udder cleft; UD = udder depth; FTP = fore teat placement; RTP = rear teat placement; FTL = fore teat length.
Trends
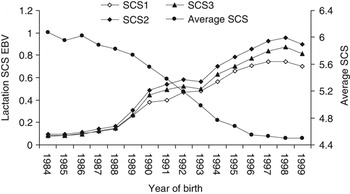
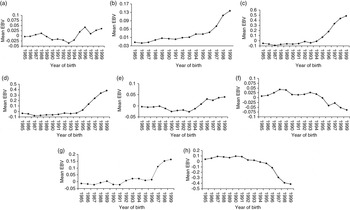
Genetic and phenotypic trends for SCS are shown in Figure 1. The estimated breeding values (EBV) increased at an average rate of 0.04 SCS per year from 1984 to 1999, while the phenotypic trend decreased at about 0.10 SCS per year during the same period. Genetic trends for udder-type traits are shown in Figure 2a–h. Genetic trends for UD and FUA were relatively constant from 1985 to 1999. UC, RUH and width were relatively constant from 1985 to 1993, while RTP was constant to 1996, and then gradually increased until 1999. FTP and length both decreased from 1985 to 1999.
Genetic (primary axis) and phenotypic (secondary axis) trends for somatic cell score.

(a) Genetic trend for fore udder attachment, (b) genetic trend for rear udder height, (c) genetic trend for rear udder width, (d) genetic trend for udder cleft, (e) genetic trend for udder depth, (f) genetic trend for fore teat placement, (g) genetic trend for rear teat placement and (h) genetic trend for fore teat length.

Discussion
Heritability estimates of SCS
Estimates of heritabilities reflect the generally low heritability of SCS, in agreement with most other studies (Reents et al., Reference Reents, Jamrozik, Schaeffer and Dekkers1995; Serrano et al., Reference Serrano, Perez-Guzman, Montoro and Jurdo2003; Mostert et al., Reference Mostert, Banga, Groeneveld and Kanfer2004; Dube et al., Reference Dube, Dzama and Banga2008). Estimates are similar to those obtained using lactation SCS averages but higher than those from individual test-day models. Test-day models account for more environmental variation than lactation models, and hence yield lower estimates. The low heritability of SCS will result in slow response to selection for resistance to mastitis. This will be exacerbated by the less than perfect genetic correlation of about 0.50 to 0.70 between SCS and mastitis (Mrode and Swanson, Reference Mrode and Swanson1996; Rupp and Boichard, Reference Rupp and Boichard1999; Koivula et al., Reference Koivula, Mantysaari, Negussie and Serenius2005), when SCS is used as the only indicator trait.
Genetic correlations among lactation SCS
The genetic correlations among lactation SCS were similar to those reported by Reents et al. (Reference Reents, Jamrozik, Schaeffer and Dekkers1995), Poso and Mantysaari (Reference Poso and Mantysaari1996), Boettcher et al. (Reference Boettcher, Dekkers and Kolstad1998), Carlen et al. (Reference Carlen, Strandberg and Roth2004) and Mostert et al. (Reference Mostert, Banga, Groeneveld and Kanfer2004). In addition Dube et al. (Reference Dube, Dzama and Banga2008) reported similar findings in South African Holstein cattle. Mrode and Swanson (Reference Mrode and Swanson2003) however obtained lower correlations for lactation one with lactations two and three. Higher correlations observed between adjacent lactations may be because adjacent lactations are under the control of more common genes. SCS in second and third lactations can be considered as repeated measures of the same trait.
Heritability estimates of udder-type traits
The heritability estimates obtained in this study compared well with those obtained recently in the same population (Theron and Mostert, Reference Theron and Mostert2004) as well as in several other studies (Boettcher et al., Reference Boettcher, Dekkers and Kolstad1998; Fuerst-Waltl et al., Reference Fuerst-Waltl, Solkner, Essl, Hoeschele and Fuerst1998; Setati et al., Reference Setati, Norris, Banga and Benyi2004; Dube et al., Reference Dube, Dzama and Banga2008). Monardes et al. (Reference Monardes, Cue and Hayes1990) obtained much lower estimates for FUA, UC, fore and RTPs. Such differences may be attributed to different sampling systems, populations, models and definition of the traits. Udder-type traits exhibit moderate heritability in South African Jersey cattle, implying that some genetic improvement may be achieved when selection is applied on these traits.
Genetic correlations among udder-type traits
Genetic correlations among udder-type traits for the Jersey breed were generally lower than most literature estimates (Sorensen et al., Reference Sorensen, Jensen and Christensen2000; DeGroot et al., Reference DeGroot, Keown, Van Vleck and Marotz2002). Exceptions were correlations between UD and FUA, RUW and UC, and FTL and the rest of the traits, which were higher than most previous estimates. Rogers et al. (Reference Rogers, Hargrove, Lawlor and Ebersole1991) and Boettcher et al. (Reference Boettcher, Dekkers and Kolstad1998) reported higher genetic correlations compared to those obtained in this study. The variation in genetic correlations among udder-type traits shows differences in the selection pressures applied on them in different populations and the interaction of genes coding for the different traits among other reasons. It is vital therefore that relevant parameters be used when designing selection programs.
Genetic correlations between udder-type traits and SCS
Estimates of correlations between udder-type traits and SCS were generally higher than those reported recently by Banga and Mostert (Reference Banga and Mostert2004) on the same population, and most other literature estimates (Rogers et al., Reference Rogers, Hargrove, Lawlor and Ebersole1991; Zhang et al., Reference Zhang, Dekkers, Banos and Burnside1994; Boettcher et al., Reference Boettcher, Dekkers and Kolstad1998). Estimates were however within the range of those obtained by Rupp and Boichard (Reference Rupp and Boichard1999), DeGroot et al. (Reference DeGroot, Keown, Van Vleck and Marotz2002) and Dube et al. (Reference Dube, Dzama and Banga2008). The results suggest that deep, loosely attached udders with widely placed rear teats are associated with high SCS. This may be due to the fact that deeper udders are more prone to injury and contamination due to their position relative to the ground. Narrowly placed rear teats are associated with low somatic cells, probably because of easy handling during machine milking. The genetic correlation between teat length and SCS is similar to that obtained by Rogers et al. (Reference Rogers, Hargrove, Lawlor and Ebersole1991), who suggested that longer teats are prone to injury due to housing, handling and milking machine incompatibility.
Trends of SCS
The increases in genetic trends for SCS are similar to those reported by Dube et al. (Reference Dube, Dzama and Banga2008) and indicate deterioration in resistance to mastitis. These trends may be a correlated response to intense selection for increased milk yield, which has remarkably increased genetic merit for milk yield in the past two decades (Mostert et al., Reference Mostert, Banga, Groeneveld and Kanfer2004 and Reference Mostert, Theron, Kanfer and van Marle-KÖste2006b). Intense selection for milk yield causes an unfavourable response in udder health (Castillo-Juarez et al., Reference Castillo-Juarez, Oltenacu and Cienfuegos-Rivas2002; Hansen et al., Reference Hansen, Lund, Sorensen and Christensen2002; Koivula et al., Reference Koivula, Mantysaari, Negussie and Serenius2005). Furthermore, the direction of selection of RUH and UC, which might also have been a correlated response to selection for increased milk yield, might have resulted in increased SCS. This is supported by the increase in the scores of these udder-type traits. Their genetic correlations with SCS may be low, but their long-term effect might have been notable.
The decrease in milk SCC, similar to that observed by Dube et al. (Reference Dube, Dzama and Banga2008), may be attributable to improved udder health management. Such improvements in management are however not sustainable if they are counteracted by a deterioration in genetic merit, shown by the increasing genetic trend of SCS. These improvements allow immunologically inferior animals to reproduce (Dunklee et al., Reference Dunklee, Freeman and Kelley1994). South African Jersey Breeders and producers are however not aware of the deterioration in udder health at the genetic level as this has not been demonstrated in any previous study.
Genetic trends of udder-type traits
The genetic trends of udder-type traits are similar to those obtained by Theron and Mostert (Reference Theron and Mostert2004) and Dube et al. (Reference Dube, Dzama and Banga2008). During the period after 1992, Jersey cows progressively had more tightly attached, higher, shallower udders with more pronounced UCs. Teat lengths were becoming shorter, while front teats became wider apart. The trends of some traits may have resulted from selection for higher milk production. Harris et al. (Reference Harris, Freeman and Metzger1992) pointed out that selection to improve milk production is likely to increase udder dimension and weaken FUA and depth. Genetic trends of most udder-type traits followed clearly discernible trends over the years, showing how responsive they are to selection. Changes may be expected if selection is carried out on some of these traits, which may also bring about a correlated improvement in susceptibility to mastitis.
Conclusions
Selection should be against loosely attached deep udders with widely placed rear teats. The decreasing phenotypic trends of SCS show that udder health management has been improving. These improvements have however been coupled with a consistent decline in genetic merit for resistance to mastitis. It is therefore imperative to improve the accuracy of selection for improved udder health in South African Jersey cattle. The information generated here closes a big hole in the South African Jersey cattle industry. It will be important in the development of a comprehensive national merit index, which will include udder health, reproduction and milk production and associated traits.
Acknowledgements
This research was supported by the Technology and Human Resources Industry Programme (THRIP) and conducted at the South African Agricultural Research Council (ARC). The South African Milk Recording Scheme and Jersey Society provided milk and type traits data, respectively.