I. INTRODUCTION
The use of in situ microscopy and indentation techniques to probe the initial stages of elastic–plastic deformation is now four decades old.Reference Gane and Bowden1–Reference Soer, Aifantis and De Hosson8 Theories regarding the “staircase” yield events, seen as rapid increases in displacement in load-controlled indentation, have been presented. In metallic systems, the loading curves obtained in such measurements have suggested nucleation of discrete dislocations in the metal, as well as fracture of the native oxide.Reference Gerberich, Nelson, Lilleodden, Anderson and Wyrobek2–Reference Soer, Aifantis and De Hosson8 Although nucleation of dislocations in the underlying metal and fracture of the oxide overlayer are physically quite different, the resulting indentation load–depth profile is similar. In this article, electrical contact resistance (ECR) measurements are taken simultaneously with depth-sensing nanoindentation to deconvolute these two processes.
Conductive indentation has previously been used in situ to investigate phase transformations in SiReference Ruffell, Bradby, Williams and Warren9 and GaAs,Reference Nowak, Chrobak, Nagao, Vodnick, Berg, Tukiainen and Pessa10 for measuring dielectric breakdown,Reference Sharma and Thomas11 to estimate the contact area under nanoindenter tips,Reference Fang, Muhlstein, Collins, Romasco and Friedman12 to evaluate wear of ionic thin films,Reference Bhushan, Palacio and Kinzig13 to probe the fracture of an oxide layer and subsequent pull-off forces,Reference Pethica and Tabor14 and to investigate the presence of organic contamination layers.Reference Kim, Pradeep, DelRio and Cook15 These ECR experiments have shown that it is possible to extract qualitatively useful information regarding the deformation of the material under the indenter, above and beyond that of a simple load–depth profile. Additionally, such experiments have demonstrated that the theoretical and experimental contact areas of a spherical tip and flat surface could be correlated to, but not completely quantified with, the Maxwell conductance model.Reference Maxwell16, Reference Holm17 The Maxwell model relates contact area to changes in conductance caused by a constriction in the electronic transport in the diffusive regime, where the contact diameter, d, is much larger than the mean free path of the electron, λ. The Maxwell conductance, G M, has a linear relation with the contact diameter, d, and is inversely proportional to ρ e, the average resistivity of the indenter and substrate. This gives

This model was derived for elastic contacts in a circular constriction for a “ball and flat” model. Surface roughness effects can also play a large role in the actual contact area.Reference Holm17–Reference Kogut and Komvopoulos19 For significantly smaller contacts, on the order of a few square nanometers, the contact is said to be in the Sharvin, or ballistic, limit (d ≤ λ),Reference Sharvin20, Reference Nikolić and Allen21 where the conductance is proportional to the square of the contact diameter,
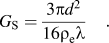
The transition between ballistic and diffusive contacts is described by the Wexler correction, which provides a smooth function connecting the Sharvin limit to the Maxwell limit.Reference Wexler22, Reference Tholen, Erts, Olin, Ryen and Olsson23 The Maxwell model is a mathematical approximation for a metallic contact, and while the case studied here is not completely Ohmic due to the insulating oxide layer, the relationship between contact area and conductance may be similar, as others have assumed. This will be returned to below.Reference Pethica and Tabor14, Reference Holm17, Reference Kogut and Komvopoulos24
It is also known that, as a metal undergoes plastic deformation, changes in dislocation density cause a local decrease in the electrical conductance at the contact. This can be seen from the total resistivity, ρ e, written as,Reference Matthiessen and Vogt25, Reference Zuercher, Mueller, Sachslehner, Groeger and Zehetbauer26

where ρ impurities, ρ phonons, ρ defects, and ρ dislocations are impurity, phonon, defects, and dislocation contributions to the resistivity, respectively. Here, we are employing Matthiessen’s rule to write the total resistivity as a sum of individual contributions. Important for extremely large strains, an additional term for “deviations from Matthiessen’s rule,” has been added. It is important to note that Matthiessen’s rule has been used successfully by experimentalists for the measurement of dislocation density and point defect concentrations in metals and superconductors.Reference Watts27, Reference Sipos, Barisic, Gaal, Forro, Karpinski and Rullier-Albenque28
The above discussion pertains to conductance at contacts between metals. In the case discussed in this article, we will be dealing with nanoscale native oxide overlayers with insulating transport properties, making tunneling conduction possible. Single-step elastic tunneling, inelastic tunneling, hopping transport via defect states in the oxide, and metallic transport through pinholes are all possibilities and must be considered. Regarding the specific metals we study, it should be noted that both chromium and aluminum metals rapidly oxidize in air, but the oxide growth is “self-limiting.” This results in an oxide layer about 1–2 nm in depth prior to becoming diffusion limited.Reference Salomonsen, Norman, Lonsjo and Finstad29, Reference Tamura, Kimura, Suzuki, Kido, Sato, Tanigaki, Kurumada, Saito and Kaito30 Note that native Al2O3 layers have been widely used as pinhole-free tunnel barriers,Reference Moodera, Gallagher, Robinson and Nowak31 whereas native Cr–O layers are not so widely used for tunnel barrier formation.Reference Chia, Wang and Lee32 In sharp contrast to both of these cases, single-crystal platinum does not form a native oxide at room temperature, making it an ideal choice for use as a reference material in this study.
II. EXPERIMENTAL CONSIDERATIONS AND STRUCTURAL CHARACTERIZATION
A laboratory grade (100) single-crystal platinum specimen with a surface roughness of 11 nm is used as a reference material. The platinum was mechanically polished using 20 nm colloidal silica and then subsequently cleaned by ultrasonication for 15 min in deionized water, isoproponol, and methanol.
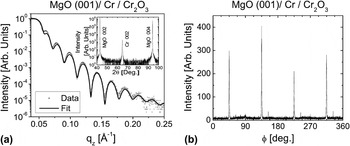
Chromium films, with thickness of 28 nm, were grown epitaxially in the (001) orientation on MgO (001) substrates by direct current (dc) magnetron sputtering in a chamber with a base pressure of 10−9 Torr. The films were deposited (0.9 Ås−1) at 200 °C in 3 mTorr Ar pressure after a 500 °C vacuum annealing of the MgO (001). The deposition, structure, and characterization were discussed in more detail in prior work.Reference Parker, Wang, Steiner, Crowell and Leighton33 The films were then characterized ex situ by high-resolution wide-angle x-ray diffraction [Fig. 1(a), inset], rocking curve analysis (not shown), grazing incidence x-ray reflectivity [Fig. 1(a)], and in-plane x-ray diffraction [Fig. 1(b)]. The wide-angle diffraction confirms an out-of-plane (001) orientation, while the in-plane “φ-scan” demonstrates in-plane, “45° rotated” epitaxy. The rocking curve full width half maximum of 1.0° confirms a reasonably low degree of mosaic spread. The measured x-ray reflectivity profile (GIXR) was compared to the results of standard simulationsReference Fitzsimmons, Majkrzak and Zhu34 (Fig. 2), resulting in extracted root mean square (rms) top surface roughness values (on the long lateral length scale probed in this technique) of 0.9 nm. Figure 2 shows the density depth profile, converted from the extracted depth profile of the x-ray scattering length density. The density of the interior of the Cr film from the fit was found to be 6.95 g/cm3, slightly less than that of bulk Cr (7.19 g/cm3). This density reduction of the film compared with the bulk is fully expected and should also occur for the oxide layer, perhaps even more so for this ultrathin layer. The CrxOy layer, formed by natural oxidation, had a determined thickness of 2.0 nm and was found to have a density of 4.87 g/cm3. CrO2 has a bulk density of 4.89 g/cm3. For the native oxide to be CrO2-dominated, we would thus require a disordered 2.0-nm film formed by natural oxidation to have a density 99.6% of the bulk theoretical maximum, which is clearly unreasonable. The measured density of 4.87 g/cm3 would however be perfectly reasonable if the native oxide was Cr2O3, which has bulk density of 5.22 g/cm3. We thus conclude that a Cr2O3-dominated layer is most likely based on the x-ray reflectivity data. This is consistent with (i) the conclusions of prior work on the native oxide of Cr,Reference Cheng, Borca, Xu, Yuan, Doudin, Liou and Dowben35, Reference Ikemoto, Kikujiro, Kinoshita, Kuroda, Alario Franco and Thomas36 (ii) the spectroscopy data provided below, and (iii) the fact that the overlayer is clearly found (see below) to be insulating (CrO2 is metallic). The rms roughness from 10 × 10 μm scanning probe microscopy scans was 0.5 nm, using the ISO 4287-1997 and ISO 4287/1-1997 roughness standards, in reasonable agreement with that from the GIXR fitting of 0.9 nm.
(a) Grazing incidence x-ray reflectivity (open circles) and fit (solid line) used for calculation of thickness and roughness for Cr/Cr2O3 system. Wide-angle x-ray diffraction (insert) confirms an out-of-plane (001) orientation. λ = Cu Kα. (b) In-plane x-ray “φ-scan” shows a 45° rotated epitaxy for growth of Cr on (001) MgO.

Density profile of the MgO/Cr/Cr2O3 film, generated from a fit of the grazing incidence x-ray data. The oxide film thickness from this measurement was 1.6 nm.

Polycrystalline Al films of thickness 30 nm were grown on Si(001)/SiO2 substrates, in the same chamber as the Cr films, at ambient temperature, 0.7 Ås−1 deposition rate, and 2.3 mTorr Ar pressure. Wide-angle x-ray diffraction revealed polycrystallinity with no strong texturing. A Williamson–Hall analysis of the peak widths showed little contribution from microstrain and an average grain size (probing the direction perpendicular to the substrate surface) of 18 nm. The films were found to have lattice parameter around 0.406 nm, i.e., they were essentially relaxed. From GIXR measurements and simulations, we determined a surface roughness of 3.2 nm.
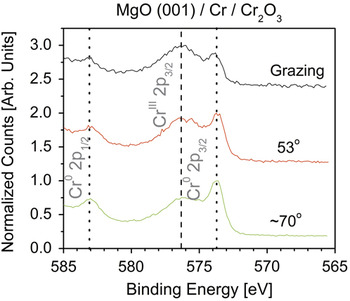
X-ray photoelectron spectroscopy (XPS) using a model SSX-100 by Surface Science Instruments, Inc (VG Scienta, Uppsala, Sweden) was carried out to further characterize the thickness and valence of the Cr in the native oxide from the chemically shifted 2p3/2 components. This instrument consists of a hemispherical sector energy analyzer and monochromated Al Kα x-ray source operated at a spot size of ∼800 μm. Survey spectra were obtained at a pass energy of 150 eV and high-resolution spectra were obtained at 50 eV. The energy scale was calibrated relative to the Au 4f7/2 (83.95 eV) peak and the Cu 2p3/2 (932.7 eV). This instrument is equipped with an angle-resolved sample stage that can be used to vary the electron take-off angle. The acceptance angle of the energy analysis system is ∼30°, limiting the usefulness of variable angle studies; i.e., the angular resolution at which data can be obtained limits the resolution of the depth profile. The samples were observed to be carbon contaminated. Studies of the Cr 2p3/2 peak were performed to determine the oxidation state of Cr at the surface. Clean metallic Cr has its 2p3/2 peak located at 574.4 eV and its oxide occurs at ∼576.4 eV.Reference Crist37 This “oxide” peak is actually a superposition of overlapping Cr3+ and Cr4+ signatures. In our case, the elemental peak was observed at ∼573.7 eV, the small shift (0.7 eV) being due to the background and curve fitting procedures, which introduce inaccuracies in determining the peak position.Reference Castle, Chapman-Kpodo, Proctor and Salvi38, Reference Aronniemi, Sainio and Lahtinen39 Deconvolution of the oxide peaks is hindered by the significant peak overlap but suggests a surface 3+:4+ ratio of 6:1. The data, within experimental limits, are thus consistent with a thin oxide of predominantly Cr2O3, consistent with x-ray reflectivity, literature precedent,Reference Cheng, Borca, Xu, Yuan, Doudin, Liou and Dowben35, Reference Ikemoto, Kikujiro, Kinoshita, Kuroda, Alario Franco and Thomas36 and the insulating nature of the overlayer.
Nondestructive depth profiling analysis was done by variation of the subtended angle in three angular positions at grazing, 53°, and ∼70°, as shown in Fig. 3, to provide a rough estimate of the oxide thickness. (see, for example, Ref. Reference Fadley40) The intensity, I, of electrons escaping from the sample follows the Beer–Lambert law,Reference Watts41
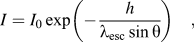
The change in the ratio of the 2p3/2 Cr0 and CrIII peaks can be used to give oxide film thickness. Grazing angles have the lowest penetration depth, and therefore the largest 2p3/2 CrIII peak. Inversely, higher angles of incidence probe deeper into the sample. The oxide film thickness was estimated to be 2.0 nm.

where θ is the photoemission angle subtended relative to the sample surface, I 0 is the infinitely thick and clean substrate intensity, h is the depth, and λ esc is the escape depth. If λ esc is then assumed to be constant in Cr metal (CrM) and Cr oxide (CrO), the ratio of the intensities I M/I O can then be used to estimate the thickness of the oxide film. Analysis of the angle-resolved XPS data, using Eq. (4), for the 2p3/2 chemically shifted Cr, shows that the native oxide layer is approximately 2.0-nm thick. An escape depth of 2.7 nm,Reference Seah and Dench42 and densities of the CrM and CrO of 6.95 and 4.87 g/cm3, respectively, were used in the analysis. A small amount, ∼2%, of hydroxyl bound Cr was also found at all take-off angles. In summary, the XPS and GIXR analyses are in reasonable agreement on the existence of an approximately 2-nm-thick native oxide overlayer, of mixed nature, but predominantly Cr2O3. The nature of the oxide is important in this work as CrO2 is a conductive metal, while Cr2O3 is an insulator.
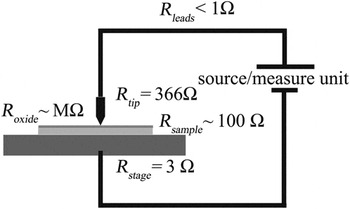
The ECR characterization technique combines nanoindenter hardware (Hysitron, Inc., Minneapolis, MN) with a conductive indenter probe of doped diamond and a dc voltage/current source to achieve a time-based correlation of force (P), displacement (δ), voltage, and current. Hysitron’s nanoECR transducer is composed of a three-plate capacitive transducer. The plates are oriented parallel to one another. The two outer plates are fixed while the center plate is comprised of a complex spring. The conductive probe is mechanically fastened to, but electrically isolated from, the center plate. This is an electrostatically actuated transducer, which provides low noise floors (<100 nN) and a high degree of sensitivity (force resolution, 1 nN). In addition to actuation, the transducer also serves as a capacitive displacement sensor (displacement noise floor, 0.2 nm). The two-terminal contact resistance is determined by applying a dc bias voltage (range, 10 mV–5 V) between the tip and sample and measuring the resultant current flow (1 mA max current, 15 pA noise floor). As a two-terminal method, the measured conductance, G, will be limited by the resistance of all elements in series, Fig. 4, including the resistance of the tip, the contact, the sample, and attached leads. The conductance, G, is calculated from the measured current, I, divided by the applied voltage, V, i.e., we display conductance as opposed to differential conductance. Load-controlled indents with maximum loads from 100 to 1000 μN were placed in 5 × 5 arrays with 10-μm spacing between indents. Displacement-controlled indents were also performed to provide more sensitivity regarding discontinuities for the Al films. An overpressure of N2 gas was used to reduce the relative humidity from approximately 40% to less than 15% at ambient temperature. Samples were connected to a freshly cleaned copper substrate stage by 99.99% purity Au wire using 99.99% purity In solder. Periodic cleaning in an ultrasonic bath to remove contaminants and maintain proper electrical contact was performed on the boron-doped Berkovich tip, of nominal 700-nm radius. The indentation depth and film thickness are within the spherical regime of the indenter.
A schematic of the two-terminal test setup. The resistance along the length of the tip is 366 Ω, the contact, with 11 kΩ of resistance taken at 300-nm displacement into Pt, dominates the measurement.

III. RESULTS
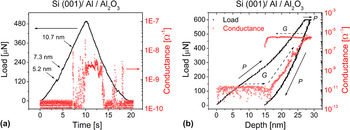
The load–depth profile on the Al/Al2O3 sample, Fig. 5, indicates Hertzian elastic behavior for the first 3 nm before the onset of elastic–plastic behavior.Reference Hertz43

(a) Load–time (solid squares) and the corresponding conductance (open circle) measurements for a typical displacement-controlled indent to 15 nm. Small load drops are seen at 5.2 and 7.3 nm prior to oxide fracture at 10.7 nm. (b) Load–depth (solid squares) and the corresponding conductance (open circle) measurements for a typical 600-μN indent under load–control into the Al/Al2O3 film. The conductance rise after initial onset is five orders of magnitude.

After the commencement of plasticity, the contact diameter can be expressed as a geometric contactReference Johnson44
where δ is the total depth of penetration. Here, a geometric contact is chosen as pile-up is likely to occur to some degree in a thin metal film. The deviation from Hertzian contact, seen as a load drop in a displacement-controlled indent, occurs at 5.2-nm displacement, Fig. 5(a). Displacement-controlled indentation is used here to provide additional sensitivity to discontinuities.Reference Warren, Downs and Wyrobek45 Loading continues in an elastic–plastic fashion, with minor load drops at ∼7.3 and 10.7 nm. A residual plastic depth of 4 nm remains after unloading.
The absolute value of conductance at the initial contact is G ≤ 10−11 Ω−1 until the load drop occurring at ∼10.7 nm. At this point, G rapidly rises two orders of magnitude reaching a maximum value of 2.3 × 10⁻⁸ Ω−1. A nominal value of 3 × 10⁻⁹ Ω−1 is maintained through the initial unloading period, with two sudden increases prior to the contact being broken. The maximum G is limited by both the system resistance, the area of the contact, and spreading resistances in the film. The initial low value of G is expected as the native oxide layer on Al is well known to form a good insulating tunneling barrier. This result is similar to that presented by Pethica and TaborReference Pethica and Tabor14 for Ni samples with native oxide, where oxide fracture is observed with a large increase in G, albeit with one significant difference. Although Pethica and Tabor observed Hertzian, elastic, contact prior to oxide fracture, the load–depth profile shown here on Al/Al2O3 indicates a deviation from Hertzian behavior at approximately 3-nm displacement. After that, plasticity ensues, but G does not rise giving evidence to the integrity of the oxide film. At 10.7-nm displacement, however, G rises rapidly. We believe that this onset of G is directly due to the fracture of the oxide, occurring simultaneously with a load drop. The thin oxide layer combined with a constrained thin film can account for this observation of elastic–plastic behavior prior to fracture. Combining Eqs. (1) and (5) give a conductance–displacement relationship of
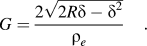
Here the average value of resistivity, 1.65 Ω cm, is the average resistivity of the indenter, 3.3 Ω cm, and that of the Al film, 4.71μ Ω cm. Assuming a theoretically perfect contact at a displacement of 15 nm, the value of the conductance would be 1.7 × 10⁻⁵ Ω−1, while the measured value is nominally three orders of magnitude lower. This theoretical value involves several assumptions. The first is that, at small displacements, the contact area and the projected area of contact are equivalent. The second and less likely assumption is that the entirety of the tip-sample contact can be described as being metal–metal. For a fractured oxide film, the actual contact area would be much smaller. A load-controlled indent, with a maximum displacement of 30 nm, Fig. 5(b), shows that the G continues to rise exponentially, to a maximum value of 2.5 × 10⁻⁶ Ω−1. I–V sweeps taken at 30-nm displacement show that the contact is still not Ohmic, which means that although the oxide is fractured, the contact is not an ideal metal to metal contact, or is extremely small. If, for example, this was a ring fracture of 0.1 nm in width and 750 nm in circumference, giving a contact area of 75 nm2, and using Eq. (1) to determine the conductance, results in a value of G = 9.8 × 10⁻⁹ Ω−1, quite close to the measured value at initial turn-on.
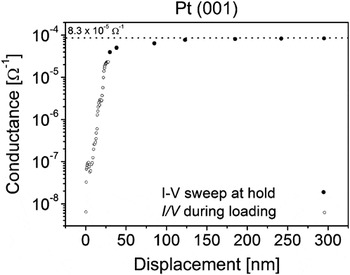
The conductance results in the Al film system can then be compared to those of the Pt system. Here, the conductance versus depth, Fig. 6, calculated from the continuously measured current during loading at low depths, and then by linear fitting of I–V sweeps from ±300 mV at larger depths in the single-crystal Pt sample shows a large rise in conductance from initial loading, with the rise slowing at larger displacements. The value of G for the Pt system, as determined by Eq. (6) at 20-nm displacement, is 2.0 × 10⁻⁵ Ω−1, whereas the measured value is 3.6 × 10⁻⁶ Ω−1. In this case, the discrepancy is likely due to surface roughness effects, as found by several other researchers.Reference Fang, Muhlstein, Collins, Romasco and Friedman12, Reference Holm17, Reference Kogut and Komvopoulos19, Reference Kogut and Komvopoulos24
Conductance–depth on the platinum reference sample. G is measured continuously during loading at low depths (open circles) by measuring the current at a continuous applied voltage of 300 mV, and then by linear fit to ±300 mV I–V sweeps during hold periods at larger depths (closed circles).

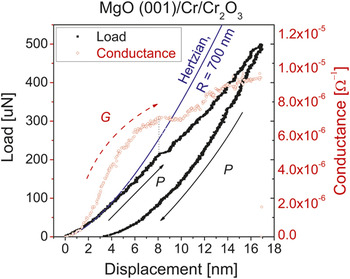
Let us now turn to the Cr system. Similar to Al/Al2O3, the load–depth profile in the Cr/Cr2O3 is Hertzian for the first few nanometers at which point a deviation of P proportional to  is observed, Fig. 7. A large displacement excursion is seen at ∼8 nm, of approximately 0.75 nm in length. After the excursion is arrested, the sample reloads in an elastic–plastic fashion.
Load–depth (solid squares) and the corresponding conductance (open circle) measurements for a typical 500-μN indent into the Cr/Cr2O3 film. A deviation from Hertzian behavior can be seen prior to the large excursion at ∼8 nm. A corresponding decrease in the conductance is observed coincident with the excursion. The conductance continues to decrease upon the reloading of the sample surface, indicating that dislocation plasticity continues decreasing the conductivity of the sample at this point.

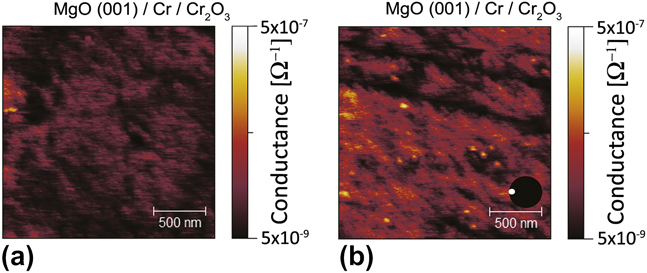
In contrast to Al/Al2O3, the initial measured G is immediately greater than 10−8 Ω−1 in the Cr/Cr2O3 system, even prior to the onset of plasticity. This native oxide system is known to be more difficult to establish tunneling conduction due to the formation of pinholes. Growth conditions control the pinhole density, but Cr films grown under similar conditions were been found to contain ∼4 × 10⁵/mm2 pinhole density or a linear density of 1.5 × 10³ nm as determined by HCl decoration.Reference Chia, Wang and Lee32 Conductive scanning at 2 μN [Fig. 8(a)] showed almost no apparent evidence of current hotspots; however, as the scanning load was increased to 10 μN [Fig. 8(b)], current hotspots were observed. The position of these hotspots did not obviously correspond to surface features although they may be formed by the result of shearing action. The density of hotspots, 1.2 × 10⁷/mm2, as determined from the 10-μN scan, was found by using a conductance criteria of 9 × 10⁻⁸ Ω−1. The larger regions are counted as a single hotspot if there is less than a two pixel separation between individual pixels. The larger half-dozen hotspots would be smaller than the image suggests.Reference Villarrubia46
A conductive scan of the Cr/Cr2O3 film using the indenter tip at 2 μN force (a) shows negligible conductance during scanning. However, when the force is increased to 10 μN (b) hotspots in the conductivity appear. The conductance magnitude of these hotspots is similar to that seen in the first few nanometers of displacement during indentation. The two concentric circles near the scale bar are aids to the eye, indicating the area of the tip in relation to the figure for scanning (inset white circle) and at 17-nm depth (larger black circle). A depth of 17 nm is chosen to match the maximum depth of the indent in Fig. 7.
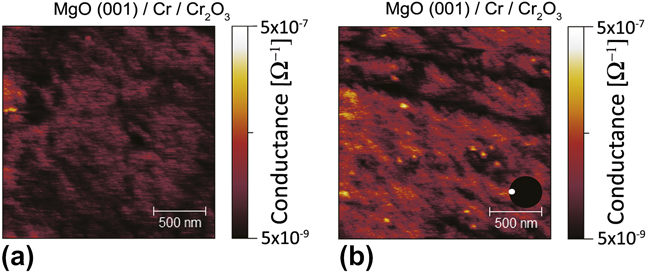
Because of the nature of the shear force in the creation of hotspots, the actual density underneath the indenter in perpendicular loading is unknown. The conductance criteria of 9 × 10⁻⁸ Ω−1 is quite small compared to the overall value of G seen in the indents. Moreover, conductance scan post indentation at 2 μN show no hotspots, even at the site of the indent. This is likely due to reformed oxide in the damaged region, in the several minutes that a scan requires.
After initial Hertzian loading, the curve transitions to an elastic–plastic behavior. Focusing on the pop-in at δ ≈ 8 nm demonstrates a clear correlation between a simultaneous decrease in G and the lateral displacement burst in P. At the arrest of the displacement excursion, G continues to decrease. At this point, δ ≈ 8.8 nm, the indenter begins to reload the sample, increasing the contact area. After approximately 1.1 nm of additional indenter displacement, δ ≈ 9.9 nm, G begins to increase again, but at a reduced rate. The exact state of tip-sample contact is not known during the large pop-in, from δ = 8 to δ = 8.8 nm, as the sample surface deforms. In the past, this excursion likely would have been interpreted as oxide fracture. If this were oxide fracture, an increase in G would be expected, as seen in Figs. 5(a) and 5(b), for the Al/Al2O3 film as the tip begins to reload the surface. As the tip-surface contact is loaded, the contact area is increasing, [Eq. (5)], and with increasing contact diameter, G should also be increasing, [Eq. (1)]. The continued decrease in G thus requires that some other mechanism be counteracting this increase in contact area. We believe that the mechanism is the multiplication of dislocation loops under the indenter, acting to decrease the conductivity of the sample, as in Eq. (3).
The differences in G–δ between Cr films and Al films are evident on initial loading. Where the Al/Al2O3 system shows low G and then a dramatic turn-on coincident with a small displacement excursion, the Cr/Cr2O3 system shows a much higher initial G, which temporarily decreases, coincident with a displacement excursion. A rise in G of orders of magnitude after significant displacement can only indicate that the nature of the contact has changed. In the case of the Al film, the contact has changed from a tunneling contact to that of a contact more indicative of metal–metal, but where the fractional contact area is smaller than that of Pt at the same contact depth. However, the slope of log (G) versus displacement in this case is 0.44, in which the contact area is increasing according to the Maxwell model. Any decrease in G must be accounted for by other mechanisms. It can be seen that the initial post fracture behavior, between time 7.5 and 10 s in Fig. 5(a), in the Al film is quite noisy. This is likely due to the intermittent small area contact, whereas in the Cr film (Fig. 7) the contact can only be increasing in size after the pop-in at 8.8 nm, while G decreases. The only variable that would decrease G in the case of increasing contact area is a decrease in conductivity. We propose that the dramatic turn-on in G in Al/Al2O3 is evidence of oxide fracture, following the conclusion of Pethica and Tabor.Reference Pethica and Tabor14 We propose that the downturn in G occurring simultaneously with a large displacement excursion in the Cr/Cr2O3 system is caused by a high local dislocation density near the contact, enhanced during the excursion, and thus decreasing the conductivity of the sample.
Elastic simulations, using the FilmDoctor program,Reference Schwarzer47 have been performed for both film systems at the points of yield. In the case of the Cr film, the load is 215 μN, giving a maximum von Mises stress of 11.0 GPa at a depth of 38.7 nm, almost 20 nm below the Cr/MgO interface. A value of 10.5 GPa is calculated at the Cr/MgO interface. Literature values for hardness in thin films of Cr are in the 6–10 GPa range,Reference Provenzano, Valiev, Rickerby and Valdre48, Reference Firstov, Rogul, Dub, Lee, Novikov and Turkevich49 quite close to the bulk hardness of MgO at 9.2 GPa. The modulus of Cr, 248 GPa, is less than the indentation modulus of MgO, 295 GPa. In both the film and the substrate, if a Tabor relationship is used, the simulated von Mises stress exceeds the yield stress of the material, more than satisfying the von Mises yield criterion. However, the elasticity simulation assumes that there are no frictional or surface roughness effects. As Bobji et al.,Reference Bobji, Biswas and Pethica50 Gerberich et al.,Reference Gerberich, Tymiak, Grunlan, Horstemeyer and Baskes51 and Greenwood and TrippReference Greenwood and Tripp18 have all shown, there is considerable stress concentration near the asperities, increasing the likelihood of plasticity in the asperities. The lack of frictional effects in the simulation reduces the tensile stress at the edges of the contact, reducing the shear stress near the surface. However, because of the extremely high electrical resistance in the MgO, the current is flowing only through the metal film. If the substrate were to yield prior to the film, the only electrical change would be an increase in contact area, causing an increase in G. Since the opposite is seen, it is likely that the metal has yielded.
For the Al system, yield stress in free standing thin films tested in tension have been reported as high as 4 GPa,Reference Habbab, Mellor and Syngellakis52 while indented films ranging from 300 to 500 nm have reported hardness values ranging from 3 to 6 GPa.Reference Saha and Nix53–Reference Tsui, Ross and Pharr56 Here, the hardness of the substrate, 8.8 GPa is higher than the film value. The von Mises stress, calculated at 330 μN shows a maximum of 5.76 GPa, located at the metal film/substrate interface. However, at the edges of the indenter/alumina interface, a value of 5.33 GPa is found. As a ceramic under tensile strains that are not accounted for in the simulation, the alumina is likely to fracture prior to yield.
IV. SUMMARY
Here, the ECR instrumentation gives insight into the largely elastic deformation of a thin native oxide on thin Cr and Al metal films. This method utilizes in situ electrical measurements to determine mechanical changes of metal thin films during nanoindentation. The relatively large current measured at initial loading in the Cr films may indicate an alternate means of electron conduction other than tunneling. This could include pinhole effects and the presence of metallic CrO2. The initial thickness was measured by fit to GIXR and has been verified by angular resolved XPS. Using this thickness, a simulation of the elastic compression in multilayers has been performed, which shows that the von Mises yield criteria is exceeded in the Cr metal. Additionally, a transient decrease in conductance is likely due to an increase in dislocation density. This is in contrast to the fracture of the alumina film, showing a dramatic rise in G as the oxide fractures. These disparate findings on the responses of natural oxide films under contact are being used to investigate oxide film integrity and subsurface plasticity. Further study into the role that pinholes play in affecting mechanical behavior such as dislocation nucleation, fracture, friction, rate effects, and wear are suggested.
ACKNOWLEDGMENTS
DDS thanks N. Schwarzer at the Saxonian Institute of Surface Mechanics for making the FilmDoctor program available. The authors also thank Palak Ambwani for additional characterization of the Al thin films. Parts of this work were carried out in the Institute of Technology Characterization Facility, University of Minnesota, a member of the NSF-funded Materials Research Facilities Network. We also acknowledge the UMN NSF MRSEC center for use of experimental facilities. DDS acknowledges Hysitron, Inc., the Abu Dhabi–Minnesota Institute for Research Excellence a partnership with the Petroleum Institute, NSF/DMR-0946337, and the Air Force Office of Scientific Research AOARD-08-4134 for funding.