Organized interests play a significant role in the systems of representation in modern democracies. Indeed, democracy on a national scale almost surely requires a robust community of free organizations mediating between citizens and the state. However, studies of interest groups in the United States demonstrate consistently that they perform this representative function in ways that leave many, especially those who lack political resources, with diminished political voice: barriers to entry imply that not all of those with a stake in policy outcomes are represented by groups, interest groups do not represent all their members equally, and rank-and-file group members may not be able to hold accountable the leaders who presume to act on their behalf.
These concerns about political representation by organizations emerge from studies of traditional interest groups, that is, voluntary associations of individuals. Interest group scholarship overlooks the fact that, as we demonstrate, an increasing majority of organizations active in Washington politics have no members in the ordinary sense in which the Service Employees International Union and the National Rifle Association have individual members. We focus on such memberless organizations—for example, universities, hospitals and, especially, corporations—not because they behave differently from associations with individual members when they get involved in politics. On the contrary, membership associations and memberless organizations mobilize the same kinds of techniques in the pursuit of policy influence. For example, although they focus on different policy issues and different institutional targets within Congress and the executive branch, two perennially heavy-hitting organizations, the American Medical Association, a membership association composed of physicians, and Lockheed Martin Corporation, the nation’s largest defense contractor, use a similar mix of traditional lobbying supplemented by targeted election donations. In 2014, the AMA spent $19.65 million on lobbying and was responsible for $2.08 million in campaign contributions. The analogous figures for Lockheed were $14.6 million and $4.13 million.Footnote 1
Our reason for focusing on memberless organizations in pressure politics is, instead, that each of the representational inequalities characteristic of membership associations of individuals is exacerbated when politically active organizations are organizations without members. Compared to membership associations of individuals, organizations without members tend to represent the interests of the advantaged, especially business. Even when organizations without members purport to represent less powerful interests in politics, problems of agency and inequality arise. Organizations without members frequently fail to represent stakeholders equally. When that happens, dissatisfied stakeholders may have difficulty calling organization executives to account. These considerations regarding the representational consequences of the growing dominance in pressure politics of organizations without members gain greater resonance when viewed in the context of other trends in contemporary American politics that facilitate the exercise of political voice by those with significant market resources.
In the following pages, we explore the presence of organizations without members in politics by drawing on an extensive data archive containing information about the organizations listed in the Washington Representatives directory as having a presence in national politics—either by maintaining an office in the capital or by hiring Washington-based consultants or counsel to manage their government relations activities. We show that organizations without members are the predominant organizational form with respect to both numbers and spending and that they raise in an even more profound way questions of inequality and accountability in political representation.
Dilemmas of Democratic Representation by Organized Interests
If “to represent is to stand for in a relation of mutual interest,”Footnote 2 then organizations of all types, including those with no members, clearly play a representational role in democracies. That representational role is underlined by the fact that, in today’s parlance, the government affairs specialists hired as political advocates by organizations are called “Washington representatives.” But is representation by organizations without members the same as representation by membership groups?
Building on pioneering work by Pitkin,Footnote 3 political theorists have engaged recently in fruitful dialogue about representation.Footnote 4 The focus has been, quite reasonably, on representation by officials chosen in elections in geographical constituencies. Recognizing that residency-based representation within national boundaries cannot easily accommodate such developments as international migration and multinational corporations, however, others have sought to extend their insights to non-electoral contexts in which individuals or organizations act as a political voice for others.Footnote 5 Their work tends to emphasize “self-appointed representation” by those who seek to give voice to those who might otherwise be silent and not to pay much attention to the claims of representation by organizations as a regular part of democratic policy processes. Even so, their emphasis on authorization and accountability—that is, on the power of the represented both to select the representative and to sanction or remove the representative—illuminates the requirements for achieving democratic control when organizations represent citizen concerns in politics.Footnote 6
Election of representatives under circumstances of one person, one vote in geographical constituencies provides, at least theoretically, for equality among citizens. In contrast, studies of representation by interest groups raise several concerns about democratic inequalities: the extent to which representation of interests by groups is unequal, the extent to which groups fail to represent their members equally, and the extent to which group members are unable to control their leaders.
The first issue is that barriers to entry to the organized interest system imply that organizations do not emerge automatically to advocate on behalf of groups of people who might be expected to have shared political interests. As the result of the free-rider problem, large, diffuse groups lacking the capacity to coerce cooperation or to provide selective benefits often face severe collective action problems that prevent them from organizing on behalf of their joint political concerns.Footnote 7 Further, the resources required for organization and advocacy imply that the shared concerns of those who lack political and economic resources are also less likely to be represented by political organizations.Footnote 8 The bottom line for democratic representation is that an unrepresentative set of organizational advocates make it into pressure politics, resulting in unequal political voice through organized interests.
Moreover, what happens inside an interest group reinforces these tendencies. The activists within voluntary associations are drawn very disproportionately from their well-educated and affluent adherents.Footnote 9 Even in organizations that represent disadvantaged groups, the political agenda will reflect the priorities of the relatively advantaged parts of the constituency—for example, those who are affluent and well educated, male, white, or straight—at the expense of the needs and preferences of those who are disadvantaged along more than one dimension.Footnote 10
A final concern about democratic representation via interest groups is the potential slippage between the interests and preferences of those who lead advocacy organizations and the constituencies they presume to represent, an issue raised a century ago by Robert Michels in the context of European socialist parties.Footnote 11 A corollary concern is that many citizen groups are staff-driven organizations in which “members” do little more than pay dues and receive a newsletter in return,Footnote 12 a trend that has accelerated in recent decades.Footnote 13 In such organizations, members have limited ability to control their leadership and hold them accountable for their decisions, thus limiting the extent to which groups represent their members’ interests.
These concerns about the incomplete and unequal representation of citizen interests through organizations emerge from studies of membership associations of individuals. However, in a sometimes-overlooked 1984 paper, Robert Salisbury noted that the predominant organizational advocate in Washington is an organization without members in any traditional sense.Footnote 14 We shall show that organizations without members are numerically dominant and that they raise in an even more profound way questions of inequality and accountability in political representation.
Finding Memberless Organizations: The Washington Representatives Study
In order to investigate these matters, we draw on an extensive data archive containing information about the organizations listed in the Washington Representatives directory as having a presence in national politics—either by maintaining an office in the capital or by hiring Washington-based consultants or counsel to manage their government relations activities.Footnote 15 The Washington Representatives Study contains data for 1981, 1991, 2001, 2006, and 2011 and includes profiles of more than 33,000 organizations that are or have been active in national politics.
For each of these organizations, we coded what we call “organizational membership status”: that is whether it is an association composed of individual members, an organization without members, an association of organizations without members, a mixture of types,Footnote 16 or something else.Footnote 17
The Dominance of Memberless Groups in Organized Interest Politics
A generation ago, Robert Salisbury pointed out that the predominant organizational advocate in Washington is not an “interest group” or a “pressure group” or any kind of group at all.Footnote 18 Rather, it is an organization without members in any traditional sense—for example, a corporation, university, or hospital. In addition, organizations composed of such memberless groups, most notably the trade associations that bring together companies in a single industry, are more numerous than organizations composed of individual members.
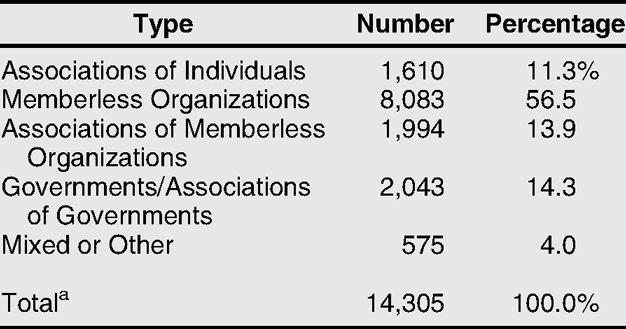
Despite the attention given to organizations of individuals in studies of interest group politics, these groups are a small minority of those active in Washington. As shown in table 1, just 11.3 percent of the more than 14,000 organizations active in 2011 were membership associations of individuals—less than memberless organizations (56.5 percent), associations of memberless organizations (13.9 percent), or sub-national governments or consortia of governments (14.3 percent).
Organizational membership status, 2011

a We omit from this and all successive tables the small number of organizations (N=62) whose membership status could not be ascertained.
Source: Washington Representatives Study.
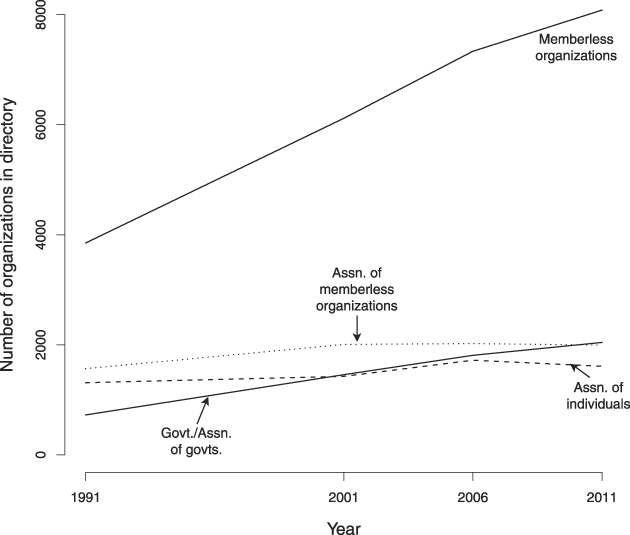
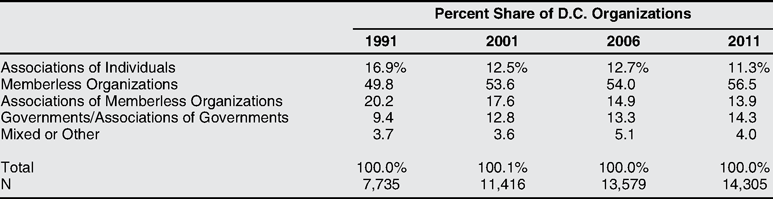
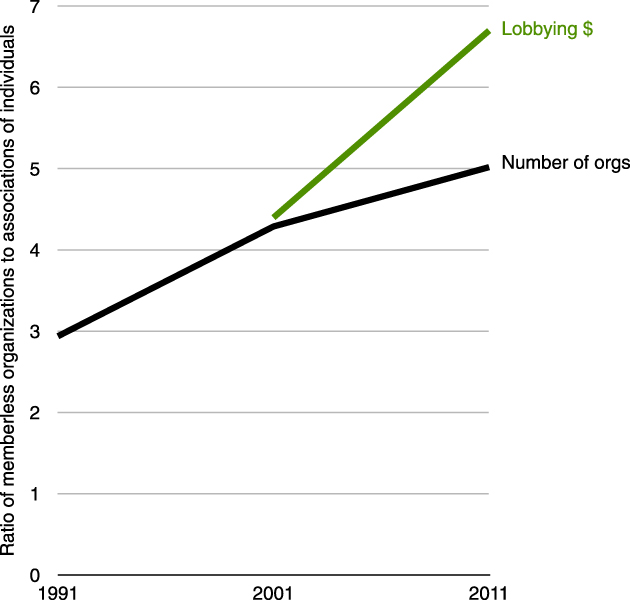
Not only are there more memberless organizations than membership associations in the Washington pressure community, their share has grown over the past two decades. Figure 1 shows that, since 1991, the rate of growth for memberless organizations has been faster than for other kinds of organized interests.Footnote 19 The rate of increase for membership associations has been much slower with membership associations of individuals slowest of all. In fact, the absolute number of membership associations, whether composed of individuals or memberless organizations actually diminished somewhat between 2006 and 2011. Table 2 presents the distribution of organizations in the pressure community and demonstrates that, between 1991 and 2011, the share of organizations without members grew from 50 percent to 57 percent, and the share of membership associations of individuals fell from 17 percent to 11 percent. Put another way, in 1991 there were 2.94 memberless organizations for every membership association of individuals in pressure politics. Twenty years later that ratio had grown to 5.00.Footnote 20
The growing organized interest community: Number of organizations by membership status, 1991–2011
Source: Washington Representatives Study.

The changing distribution of organizational membership status, 1991–2011

Source: Washington Representatives Study.
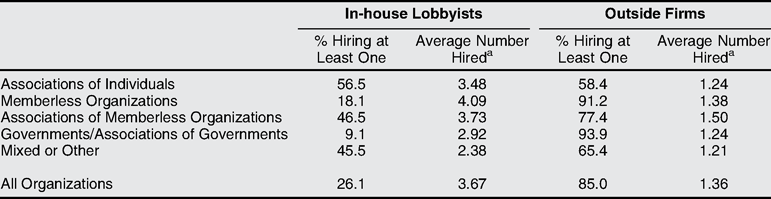
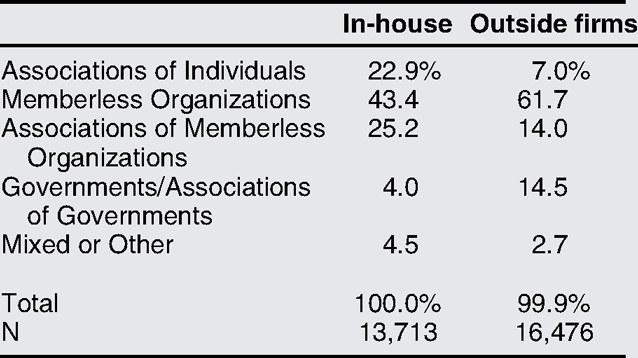
The memberless organizations that are so numerous command significant political resources. With regard to manpower, all of the organizations listed in the Washington Representatives directory hire professionals to represent their interests in national politics. They may open an office in Washington and rely on in-house staff or they may hire outside law, public relations, or consulting firms to handle their government affairs matters or both. Membership associations like the American Peanut Council, the American Nurses Association, or the Association of Home Appliance Manufacturers have more flexibility in locating their headquarters than Boeing, the Metropolitan Museum of Art, or the State of Nevada. Therefore, it is not surprising that, as shown in table 3, memberless organizations and also governments are less likely to have an office in Washington with government affairs professionals on staff than are associations with either individuals or institutions as members. In contrast, nearly all the organizations without members hire outside firms to handle their Washington representation. It is worth noting that the minority of memberless organizations that do have lobbyists on staff hire, on average, more of them than do their counterparts among associations. The result, shown in table 4, is that organizations without members account for 43 percent of the in-house lobbyists and 62 percent of the outside firms hired by organizations in Washington to handle their government affairs needs.
Political capacity of organized interests, 2011

a Among those organizations hiring at least one.
Source: Washington Representatives Study.
Distribution of lobbyists hired (percent), 2011

Source: Washington Representatives Study.
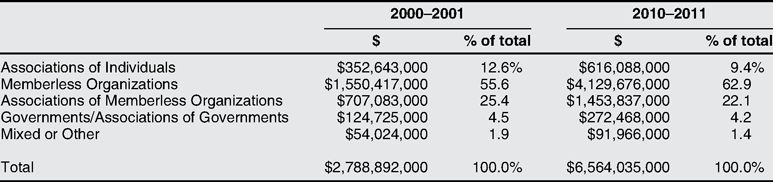
The Lobbying Disclosure Act of 1995 requires those who spend above a specified threshold to register their lobbying spending, an arena in which organizations without members seem to have a distinct advantage.Footnote 21 When it comes to the amount of lobbying spending, organizations without members leave membership associations of individuals in the dust. As shown in table 5, organizations without members accounted for fully 56 percent of lobbying spending in 2000–2001 and associations of individuals a mere 13 percent. In nominal dollars total lobbying spending more than doubled over the next decade, and the dominance of memberless organizations increased. By 2010–2011, memberless organizations were responsible for fully 63 percent of the lobbying spending and the share attributable to voluntary associations of individuals—mostly unions, occupational associations, and citizen groups—had shrunk to 9 percent. Put another way, as shown in figure 2, the ratio of lobbying spending by groups without members to lobbying spending by groups with individuals as members rose from 4.4-to-1 to 6.7-to-1 between 2001 and 2011, an even sharper slope than for the increase in the number of memberless groups.
Lobbying expenditures and distribution of lobbying expenditures, 2000–2001 and 2010–2011a

a Figures have not been adjusted for inflation.
Source: Washington Representatives Study.
Ratio of memberless organizations to associations of individuals: Numbers of organizations and lobbying spending, 1991–2011
Source: Washington Representatives Study.

Memberless Organizations and Democratic Representation
Earlier we argued that, although organizations serve as critical links between citizens and policymakers, the membership associations of individuals that have absorbed the attention of scholars perform the function of democratic representation only very imperfectly: many with a presumable stake in policy outcomes, in particular the resource-poor, lack organized political voice; members of interest groups are not necessarily represented on an equal basis; and they are not necessarily able to hold accountable the leaders who presume to act for them. Not only are the often-neglected memberless organizations dominant in pressure politics in terms of both their numbers and their spending, but each of these democratic deficits is more pronounced when the organizational representative has no members.
Memberless Organizations: Giving Voice to the Affluent
Organized interest politics is well known as a domain that overrepresents the economically privileged, a tendency that is exaggerated when it comes to organizations without members. Taken together, the organizations in the pressure community skew strongly in the direction of interests with substantial resources, especially business, at the expense of advocacy for broad public interests and those with limited resources.Footnote 22 Consider, for example, Pfizer, an international pharmaceutical company that produces well-known drugs such as Lipitor and Viagra. Year in and year out, Pfizer, which spent $8.47 million on lobbying in 2014, is one of the heaviest hitters in Washington. And Pfizer is not alone. Taken together, pharmaceutical companies spent $116.3 million on lobbying in 2014, a figure that does not include the millions more spent by trade associations with pharmaceutical companies as members.Footnote 23 Thanks, at least in part, to legislation that prohibits the federal government from negotiating prices with drug companies that provide prescription drugs covered by Medicare, Americans pay the highest prices for drugs in the world.Footnote 24 Although the “World Health Organisation (WHO) has talked of the ‘inherent conflict’ between the legitimate business goals of the drug companies and the medical and social needs of the wider public,”Footnote 25 the public’s medical and social needs receive scant representation in pressure politics. Most likely, the unfortunate cancer patient who faces thousands of dollars of bills for a drug not covered by insurance is not heard from at all.
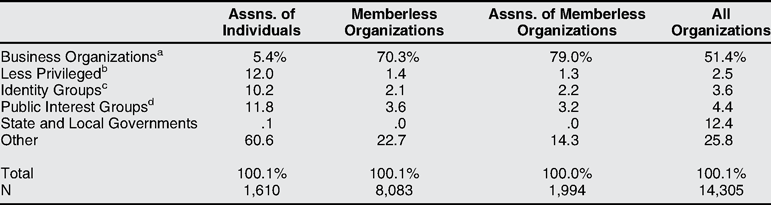
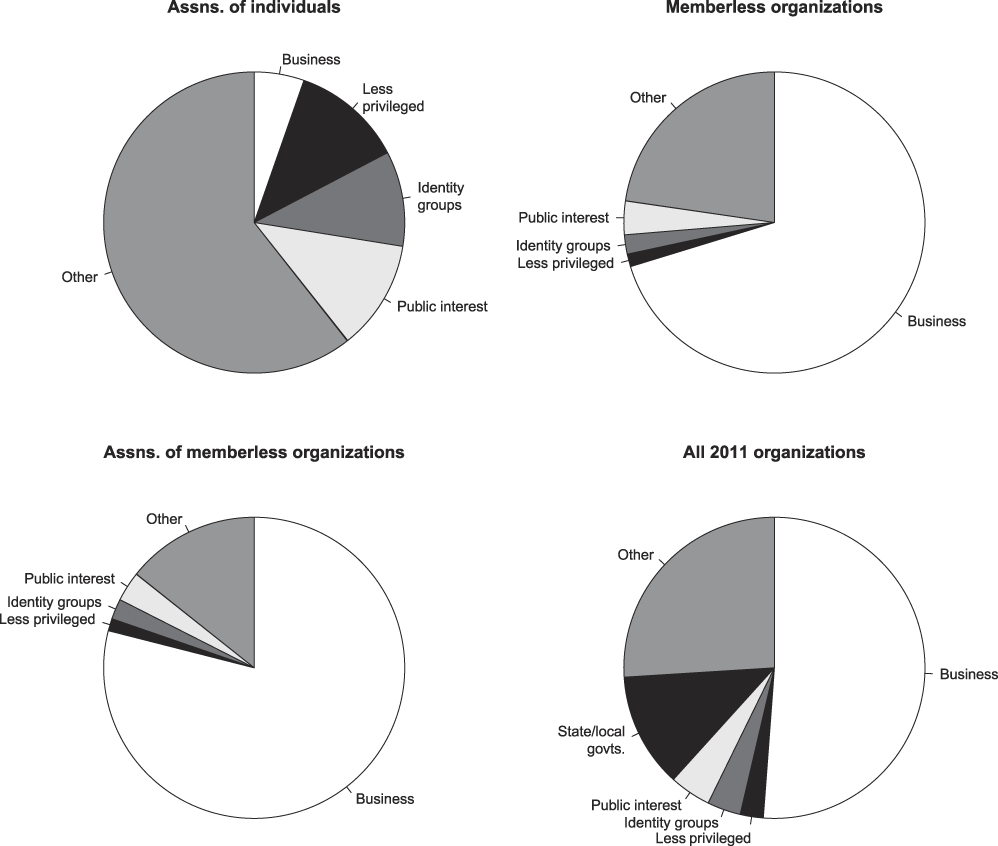
Systematic data demonstrate how little representation the interests of broad publics and the less affluent receive from organizations without members. In table 6 we show with numbers and in figure 3 we show graphically the distribution of organizations of various membership types into a set of highly aggregated categories that capture the kind of interest they represent: organizations representing business,Footnote 26 the economically less privileged,Footnote 27 identity groups,Footnote 28 and broad public interests.Footnote 29 Virtually all the organizations that represent the less privileged, identity groups, or broad public interests are voluntary associations with individuals as members.Footnote 30 In contrast, both memberless organizations and associations of those organizations tilt overwhelmingly in the direction of representing business: 70 percent of the memberless organizations, most of which are corporations, and 79 percent of associations composed of organizations without members, the vast majority of which are trade and business associations, represent the interests of business. In sum, while the pressure community as a whole tilts strongly in the direction of narrow interests and the affluent, memberless organizations and associations of them exacerbate that tendency substantially.
Interests represented by organizations with different membership groups’ status (percent), 2011

a Includes U.S. and foreign corporations, U.S. subsidiaries of foreign corporations, for-profit firms of professionals such as law and consulting firms, U.S. and foreign trade and other business associations, and business-affiliated research organizations.
b Includes social service providers, organizations advocating on behalf of the poor, blue-collar unions, white-collar unions, and occupational associations that organize those in non-professional, non-managerial occupations.
c Includes organizations representing racial, ethnic, religious, or LGBT groups, elderly, or women.
d Includes organizations that advocate on behalf of a public good whether of the left (for example, human rights or prisoners’ rights), of the right (for example, gun rights or the end of abortion), or with no obvious ideological coloration (for example, religious freedom or fire safety).
Source: Washington Representatives Study.
Interests represented by organizations, 2011
Source: Washington Representatives Study.

Memberless Organizations: Representing Stakeholders Unequally
A second problem of democratic representation, that leaders of organizations are more likely to represent some group members than others, becomes much more complicated when the organizations in question have no members. Although they have no individual members, memberless organizations do have multiple sets of stakeholders—who can be defined as “any group or individual who is affected by or can affect the achievement of an organization’s objectives.”Footnote 31 The interests and preferences of various stakeholders—for example, the patients, physicians, nurses, other medical staff, non-medical staff, administrators, board, third-party payers, suppliers, or neighbors of a hospital—are sometimes coincident and sometimes in conflict. Although government policies have an impact on stakeholders’ lives and fortunes, it is not easy to ascertain who is being represented when memberless organizations seek political influence. This set of affairs can also be conceptualized as an agency problem in which a conflict of interest results from the differing preferences of the agent and the principal.Footnote 32 Concrete evidence of such conflicts is the fact that during the 2014 proxy season, the most common topic among proposals submitted by corporate shareholders, easily outpacing other corporate governance issues, was corporate political activity—both political contributions and lobbying.Footnote 33 Such potential agency problems arise for all memberless organizations in politics.
For example, who among multiple stakeholders—students, faculty, staff, administration, donors, alumni, and neighbors—is being represented when a university is active in politics? Consider for-profit colleges and universities, which account for 13 percent of college students, roughly one-quarter of federal spending on Pell Grants, and 47 percent of the student loan defaults.Footnote 34 According to a report from the U.S. Government Accountability Office, they frequently direct federal funding intended to benefit lower-income students towards marketing or administrative costs rather than financial aid.Footnote 35 When for-profit colleges and universities like DeVry and the Apollo Education Group (parent company of the University of Phoenix) lobbied vigorously in opposition to the proposed “gainful employment rule,” which targeted programs that leave students with high debt and limited earnings prospects, it is not clear that they were representing the best interests of their students.
With the sole exception of corporate political activity, the puzzle of which stakeholders are represented when memberless organizations get involved in politics has been largely neglected. Academic studies of corporate behavior in politics highlight the potential divergence between the interests of corporate shareholders on the one hand, and executives and directors on the other.Footnote 36 However, they reach no definite conclusions as to whether boards and executives are able to act autonomously in politics and find no clear patterns for the circumstances under which either management or shareholders will benefit from political activity.Footnote 37 Still, the concerns and preferences of other potential stakeholders—suppliers, customers, the communities in which firms are located and, especially, employees—are strikingly absent from the discussions.Footnote 38
Memberless Organizations: The Barriers to Accountability
A final concern about democratic representation through memberless organizations is that, compared to individual members of a voluntary association, stakeholders of a memberless organization have diminished prospects for democratic control. With regard to authorization, the executives or boards who run memberless organizations—whether a foundation, museum, university, or corporation—are more likely to be in a position to exercise autonomy in choosing whether and how to get involved in politics without having to consult with broader sets of stakeholders.Footnote 39
With respect to accountability, the extent to which membership associations have formal or informal mechanisms for enforcing accountability varies. However, many of those who seek to lead, or to continue to lead, membership associations confront the prospect of having to face the rank-and-file in periodic elections. Those who run organizations without members may, indeed, be held accountable by a board and, in the case of corporate CEOs, may on rare occasions be called to account by a shareholder revolt. Nevertheless, the stakeholders who are invested in such organizations have, on average, much less leverage and fewer democratic rights in holding their leaders accountable than do members of associations. After all, “the Bill of Rights … runs out at the company gate.”Footnote 40
An additional possibility for accountability in organizations is through exit. Because those who lead membership organizations are compelled to attract and retain members, they offer their members varying bundles of purposive, solidary, and material benefits.Footnote 41 Association members who are induced to join or stay by the psychological satisfaction of supporting a cherished cause or by the fun and recognition that accrue to interacting with others are unlikely to be deterred from leaving if those rewards are not forthcoming. Disincentives to exit are much more common in memberless organizations. Because the costs of quitting are ordinarily quite high for employees—whether middle managers in a company, doctors and nurses in a hospital, or guards at a museum—it is harder to hold leaders accountable by using exit as a means of registering dissatisfaction.Footnote 42
Chick-Fil-A’s political activity on social issues illustrates these points well. In 2012, the president of the privately owned chain, Dan Cathy, made several statements against same-sex marriage, including that it would invite “God's judgment on our nation.”Footnote 43 The company foundation has given money to groups that support bans on same-sex marriage.Footnote 44 However, local franchise owners who did not necessarily agree with the political stances of corporate leaders felt the impact of the resulting boycott organized by LGBT groups. As the manager of a Chick-Fil-A franchise in Nashua, New Hampshire, put it, “Chick-fil-A at Pheasant Lane Mall has gay employees and serves gay customers with honor, dignity and respect. … We also don’t discriminate in giving back to the Nashua community, donating to a wide variety of causes. I would challenge people to come have a conversation with me before they make assumptions or boycott my restaurant.”Footnote 45 In short, franchisees did not ask the parent company to get involved on a politically divisive issue, they have no means of influencing the political decisions made by corporate headquarters, and, compared to the members of most voluntary associations, they would face far greater costs if they were to use exit as a form of accountability.
Conclusion
Our discussion of what happens to democratic representation when organizations without members are active in politics engages a subject that has been overlooked both by the interest group scholars who focus on voluntary associations of individuals and by the political theorists who focus on representation in geographical constituencies and, within the domain of non-electoral representation, on self-appointed representatives. Because they figure so importantly in pressure politics in America, and because they raise in such profound ways issues of democratic representation, we urge political theorists to assist us by broadening their discussions of representation in democracies to encompass the role of organized interests of all kinds, including those that have no members. Similarly we urge those undertaking empirical investigations not to omit such memberless organizations from their purview. We have shown that the pressure system is dominated by organizations that have no members—universities, hospitals, museums, think tanks, foundations and, especially, corporations. By 2011, memberless organizations constituted 57 percent of the organizations active in Washington and 63 percent of all government-relations spending by organizations. In comparison, associations with individuals as members accounted for a mere 11 percent of the organizations active in politics and 9 percent of the lobbying expenditures.
All the concerns about democratic representation that emerge from studies of voluntary associations of individuals appear in exaggerated form when the organizational advocates have no members. Memberless organizations lean sharply in the direction of representing business interests and provide almost no representation for the less privileged or for broad public interests. Because they have stakeholders rather than members, it is difficult to know whom they represent through their political action. However, when corporations are involved in politics, some stakeholders—in particular, employees and the communities in which corporate facilities are located—seem to take a back seat to shareholders or management. Finally, compared to leaders of membership associations, leaders of memberless groups are less likely to be subject to democratic control when they pursue political influence: they are able to exercise greater freedom in initiating political action without authorization and have less reason to fear being rendered accountable.
Our findings about the dominance of organizations without members dovetail with a set of concerns that have been raised recently about various aspects of representation in American democracy. Scholars point to the ease with which economic inequalities are translated into political equalities.Footnote 46 For one thing, through the political activity of individuals, public officials hear much more from the affluent than from the economically disadvantaged.Footnote 47 Moreover, in electoral politics, skyrocketing campaign costs, coupled with a series of judicial decisions lifting the lid off the limits on campaign donations,Footnote 48 have created an environment of enhanced possibilities for political voice and influence among those with very deep pockets. Campaign dollars increasingly derive from a narrow slice of the very affluent,Footnote 49 and candidates, who must raise staggering sums, spend more and more time in the company of the very rich.Footnote 50 And, long before the courts ruled that money is a form of speech when it comes to campaign donations, direct communications to policymakers by organizations enjoyed First Amendment protection from regulation. Finally, in making policy, legislators are disproportionately likely to respond to their affluent constituentsFootnote 51 and to business and professional associations rather than to mass-based interest groups.Footnote 52
Organized interest advocacy, which has traditionally been hospitable to the conversion of market resources into political resources, is an integral part of this configuration of representational mechanisms. That organizations without members figure so importantly in pressure politics only exacerbates the circumstance such that economic and political inequalities reinforce one another.
Supplementary Materials
Instructions for accessing Washington Representatives dataset
Code for replicating results