I. INTRODUCTION
Application of thin ceramic coatings to surfaces of mechanical components and manufacturing tools is an important means for surface engineering. Reference Holmberg and Matthews1 Ceramic coatings have been applied widely, e.g., to gears, Reference Mercer, Evans, Yao, Allameh and Cooper2,Reference Jiang, Meng, Evans and Cooper3 bearings, Reference Kotzalas and Doll4,Reference Mutyala, Singh, Evans and Doll5 and machining tools. Reference Cselle and Barimani6–Reference Chinchanikar and Choudhury8 The mechanical integrity of the interface region between the ceramic coating and the underlying substrate is critical, as interfacial failures lead to rapid removal of coatings from substrates, often causing catastrophic failures of coated systems as a whole. In the last two decades, quantitative experimental assessment of critical stresses leading to failure of interfacial regions in coating/substrate systems has remained a challenge. A solid correlation between interfacial composition, interfacial structure, and interfacial mechanical integrity has not been well established.
To promote adhesion, deposition of ceramic coatings onto metallic or ceramic substrates is often preceded by deposition of a metal interfacial adhesion layer. Although the usefulness of the metal adhesion layer in promoting coating adhesion is known in an anecdotal fashion, surprisingly little quantitative data exist on the interfacial mechanical response of coating/metal-adhesion-layer/substrate systems, and on how different adhesion layers influence the interfacial mechanical response. Thus engineering of a particular coating/interlayer/substrate system often proceeds in a trial-and-error manner, necessitating testing under actual application conditions, which is both time consuming and expensive. It is therefore highly desirable to generate quantitative interfacial mechanical response data through suitable experimental testing protocols.
A range of mechanical tests have been devised to assess interfacial mechanical integrity of coating/substrate systems, including the pull and peel, Reference Brown and Mittal9 scratch, Reference Kattamis and Mittal10 indentation, Reference Drory and Hutchinson11,Reference Vlassak, Drory and Nix12 and substrate tension Reference Agrawal and Raj13 tests. In cases of high interfacial strength, as often demanded by applications, pull and peel tests usually are unable to affect interfacial failure because of the low strength of the polymeric bond used. The complexity of stress/strain distributions associated with scratch testing and the frequent lack of information on relevant materials’ parameters rarely allow extraction of quantitative information on interfacial mechanical response. Reference Bull and Mittal14 Quantitative extraction of interfacial toughness from wedge indentation tests requires a detailed elasto-plastic analysis of the ductile substrate, which is often unavailable. Reference Begley, Mumm, Evans and Hutchinson15 In the substrate tension test, ductile substrates onto which brittle ceramic coatings are deposited are loaded in tension and deformed plastically until transverse cracks appear in the brittle coating, perpendicular to the direction of tensile loading. A plateau in the density of such transverse cracks is used to infer limiting shear strength of the coating/substrate interface. Reference Agrawal and Raj13 Although limiting interfacial strength has been inferred from the substrate tension test, Reference Chen, Hwang, Yu and Huang16 large errors associated with determination of the saturation crack density and the critical fracture stress of the coating propagate into the final limiting shear strength value, leading to large uncertainties and difficulty with correlating to interfacial material design. Reference Mu, Chen, Lu, Meng and Doll17
Recently, we demonstrated a new microscale testing protocol for affecting shear failure of the interfacial region between ceramic coatings and substrates. Reference Mu, Chen, Lu, Meng and Doll17–Reference Mu, Chen and Meng19 Vapor-deposited planar coating/interlayer/substrate specimens were fabricated via scripted focused ion beam (FIB) milling into microscale cylindrical pillars, with the coating/interlayer/substrate interfaces inclined at 45° with respect to the pillar axis. Shear failures of the interfacial region were achieved through axial compression loading of the pillars, which leads to a shear loading on the interfacial region. Shear failure was observed when this shear stress reaches a critical value. In this paper, we demonstrate the efficacy of this new micro-pillar testing protocol for shear failure of the coating/substrate interfacial region by showing quantitative results on three coating/interlayer/substrate systems, namely, CrN/Cu/Si, CrN/Ti/Si, and CrN/Cr/Si. The present experiments show the applicability of the micro-pillar testing protocol to coating/interlayer/substrate systems with widely varying critical shear failure stresses. Our experiments show, for the first time to our knowledge, a significant dependence of this critical shear stress on the metal interlayer used. This testing protocol provides a quantitative assessment of interfacial mechanical response key to material-based coating/substrate interface design.
II. EXPERIMENTAL PROCEDURES
Vapor phase deposition of polycrystalline CrN coatings and polycrystalline elemental Cu, Ti, and Cr interlayers was carried out in an ultra-high-vacuum deposition system, which housed a 13.56 MHz inductively coupled plasma (ICP) generator and four balanced magnetron-sputter guns. Reference Meng, Curtis, Rehn and Baldo20 All sputter guns faced the center of the deposition chamber, with a base pressure of <3 × 10⁻⁹ Torr. Cleaned Si(001) substrates, 50.8 mm in diameter, were placed into a load lock, evacuated to <2 × 10⁻⁶ Torr, transferred to the center of the deposition chamber, in which all depositions occurred without intentional substrate heating. Two guns were fitted with elemental Cr (99.95%) targets, one gun was fitted with elemental Ti (99.95%), and one gun with elemental Cu (99.95%). The entire deposition sequence occurred in ∼10 mTorr of Ar (99.999%+) with all sputter guns operated in a constant dc current mode. The Si substrate was first subjected to an Ar ICP etch for ∼5 min at −50 V bias, with a total power of 1000 W input into two facing ICP coils. Immediately after etching, an elemental metal interlayer was deposited onto the Si substrate at a bias voltage of −50 V by sputtering the corresponding metal target in Ar ICP at the same total input power. Deposition of the CrN top-coating layer occurred immediately after deposition of the metal adhesion layer at a bias voltage of −100 V in an Ar/N2 (99.999%+) ICP at the same total input power. To ensure deposition of stoichiometric CrN, the Ar/N2 input flow rates during CrN deposition were adjusted to a nitrogen-rich condition past the pressure hysteresis point. The substrate bias voltage during CrN deposition was adjusted to ensure that the residual stress within the CrN layer is compressive and not excessive in magnitude. Thickness of the metal interlayers and the top CrN layer were controlled by controlling the respective deposition times. A number of CrN/metal-interlayer/Si specimens were deposited, with a top CrN coating layer thickness of ∼5 μm and varying thicknesses of the metal interlayers.
Structural analysis by X-ray diffraction (XRD) was carried out on a PANalytical Empyrean system (PANalytical B.V., Almelo, The Netherlands) with Cu Kα radiation. Scanning electron microscopy imaging with electron- or ion-induced secondary electrons (SE/ISE) and Ga+ FIB milling were carried out on an FEI Quanta3D Dual-Beam FEG instrument (FEI Company, Hillsboro, Oregon), which housed a 30 kV field-emission electron source, a 30 kV high-current Ga+ ion source, an OmniProbe for specimen lift-out, and an X-ray energy-dispersive spectroscopy (EDS) attachment. CrN/Cu/Si, CrN/Ti/Si, and CrN/Cr/Si micro-pillars with diameters of ∼5 μm were fabricated by scripted Ga+ ion milling on the FIB instrument. Reference Chen, Mu and Meng18 Transmission electron microscopy (TEM) examinations occurred on a JEM2011 microscope (JEOL Ltd., Tokyo, Japan) operated at 200 kV.
Axial compression loading of CrN/Cu/Si, CrN/Ti/Si, and CrN/Cr/Si micro-pillars was carried out on a NanoIndenter XP (Agilent Technologies, Santa Clara, California) with a custom-made, ∼10 × ∼10 μm, flat-ended diamond punch. An increasing load was applied to the pillar top surface in the displacement-controlled mode. During loading, a fixed displacement rate of 5 or 10 nm/s was specified, and the raw indenter load P and total indenter displacement Δ were measured continuously. For each CrN/metal-interlayer/Si specimen, repeat compression measurements were conducted on multiple micro-pillars fabricated from the same specimen.
III. RESULTS
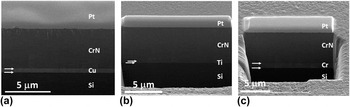
Figure 1 shows typical morphologies of as-deposited CrN/Cu/Si, CrN/Ti/Si, and CrN/Cr/Si specimens. The FIB cross sections show that the CrN coating layers possess a pronounced columnar structure typically of low temperature depositions, without evidence of any intercolumnar voids. The CrN top surfaces possess nanoscale roughness resulting from the columnar structure. The metal interlayers are flat and uniform in thickness. Thicknesses of both the CrN top layer and the metal interlayers were measured from the FIB cross sections. Additional TEM examination showed that the CrN, Cu, Ti, and Cr layers were all polycrystalline.
Typical morphologies of (a) CrN/Cu/Si, (b) CrN/Ti/Si, and (c) CrN/Cr/Si specimens. The SE images show typical morphologies of the CrN top surface and of the FIB cross sections. The thicknesses of the Cu, Ti, and Cr interlayers shown in (a), (b), and (c) are, respectively, 550 nm, 340 nm, and 1000 nm. The Pt bars on top of the cross sections were placed for surface protection during the FIB-milling process. The arrows denote the interface locations.

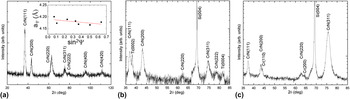
Results of XRD characterization are shown in Fig. 2. Figure 2(a) shows a typical 2θ scan of a CrN/Cu/Si specimen at a fixed glancing incidence angle of ω = 2.5°. At a fixed ω, the angle Ψ between the scattering vector and the specimen surface normal is given by Ψ = θ − ω. At this shallow incidence angle of ω = 2.5°, the X-ray path length within a ∼5 μm thick CrN layer exceeds 100 μm and the observed diffraction pattern arises solely from the CrN top layer. All observed diffraction peaks are indexed to a cubic B1 structure. The observation of all major B1 diffraction peaks at different Ψ values indicates that the CrN top layer is polycrystalline. The inset of Fig. 2(a) plots the values of the B1 lattice parameter, a
Ψ, calculated from all diffraction peaks observed at different Ψ values versus sin2 Ψ. A linear fit of a
Ψ versus sin2 Ψ yields
 ${a_\Psi } = (4.19\; \pm \;0.01) - (0.033\; \pm \;0.022){\sin ^2}\Psi$
(Å). The approximate linear dependence of a
Ψ on sin2 Ψ with a negative slope is consistent with the CrN top layer being under biaxial residual compression. Assuming an equal biaxial stress within the CrN top layer, σ, the relationship between a
Ψ and sin2 Ψ is given by
Reference Cullity and Stock21
 $${a_\Psi } = {a_{\rm{o}}}\left( {1 - {{2\nu } \over E}\sigma } \right) + {a_{\rm{o}}}{{1 + \nu } \over E}\sigma \,{\sin ^2}\,\Psi \quad ,$$
where E and ν are, respectively, the Young’s modulus and Poisson’s ratio of CrN, and a o is the stress-free lattice parameter. With values of E, ν, and a o taken, respectively, to be 375 GPa, 0.2, and 4.16 Å, Reference Ichimura and Ando22 σ is calculated from the fitted slope to be −2.5 GPa and the intercept of the a Ψ versus sin2 Ψ is calculated from the first term in Eq. (1) to be 4.17 Å, consistent with the fitted intercept of 4.19 Å. The crystallinity and level of residual stress as demonstrated by the data shown in Fig. 2(a) are typical of presently deposited CrN top layers: e.g., σ is compressive and not excessive in magnitude. Additional XRD data obtained from Cu layers showed that they are polycrystalline with a strong fiber texture of Cu〈111〉//Si[001]. Reference Mu, Zhang, Hutchinson and Meng23
XRD characterization of CrN/metal-interlayer/Si specimens: (a) a 2θ scan at a fixed glancing incidence angle of ω = 2.5° of a CrN/Cu/Si specimen. The inset shows the associated sin2 Ψ plot, with the line being a linear fit to the data; (b) a symmetrical θ–2θ scan of a CrN/Ti/Si specimen; and (c) a symmetrical θ–2θ scan of a CrN/Cr/Si specimen.

Figure 2(b) shows a typical symmetrical θ–2θ scan of a CrN/Ti/Si specimen. In addition to the Si(004) substrate peak, all other diffraction peaks are indexed to either B1 CrN or hcp Ti. The only Ti diffraction peaks observed in the θ–2θ diffraction pattern are the hcp (000l) reflections, indicating a strong texture of the Ti interlayer with the Ti hexagonal basal plane parallel to the Si substrate. The Ti lattice parameter determined from Ti(0002) and Ti(0004) reflections is c = 4.715 Å, close to the Ti bulk lattice parameter of c = 4.685 Å. Reference Cullity and Stock21 Figure 2(c) shows a typical symmetrical θ–2θ scan of a CrN/Cr/Si specimen. In addition to the Si(004) substrate peak, all other diffraction peaks are indexed to either B1 CrN or bcc Cr. Both the Cr (110) and (200) diffraction peaks are observed in the θ–2θ diffraction geometry, indicating that the texture of the Cr interlayer is not as strong as in the case of Ti. The Cr lattice parameter determined is a = 2.892 Å, close to the Cr bulk lattice parameter of a = 2.885 Å. Reference Cullity and Stock21
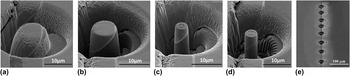
Figure 3 illustrates the process of cylindrical micro-pillar fabrication using scripted Ga+ FIB milling, with each pillar containing a coating/interlayer/substrate sandwich structure. CrN/interlayer/Si specimens, such as those shown in Fig. 1, were mounted on a 45° oriented fixture and mechanically polished to reveal the interface region. Reference Chen, Mu and Meng18 Figures 3(a)–3(c) show successive stages of top-down annular Ga+ FIB milling from the polished surface to isolate a portion of one CrN/Cu/Si specimen, with the CrN/Cu and Cu/Si interfaces inclined at 45° to the milling direction. Figure 3(d) shows one finished micro-pillar after the process of scripted FIB milling from the side of the pillar, during which the pillar being milled turns in a lathe-machining manner to ensure that the finished pillar is a right cylinder without significant taper. The Ga+ ion current used during the scripted FIB-milling step was 1 nA. Figure 3(e) shows one finished array of micro-pillars fabricated from the same CrN/Cu/Si specimen. Such micro-pillar arrays enable repeat pillar compression tests from the same coating/interlayer/substrate specimen. The same procedure was applied to fabricate CrN/Ti/Si and CrN/Cr/Si micro-pillars with 45° inclined interfaces.
Fabrication of cylindrical micro-pillar with scripted Ga+ FIB milling: the SE images (a), (b), (c), and (d) show successive stages of ion milling to shape a portion of a CrN/Cu/Si specimen into a micro-pillar without significant taper, with interfaces inclined at 45° to the pillar axis. The SE image shown in (e) shows one array of finished micro-pillars.

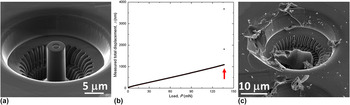
Figure 4(a) shows a typical monolithic Si(001) micro-pillar fabricated with scripted FIB milling. The pillar diameter and length are, respectively, 4.75 μm and 10 μm, and it is apparent that the fabricated pillar well approximates a right cylinder without significant taper. To characterize the mechanical response of the instrumented indentation system, axial compression measurements were conducted on 4 independent Si(001) micro‐pillars on the NanoIndenter XP with the 10 × 10 μm flat diamond indenter. The total compression load, P, versus the measured total displacement, Δ, obtained from compressing the Si pillar shown in Fig. 4(a) is shown in Fig. 4(b). The raw P–Δ curve exhibits a linearly rising section from the beginning and continues until P reaches ∼136 mN, at which point large excursions in Δ are observed and the pillar fails abruptly. The compression-failure morphology is shown in Fig. 4(c) through postmortem observation: the entire pillar shattered when the critical load was reached. The compression-failure stress is ∼7.7 GPa, consistent with previously reported values. Reference Moser, Wasmer, Barbieri and Michler24 Denoting the elastic displacement of the pillar as Δpillar, the elastic compliance of the pillar, Δpillar/P, is
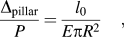 $${{{\Delta _{{\rm{pillar}}}}} \over P} = {{{l_0}} \over {E\pi {R^2}}}\quad ,$$
where E = 130 GPa is the Young’s modulus of Si in the 〈100〉 direction, Reference Brantley25 and l 0 and R are, respectively, the original length and radius of the pillar. For this particular pillar, its elastic compliance was calculated to be 4.3 nm/mN. The apparent compliance of this pillar, Δ/P, was determined to be 7.7 nm/mN from a linear fit to the data shown in Fig. 4(b) in the load range of 0 < P < 135 mN. This apparent compliance consists of the sum of the pillar elastic compliance and the indenter system compliance, Δ/P = Δpillar/P + Δsys/P where Δsys is the displacement of the indenter system. Therefore, the measurement shown in Fig. 4 yields an indenter system compliance of 3.4 nm/mN. Compression experiments performed on 4 independent Si(001) micro-pillars in one single experimental session showed an indenter system compliance of 3.3 ± 0.1 nm/mN. It is noted that although compression on multiple pillars fabricated on the same specimen yields rather consistent system compliance values, this value does depend on experimental details such as specimen mounting, and thus shows increased variation from one specimen to another.
Mechanical response of the instrumented indentation system: (a) an ISE image of one as-fabricated Si micro-pillar 4.75 μm in diameter and 10 μm in length, (b) the P–Δ curve measured from this pillar, the arrow points to the failure load, (c) an SE image of the morphology of pillar compression failure.

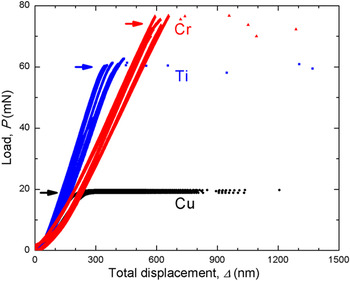
Figure 5 shows typical results obtained from axial compression of micro-pillars fabricated from one CrN/Cu/Si specimen, one CrN/Ti/Si specimen, and one CrN/Cr/Si specimen. In all pillars, the CrN/metal and metal/Si interfaces are inclined at 45° with respect to the pillar axes, as exemplified in Fig. 3. The diameters of all pillars are in the range of 4.5–5.0 μm. For the three specimens whose data sets are shown in Fig. 5, the thicknesses of the Cu, Ti, and Cr interlayers are respectively ∼810 nm, ∼180 nm, and ∼300 nm. Raw load P versus indenter displacement Δ curves are shown in Fig. 5, without correcting for system stiffness. For each CrN/metal-interlayer/Si specimen, repeat compression tests were conducted on 4 to 8 separate micro-pillars, with the resulting P–Δ curves shown in Fig. 5. Separate tests were performed on pillars with different diameters.
Typical raw load–displacement curves obtained from axial compression of CrN/metal-interlayer/Si micro-pillars with interfaces inclined at 45° with respect to the pillar axes. Three groups of curves correspond, respectively, to data obtained from three specimens with Cu, Ti, and Cr interlayers, plotted, respectively, in circles, squares, and triangles. The three arrows point to the critical loads for pillar specimens with Cu, Ti, and Cr interlayers: ∼20 mN, ∼60 mN, and ∼75 mN.

For the CrN/Cu/Si micro-pillars, it is evident from Fig. 5 that all P–Δ curves exhibit an initial rapid increase in P with increasing Δ until a critical load value, P c, is reached. Once P c is reached, Δ increases in a smooth fashion with little further increase in P, showing an extended and stable load plateau. As Δ continues to increase further, an eventual catastrophic-failure point is reached when large and discontinuous indenter displacement excursions occur. For the CrN/Ti/Si and CrN/Cr/Si micro-pillars, all P–Δ curves exhibit a similar initial rapid increase in P with increasing Δ until P c is reached. However, axial compression loading in these cases generated little if any load plateau. Abrupt shear failures tended to occur, manifested in large and discontinuous displacement excursions as soon as P c is reached. The three groups of data, obtained from pillar specimens with Cu, Ti, and Cr interlayers, separate clearly according to the observed critical load, lowest for Cu and highest for Cr.
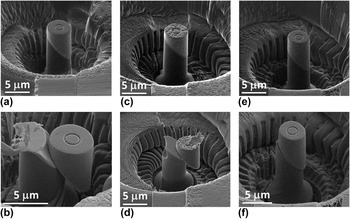
Figure 6 shows typical as-fabricated CrN/metal-interlayer/Si micro-pillars and their morphologies after axial compression testing. The diameters of three as-fabricated CrN/Cu/Si, CrN/Ti/Si, and CrN/Cr/Si micro-pillars, shown, respectively, in Figs. 6(a), 6(c), and 6(e), are all about 4.5 μm. All as-fabricated pillars are smooth and without taper. The morphology of shear failure in the CrN/Cu/Si micro-pillar shown in Fig. 6(a) as a result of axial compression loading is shown in Fig. 6(b), from which it is evident that the top CrN portion of the pillar slid as a whole with respect to the Si bottom portion as a result of the applied shear stress on the interfacial region. A part of the Si bottom portion was obliterated due to impact with the flat diamond punch when the large displacement excursion occurred. The sliding marks on the exposed Cu surface show clear evidence of shear displacement within the Cu interlayer. The SE image of the CrN/Ti/Si micro-pillar shown in Fig. 6(c) after compression testing is shown in Fig. 6(d), again showing that the top CrN portion of the pillar slid as a whole with respect to the Si bottom half along the 45° inclination. The SE image of the CrN/Cr/Si micro-pillar shown in Fig. 6(e) after compression testing is shown in Fig. 6(f). A similar shear failure morphology is observed. In this case, the compression test ended before the CrN top portion slid off the pillar bottom in a catastrophic fashion. Spot mode EDS analysis on specimens after shear failure, such as those shown in Figs. 6(b) and 6(d), showed the presence of metal signals on both the top surface of the bottom Si pillar portion and the bottom surface of the top CrN pillar portion, exposed as a result of the shear displacement. Reference Chen, Mu and Meng18,Reference Mu, Chen and Meng19 These combined morphological and compositional observations demonstrate that axial compression of CrN/metal-interlayer/Si micro-pillars with 45° inclined interfaces led to, in all cases, shear failures either within the metal interlayer or at the CrN/metal or metal/Si interfaces.
Morphology of compression induced shear failure of CrN/metal-interlayer/Si micro-pillars: (a) an ISE image of one CrN/Cu/Si pillar, with a Cu interlayer thickness of 550 nm, (b) an SE image of the pillar in (a) after shear failure, (c) an ISE image of one CrN/Ti/Si pillar, with a Ti interlayer thickness of 240 nm, (d) an SE image of the pillar in (c) after shear failure, (e) an ISE image of one CrN/Cr/Si pillar, with a Cr interlayer thickness of 1000 nm, and (f) an SE image of the pillar in (e) after shear failure.

Values of the average critical shear stress for inducing shear failure of the interfacial region, τc, was obtained from the critical axial compression load, P c, and the pillar diameter D as
 $${\tau _{\rm{c}}} = {{{{{P_{\rm{c}}}} \mathord{\left/ {\vphantom {{{P_{\rm{c}}}} {\left( {{{\pi {D^2}} \mathord{\left/ {\vphantom {{\pi {D^2}} 4}} \right. \kern-\nulldelimiterspace} 4}} \right)}}} \right. \kern-\nulldelimiterspace} {\left( {{{\pi {D^2}} \mathord{\left/ {\vphantom {{\pi {D^2}} 4}} \right. \kern-\nulldelimiterspace} 4}} \right)}}} \mathord{\left/ {\vphantom {{{{{P_{\rm{c}}}} \mathord{\left/ {\vphantom {{{P_{\rm{c}}}} {\left( {{{\pi {D^2}} \mathord{\left/ {\vphantom {{\pi {D^2}} 4}} \right. \kern-\nulldelimiterspace} 4}} \right)}}} \right. \kern-\nulldelimiterspace} {\left( {{{\pi {D^2}} \mathord{\left/ {\vphantom {{\pi {D^2}} 4}} \right. \kern-\nulldelimiterspace} 4}} \right)}}} 2}} \right. \kern-\nulldelimiterspace} 2}\quad .$$
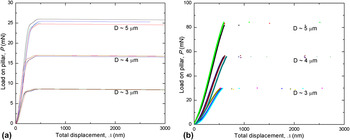
It is noted that τc, as calculated from Eq. (3), is the average shear stress when interfacial shear failure begins. Figures 7(a) and 7(b) show raw P–Δ curves without correcting for system stiffness, obtained, respectively, from compressing micro-pillars fabricated from one CrN/Cu/Si specimen and one CrN/Cr/Si specimen with 45° inclined interfaces. The thicknesses of the Cu and Cr interlayers are ∼550 nm and ∼1000 nm, respectively. For each specimen, a number of micro-pillars were fabricated at different diameters, D ∼3 μm, ∼4 μm, and ∼5 μm. Consistent with data shown in Fig. 5, at all D values, extended load plateaus were observed on CrN/Cu/Si micro-pillars, and little if any of a load plateau was observed on CrN/Cr/Si micro-pillars. From data shown in Fig. 7(a) on CrN/Cu/Si micro-pillars, τc was calculated to be 0.69 ± 0.02 GPa, largely independent of the value of D. From the data shown in Fig. 7(b) on CrN/Cr/Si micro-pillars, τc was calculated to be 2.0 ± 0.1 GPa, again largely independent of D. The insensitivity of measured τc on D was reported previously for Ti interlayers. Reference Chen, Mu and Meng18
P–Δ curves from micro-pillars with different diameters D, fabricated from (a) one CrN/Cu/Si specimen and (b) one CrN/Cr/Si specimen. The Cu and Cr interlayer thicknesses are, respectively, ∼550 nm and ∼1000 nm.

One concern with testing pillars fabricated by scripted FIB milling is that the milling process exposes the metal interlayer within the pillar specimen to more Ga+ ions as compared to top-down annual FIB milling, and thus may increase ion beam induced damage. However, it has been argued that the effect on the overall mechanics of micron-sized pillars may be negligible because the extent of the FIB damage is typically limited to within 20 nm from the edge of cut. Reference Sebastiani, Eberl, Bemporad and Pharr26 Consistently, the present observation of the relative independence of τc on D suggests that Ga+ ion damage does not seem to have a significant influence on τc measurements made on pillars several microns in diameter.
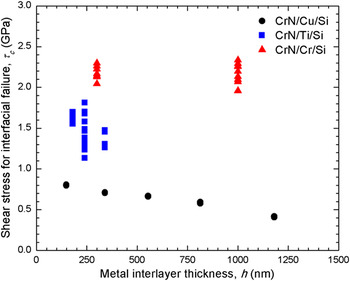
A number of CrN/metal-interlayer/Si specimens with different interlayer thicknesses, h, were fabricated into micro-pillars with interfaces inclined at 45° with respect to the pillar axis. Axial compression experiments were conducted on these pillars. Figure 8 shows measured values of τc as a function of h. Despite the significant data scatter, three distinct groups of τc values are clearly exhibited in Fig. 8, depending on the identity of the metal interlayer. Average values of τc are in the range of 0.4–0.8 GPa for Cu interlayers, 1.2–1.8 GPa for Ti interlayers, and 2.0–2.3 GPa for Cr interlayers. The data sets shown in Fig. 8 demonstrate, for the first time to our knowledge, significant differences in the critical shear stress for shear failures of interfacial regions in coating/metal-interlayer/substrate systems when different metal adhesion interlayers are used. The fact that Cr interlayers exhibit the highest critical shear stress for failure is curiously coincident with the anecdotal knowledge that Cr adhesion layers tend to perform better with ceramic coatings on steel substrates than Ti. The ability of quantitatively resolving differences in interfacial mechanical response as changes are made to the material composition and structure within the interfacial region is the key to achieving true materials-based coating/substrate interface design.
Average critical shear stress for interfacial shear failure as a function of the metal interlayer thickness. Black, blue, and red symbols denote, respectively, measurements on Cu, Ti, and Cr interlayers. Separate data points at the same interlayer thickness denote repeat measurements on separate pillars.

IV. DISCUSSION
Given a metal interlayer, data shown in Fig. 8 indicate that τc may have a significant dependence on its thickness h. In the CrN/Cu/Si case, we believe that the existence of an extended and stable load plateau on which the indenter can be stopped without triggering the catastrophic shear-off at the end, together with the clear sliding marks shown in Fig. 6(b), offers strong indication that the shear failure is related to plasticity within the Cu interlayer. The value of τc in this case relates to the initial shear flow stress of the Cu interlayer. The observed significant increase in τc with decreasing h, from 0.4 GPa to 0.8 GPa as h decreases from ∼1200 nm to ∼150 nm, is qualitatively consistent with predications of strain gradient plasticity models, according to which at least a part of the observed strengthening is due to the confinement of the plastic layer in between two elastic-brittle solids. Reference Mu, Hutchinson and Meng27 In the CrN/Ti/Si case, the data suggest some dependence of τc on h, from ∼1.4 GPa to ∼1.6 GPa as h decreases from ∼340 nm to ∼180 nm, albeit with large data scatter. In the CrN/Cr/Si case, the data show the least dependence of τc on h, with average τc values of ∼2.15 GPa at the two h values tested. The more significant qualitative difference between data obtained on Cu interlayers and those obtained on Ti and Cr interlayers is that little if any stable load plateau is observed in the latter two cases. Unlike the case of Cu interlayers, the present data cannot unequivocally rule out the possibility that shear failures in the cases of Ti and Cr interlayers may be due to interfacial fracture. Further studies are needed to resolve this issue.
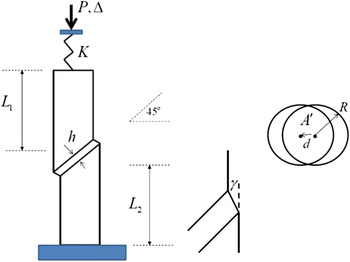
Assuming that the presently observed shear failures are indeed based on plasticity of the metal interlayers confined between the elastic-brittle CrN top and Si bottom portions, further analysis can be done on the present micro-pillar testing geometry. Figure 9 shows a schematic of the pillar containing a 45° inclined interlayer of thickness h. The lengths of the top and bottom sections sandwiching the interlayer are, respectively, L 1 and L 2. The total axial load on the indenter is P. The total displacement, Δ, is a sum of the actual indenter displacement, Δind, and the indenter system displacement Δsys. The indenter system compliance is 1/K = Δsys/P. In the absence of the interlayer, the total displacement is
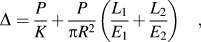 $$\Delta = {P \over K} + {P \over {\pi {R^2}}}\left( {{{{L_1}} \over {{E_1}}} + {{{L_2}} \over {{E_2}}}} \right)\quad ,$$
where E 1 and E 2 are, respectively, the Young’s moduli of the pillar top and bottom sections, R is the pillar radius, and K is the indenter system stiffness. In the experiments, the total displacement Δ was prescribed and P was measured. Including the interlayer at a 45° inclination with respect to the pillar axis, the total displacement becomes
 $$\Delta = {P \over K} + {P \over {\pi {R^2}}}\left( {{{{L_1}} \over {{E_1}}} + {{{L_2}} \over {{E_2}}}} \right) + {{\gamma h} \over {\sqrt 2 }}\quad ,$$
where γ is the shear angle or engineering shear strain of the interlayer. As shown in Fig. 9, A′ denotes the projected area on the plane perpendicular to the pillar axis that is common to the upper and lower surfaces of the interlayer. The relation between the load force P and the average shear stress τ in this common part of the interlayer is τ = P/(2A′), as portions of layer that have slipped out of the common area are assumed to carry no load. With
 $d = \gamma h/\sqrt 2$
as the horizontal offset of the central axes of the top and bottom sections of the pillar due to shear strain of the interlayer, it can be shown that
 $$A' = 2{R^2}\left[ {{\mathop{\rm arc}\nolimits} \,sin\left( {\sqrt {{{1 - {{\left( {{d \mathord{\left/ {\vphantom {d R}} \right. \kern-\nulldelimiterspace} R}} \right)}^2}} \mathord{\left/ {\vphantom {{1 - {{\left( {{d \mathord{\left/ {\vphantom {d R}} \right. \kern-\nulldelimiterspace} R}} \right)}^2}} 4}} \right. \kern-\nulldelimiterspace} 4}} } \right) - {d \over {2R}}\sqrt {{{1 - {{\left( {{d \mathord{\left/ {\vphantom {d R}} \right. \kern-\nulldelimiterspace} R}} \right)}^2}} \mathord{\left/ {\vphantom {{1 - {{\left( {{d \mathord{\left/ {\vphantom {d R}} \right. \kern-\nulldelimiterspace} R}} \right)}^2}} 4}} \right. \kern-\nulldelimiterspace} 4}} } \right]\quad .$$
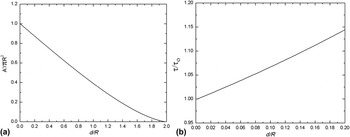
Note, for 45° inclined interlayers, d is close to the actual indenter displacement in the axial direction, Δind. As shown in Fig. 10(a), A′ decreases smoothly as d increases, and the overlap area becomes zero as the horizontal offset approaches the pillar diameter. Thus, for example, if the axial load P is a constant, τ = P/2A′ implies that the average shear stress τ must increase as shear deformation of the interlayer proceeds due to the fact that A′ decreases. Figure 10(b) shows such an increase in the average shear stress due to shear of the interlayer. At a constant P, τ/τo increases from 1 to ∼1.15 as d/R increases from 0.0 to 0.2, where τo is the average shear stress at the beginning of interlayer shear when d = 0. Thus a measured flat load plateau in the case of Cu interlayers, exemplified by the data shown for the CrN/Cu/Si micro-pillars in Figs. 5 and 7(a), implies an increasing average shear flow stress as the Cu interlayer shear progresses, i.e., the Cu interlayers exhibit some degree of shear strain hardening under the present testing configuration.
Geometry and conventions for the pillar test and stability analysis.

(a) Decrease of pillar overlap area versus the horizontal offset due to interlayer shear and (b) increase in the average shear stress versus the horizontal offset due to interlayer shear at a constant axial load.

To better understand the dynamic shear-off observed for Cu, Ti, and Cr interlayers, the analysis is carried further by neglecting the elasticity of the interlayer and assuming that the interlayer shear flow stress follows power law hardening, such that
 $$\tau = {\tau _{\rm{Y}}}{\left( {{\gamma \mathord{\left/ {\vphantom {\gamma {{\gamma _{\rm{Y}}}}}} \right. \kern-\nulldelimiterspace} {{\gamma _{\rm{Y}}}}}} \right)^N}\quad .$$
Using the expression for A′ at small d/R,
 $$A' \approx \pi {R^2} - dR\quad ,$$
and noting that τ = P/(2A′), it follows that
 $$\Delta = 2\pi {R^2}{\tau _{\rm{Y}}}{\left( {{\gamma \mathord{\left/ {\vphantom {\gamma {{\gamma _{\rm{Y}}}}}} \right. \kern-\nulldelimiterspace} {{\gamma _{\rm{Y}}}}}} \right)^N}\left( {1 - {1 \over {\sqrt 2 \pi }}{h \over R}\gamma } \right){{\hat L} \over {\hat E\pi {R^2}}} + {{\gamma h} \over {\sqrt 2 }}\quad ,$$
with
 $${{\hat L} \over {\pi {R^2}\hat E}} \equiv {1 \over K} + {1 \over {\pi {R^2}}}\left( {{{{L_1}} \over {{E_1}}} + {{{L_2}} \over {{E_2}}}} \right)\quad ,$$
and
 $${2 \over {\hat E}} \equiv \left( {{1 \over {{E_1}}} + {1 \over {{E_2}}}} \right)\quad .$$
Under prescribed Δ, instability, i.e., dynamic shear-off of the pillar, occurs when
 ${{{\rm{d}}\Delta } \over {{\rm{d}}\gamma }} = 0$
. This instability occurs when γ satisfies
 $${\left( {{\gamma \mathord{\left/ {\vphantom {\gamma {{\gamma _{\rm{Y}}}}}} \right. \kern-\nulldelimiterspace} {{\gamma _{\rm{Y}}}}}} \right)^N}\left( {{{\sqrt 2 } \over \pi }{h \over R}\left( {N + 1} \right)} \right) = {{2N} \over {{\gamma _{\rm{Y}}}}}{\left( {{\gamma \mathord{\left/ {\vphantom {\gamma {{\gamma _{\rm{Y}}}}}} \right. \kern-\nulldelimiterspace} {{\gamma _{\rm{Y}}}}}} \right)^{N - 1}} + {1 \over {\sqrt 2 }}{h \over {\hat L}}{{\hat E} \over {{\tau _{\rm{Y}}}}}\quad .$$
Two limiting cases can be considered. In the limit of
 $\hat L \to \infty$
, i.e., in the limit of small indenter system stiffness K and large pillar lengths L
1 and L
2,
 $$\gamma = 2N{\left( {{{\sqrt 2 } \over \pi }{h \over R}\left( {N + 1} \right)} \right)^{ - 1}} = {{\sqrt 2 \pi N} \over {N + 1}}{R \over h}\quad .$$
In this limit, a perfectly plastic interlayer with N = 0 is unstable at the onset of shear. Another limit to consider is for a perfectly plastic interlayer material (N = 0) and a finite
 $\hat L$
. By examining Eq. (9) together with Eq. (12), one finds
 $$\left\{ \matrix{ {\rm{stability\ for\ all\ }}\gamma \ {\rm{if\ }}{{\hat L} \over R} \lt {\pi \over 2}{{\hat E} \over {{\tau _{\rm{Y}}}}} \hfill \cr {\rm{instability\ for\ any \ }}\gamma {\rm{\ if\ }}{{\hat L} \over R} > {\pi \over 2}{{\hat E} \over {{\tau _{\rm{Y}}}}} \hfill \cr} \right.\quad .$$
Taking E
1 and E
2 to be, respectively, 375 GPa and 130 GPa, corresponding to the Young’s moduli of CrN and Si,
Reference Ichimura and Ando22,Reference Brantley25
 $\hat E$
is then 193 GPa. Taking L
1 = L
2 = 5 μm, R = 2.5 μm, and 1/K = 3.3 nm/mN as presently measured, Eq. (10) then gives
 $\hat L \approx 22.5$
μm. Taking an overestimate of τY to be ∼3 GPa, higher than any measured critical failure stress for Cu, Cr, and Ti interlayers, a conservative estimate of
 $\pi \hat E/2{\tau _{\rm{Y}}}$
is therefore ∼100. On the other hand, an overestimate of
 $\hat L/R$
is ∼10. Therefore, the inequality
 $\hat L/R \ \lt \ \pi \hat E/2{\tau _{\rm{Y}}}$
of Eq. (14) should hold comfortably in the present cases of CrN/interlayer/Si. This conclusion implies that the observed dynamic shear-off, occurring in all CrN/metal-interlayer/Si micro-pillars with the interlayer being Cu, Ti, or Cr, does not appear to be consistent with the above stability analysis, provided that the interlayers are either strain hardening or perfectly plastic.
We speculate on one scenario that can reconcile the observed dynamic shear-off with the stability analysis given above, which is that softening may occur upon shear deformation either within the metal interlayers or at the ceramic/metal interfaces. The normal strain hardening mechanisms, involving a balance between dislocation creation and interactions, may become less effective when plastic deformation is confined within a thin layer with impenetrable interfaces. In the case of Cu interlayers, some shear strain hardening does take place, as evidenced by the existence of an extended and stable load plateau, before the eventual dynamic shear-off occurs. In the cases of Ti or Cr interlayers, shear softening may occur without any substantial strain hardening at first, leading to the observed absence of a stable load plateau. Whether softening actually occurs during shear deformation of thin metal interlayers confined between elastic-brittle solids remains to be determined definitively in the future. Applying the present testing protocol to coating/interlayer/substrate systems with lower metal interlayer thicknesses and differing crystallographic orientations is also of interset for future studies.
V. SUMMARY
Using scripted Ga+ FIB milling, CrN/Cu/Si, CrN/Ti/Si, and CrN/Cr/Si cylindrical micro-pillars have been fabricated with interfaces inclined at 45° with respect to the pillar axes. Axial compression loading of such micro-pillars affects shear failures either within the metal interlayers or at the coating/interlayer or interlayer/substrate interfaces, and allows for quantitative measurements of the average critical shear stress for failure. The micro-pillar testing protocol showed, for the first time to our knowledge, significant differences in the average critical shear stress for failure as the identity of the metal adhesion layer changes from Cu to Ti and Cr. In the CrN/Cu/Si case, the shear failure is clearly associated with shear plastic flow within the Cu interlayer. In the CrN/Ti/Si and CrN/Cr/Si cases, the exact nature of shear failure remains to be determined in an unequivocal manner. The micro-pillar testing protocol is shown to be capable of generating quantitative information on interfacial shear response of ceramic-coating/metal-interlayer/substrate systems with widely varying critical failure stresses. It is hoped that additional data generated with this testing protocol will contribute positively toward quantitative performance evaluation and true materials design for coating/interlayer/substrate systems.
ACKNOWLEDGMENTS
The authors gratefully acknowledge partial project support from the U.S. National Science Foundation (NSF OIA-1541079) and the Louisiana State Board of Regents (LEQSF(2013-16)-RD-B-01).