




1. Introduction
Let
 $\mu$
be a probability measure on the unit square
 $[0,1]^2$
. Following [Reference Dawid, DeGroot and Mortera12], this measure is called coherent if it is the joint distribution of a two-variate random vector (X, Y) defined on some arbitrary probability space
 $(\Omega, \mathcal{F}, \mathbb{P})$
, such that
 $X=\mathbb{P}(E\mid\mathcal{G})$
and
 $Y=\mathbb{P}(E\mid\mathcal{H})$
almost surely for some measurable event
 $E\in \mathcal{F}$
and two sub-
 $\sigma$
-fields
 $\mathcal{G}, \mathcal{H} \subset \mathcal{F}$
. Throughout the text, the class of all coherent probability measures will be denoted by
 $\mathcal{C}$
; for the sake of convenience (and with a slight abuse of notation), we will also write
 $(X, Y) \in \mathcal{C}$
to indicate that the distribution of a random vector (X, Y) is coherent.
Coherent measures enjoy the following nice interpretation. Suppose that two experts provide their personal estimates on the likelihood of some random event E, and assume that the knowledge of the first and the second expert is represented by the
 $\sigma$
-algebras
 $\mathcal{G}$
and
 $\mathcal{H}$
, respectively. Then a natural idea to model the predictions of the experts is to use conditional expectations: this leads to the random variables X and Y as above.
The importance of coherent distributions stems from their numerous applications in statistics (cf. [Reference Dawid, DeGroot and Mortera12, Reference DeGroot13, Reference Ranjan and Gneiting17, Reference Satopää, Pemantle and Ungar19]) and economics [Reference Arieli and Babichenko1–Reference Arieli, Babichenko, Sandomirskiy and Tamuz3, Reference He, Sandomirskiy and Tamuz15]. Coherent distributions are also closely related to graph theory and combinatorial matrix theory; see, for instance, [Reference Boza, Kr̆epela and Soria4, Reference Cichomski7, Reference Cichomski and Petrov11, Reference Tao20]. Moreover, there has been substantial purely probabilistic advancement on this subject during the last decade [Reference Burdzy and Pal5, Reference Burdzy and Pitman6, Reference Cichomski and OsĘkowski8–Reference Cichomski and OsĘkowski10, Reference Zhu21]. The main interest, both in applied and theoretical considerations, involves bounding the maximal discrepancy of coherent vectors measured by different functionals. A canonical result of this type is the following threshold bound [Reference Burdzy and Pal5].
Theorem 1.1. For any parameter
 $\delta \in \big(\frac{1}{2},1\big]$
,
 \begin{equation*} \sup_{(X,Y)\in \mathcal{C}} \mathbb{P}(|X-Y|\ge \delta) = \frac{2(1-\delta)}{2-\delta}. \end{equation*}
For a generalisation of this equation to n-variate coherent vectors, consult [Reference Cichomski and OsĘkowski9]. Another important example is the expectation bound established independently in [Reference Arieli, Babichenko, Sandomirskiy and Tamuz3, Reference Cichomski7].
Theorem 1.2. For any exponent
 $\alpha\in (0,2]$
,
 $\sup_{(X,Y)\in \mathcal{C}}\mathbb{E}|X-Y|^{\alpha} = 2^{-\alpha}$
.
Analysis of the left-hand side of this latter equation for
 $\alpha>2$
remains a major open problem and constitutes one of the main motivations for this paper. Accordingly, we investigate the asymptotic behaviour of this expression and derive an appropriate sharp estimate.
Theorem 1.3.
 $\lim_{\alpha \to \infty}\alpha\cdot(\sup_{(X,Y)\in \mathcal{C}}\mathbb{E}|X-Y|^{\alpha}) = {2}/{\mathrm{e}}$
.
The proof of Theorem 1.3 that we present below rests on a novel, geometric-type approach. As verified in [Reference Burdzy and Pitman6], the family of coherent distributions is a convex, compact subset of the space of probability distributions on
 $[0,1]^2$
equipped with the usual weak topology. One of the main results of this paper is to provide a characterisation of the extremal points of
 $\mathcal{C}$
, which is considered to be one of the major challenges of the topic [Reference Burdzy and Pitman6, Reference Zhu21].
It is instructive to take a look at the corresponding problem arising in the theory of martingales, the solution to which is well known. Namely (see [Reference Dubins and Schwarz14]), fix
 $N\in \mathbb{N}$
and consider the class of all finite martingales
 $(M_1,M_2,\dots, M_N)$
and the induced distributions on
 $\mathbb R^N$
. The extremal distributions can be characterised as follows:
-
(i)
 $M_1$
is concentrated in one point;
-
(ii) for any
$n=2,3,\ldots,N$
, the conditional distribution of
$M_n$
given
$(M_i)_{i=1}^{n-1}$
is concentrated on a set of cardinality at most two.




In particular, the support of a two-variate martingale with an extremal distribution cannot exceed two points. Surprisingly, the structure of
 $\mathrm{ext}(\mathcal{C})$
(the set of extreme points of
 $\mathcal{C}$
) is much more complex, as there exist extremal coherent measures with arbitrarily large or even countably infinite numbers of atoms [Reference Arieli, Babichenko, Sandomirskiy and Tamuz3, Reference Zhu21]. Conversely, as proved in [Reference Arieli, Babichenko, Sandomirskiy and Tamuz3], elements of
 $\mathrm{ext}(\mathcal{C})$
are always supported on sets of Lebesgue measure zero. The existence of nonatomic extreme points remains yet another open problem.
For further discussion, we need to introduce some additional background and notation. For a measure
 $\mu$
supported on
 $[0,1]^2$
, we write
 $\mu^x$
and
 $\mu^y$
for the marginal measures of
 $\mu$
on [0, 1], i.e. for the measures obtained by projecting
 $\mu$
on the first and the second coordinate, correspondingly.
Definition 1.1. Introduce the family
 $\mathcal{R}$
, which consists of all ordered pairs
 $(\mu, \nu)$
of nonnegative Borel measures on
 $[0,1]^2$
for which
 $\int_{A}(1-x)\,\mathrm{d}\mu^x = \int_{A}x\,\mathrm{d}\nu^x$
and
 $\int_{B}(1-y)\,\mathrm{d}\mu^y = \int_{B}y\,\mathrm{d}\nu^y$
, for any Borel subsets
 $A,B \in \mathcal{B}([0,1])$
.
It turns out that the family
 $\mathcal{R}$
is very closely related to the class of coherent distributions. We will prove the following statement (a slightly different formulation can be found in [Reference Arieli, Babichenko, Sandomirskiy and Tamuz3]).
Proposition 1.1. Let m be a probability measure on
 $[0,1]^2$
. Then m is coherent if and only if there exists
 $(\mu, \nu)\in \mathcal{R}$
such that
 $m=\mu+\nu$
.
Proposition 1.1 motivates the following.
Definition 1.2. For a fixed
 $m\in\mathcal{C}$
, consider the class
 $\mathcal{R}(m) = \{(\mu,\nu)\in\mathcal{R}\colon m=\mu+\nu\}$
. Any element
 $(\mu,\nu)\in\mathcal{R}(m)$
will be called a representation of a coherent distribution m.
By the very definition, both
 $\mathcal{C}$
and
 $\mathcal{R}$
, and hence also
 $\mathcal{R}(m)$
, are convex sets. To proceed, let us distinguish the ordering in the class of measures, which will often be used in our considerations below. Namely, for two Borel measures
 $\mu_1, \mu_2$
supported on the unit square, we write
 $\mu_1\leq \mu_2$
if we have
 $\mu_1(A)\le \mu_2(A)$
for all
 $A\in \mathcal{B}([0,1]^2)$
.
Definition 1.3. Let
 $m\in\mathcal{C}$
. We say that the representation
 $(\mu,\nu)$
of m is
-
unique if, for every
$(\tilde{\mu}, \tilde{\nu})\in \mathcal{R}$
with
$m=\tilde{\mu}+\tilde{\nu}$
, we have
$\tilde{\mu}=\mu$
and
$\tilde{\nu}=\nu$
; -
minimal if, for all
$(\tilde{\mu}, \tilde{\nu})\in \mathcal{R}$
with
$\tilde{\mu}\le \mu$
and
$\tilde{\nu}\le \nu$
, there exists
$\alpha \in [0,1]$
such that
$(\tilde{\mu}, \tilde{\nu}) = \alpha \cdot (\mu, \nu)$
.



In practice, we are interested only in the minimality of those representations that have been previously verified to be unique. In such a case, the minimality of
 $(\mu, \nu)$
is just an indecomposability condition for m: we are asking whether every ‘coherent subsystem’
 $(\tilde{\mu}, \tilde{\nu})$
contained in m is necessarily just a smaller copy of m. To gain some intuition about the above concepts, let us briefly discuss the following example.
Example 1.1. Consider an arbitrary probability distribution m supported on the diagonal. This distribution is coherent. To see this, let
 $\xi$
be a random variable on some probability space
 $(\Omega,\mathcal{F},\mathbb{P})$
such that
 $\xi\sim m^x$
. Consider the product space
 $(\tilde{\Omega},\tilde{\mathcal{F}},\tilde{\mathbb{P}}) = (\Omega\times[0,1],\mathcal{F}\otimes \mathcal{B}([0,1]),\mathbb{P}\otimes|\cdot|)$
, where
 $|\cdot|$
denotes the Lebesgue measure. Then
 $\xi$
has the same distribution as
 $\tilde{\mathbb{P}}(E\mid\mathcal{G})$
, where
 $\mathcal{G}$
is the sub-
 $\sigma$
-algebra of
 $\tilde{\mathcal{F}}$
consisting of all sets of the form
 $A\times [0,1]$
, with
 $A\in \mathcal{F}$
, and the event
 $E\in \tilde{\mathcal{F}}$
is given by
 $E = \{(\omega,y)\in\Omega\times[0,1]\colon y\leq\xi(\omega)\}$
. Consequently, we have
 $(\tilde{\mathbb{P}}(E\mid\mathcal{G}),\tilde{\mathbb{P}}(E\mid\mathcal{G}))\sim(\xi,\xi)\sim m$
and hence m is coherent.
Next, let us describe the representation
 $(\mu,\nu)$
of m. Since the measure is supported on the diagonal, both components
 $\mu$
and
 $\nu$
(if they exist) must also have this property and hence, when checking the conditions in the definition of the family
 $\mathcal{R}$
, it is enough to verify the first of them. But the first condition is equivalent to saying that
 $\mathrm{d} \mu^x = x\,\mathrm{d} m^x$
and
 $\mathrm{d} \nu^x = (1-x)\,\mathrm{d} m^x$
; this gives the existence and uniqueness of the representation.
Finally, let us discuss the minimality of the representation of m. If m is concentrated at a single point
 $(\delta,\delta)$
, then the same is true for
 $\mu$
and
 $\nu$
, and hence also for
 $\tilde{\mu}$
and
 $\tilde{\nu}$
, where
 $(\tilde{\mu},\tilde{\nu})\in\mathcal{R}$
is a pair as in the definition of minimality. Now, we can easily verify that
 $(\tilde{\mu},\tilde{\nu})$
is proportional to
 $(\mu,\nu)$
, directly applying the equations in the definition of class
 $\mathcal{R}$
with
 $A=B=\{\delta\}$
; thus, the representation is minimal. It remains to study the case in which m is not concentrated at a single point. Then there is a measure
 $\tilde{m}$
satisfying
 $\tilde{m}\leq m$
, which is not proportional to m. Repeating the above argumentation with m replaced by
 $\tilde{m}$
, we see that
 $\tilde{m}$
can be decomposed as the sum
 $\tilde{\mu}+\tilde{\nu}$
, where
 $(\tilde{\mu},\tilde{\nu})\in\mathcal{R}$
is a pair of measures supported on the diagonal uniquely determined by
 $\mathrm{d}\tilde{\mu}^x = x\,\mathrm{d}\tilde{m}^x$
and
 $\mathrm{d}\tilde{\nu}^x = (1-x)\,\mathrm{d}\tilde{m}^x$
. Since
 $\tilde{m}\leq m$
, we also have
 $\tilde{\mu}\leq\mu$
and
 $\tilde{\nu}\leq\nu$
. It remains to note that
 $(\tilde{\mu},\tilde{\nu})$
is not proportional to
 $(\mu,\nu)$
, since the same is true for
 $\tilde{m}$
and m. This proves that the representation
 $(\mu,\nu)$
is not minimal.
With these notions at hand, we give the following general characterisation of
 $\textrm{ext}(\mathcal{C})$
.
Theorem 1.4. Let m be a coherent distribution on
 $[0,1]^2$
. Then m is extremal if and only if the representation of m is unique and minimal.
This statement will be established in the next section. Then, in Section 3, we concentrate on extremal coherent measures with finite support. Let
 $\textrm{ext}_\mathrm{f}(\mathcal{C}) = \{\eta\in\textrm{ext}(\mathcal{C})\colon|\mathrm{supp}(\eta)|<\infty\}$
. Theorem 1.4 enables us to deduce several structural properties of
 $\textrm{ext}_\mathrm{f}(\mathcal{C})$
; most importantly, as conjectured in [Reference Zhu21], we show that the support of
 $\eta\in\textrm{ext}_\mathrm{f}(\mathcal{C})$
cannot contain any axial cycles. Here is the definition.
Definition 1.4. The sequence
 $\big((x_i,y_i)\big)_{i=1}^{2n}$
with values in
 $[0,1]^2$
is called an axial cycle if all the points
 $(x_i, y_i)$
are distinct, the endpoint coordinates
 $x_1$
and
 $x_{2n}$
coincide, and
 $x_{2i} = x_{2i+1}$
and
 $y_{2i-1} = y_{2i}$
for all i.
Remarkably, the same ‘no axial cycle’ property holds true for extremal doubly stochastic measures (permutons)—for the relevant discussion, see [Reference Hestir and Williams16]. Next, in Section 4, we apply our previous results and obtain the following reduction towards Theorem 1.3: for all
 $\alpha \ge1$
,
 \begin{equation} \sup_{(X,Y)\in\mathcal{C}}\mathbb{E}|X-Y|^{\alpha} = \sup_{\tilde{\textbf{z}}}\sum_{i=1}^{n}z_i \bigg|\frac{z_i}{z_{i-1}+z_i}-\frac{z_i}{z_i+z_{i+1}}\bigg|^{\alpha}.\end{equation}
Here, the supremum is taken over all n and all sequences
 $\tilde{\textbf{z}} = (z_0, z_1, \dots, z_{n+1})$
such that
 $z_0=z_{n+1}=0$
,
 $z_i> 0$
for all
 $i=1,2,\ldots,n$
, and
 $\sum_{i=1}^{n}z_i=1$
. Finally, using several combinatorial arguments and reductions, we prove Theorem 1.3 by direct analysis of the right-hand side of (1.1).
2. Coherent measures, representations
Let
 $\mathcal{M}([0,1]^2)$
and
 $\mathcal{M}([0,1])$
denote the space of nonnegative Borel measures on
 $[0,1]^2$
and [0, 1], respectively. For
 $\mu \in \mathcal{M}([0,1]^2)$
, let
 $\mu^x, \mu^y \in \mathcal{M}([0,1])$
be defined by
 $\mu^x(A) = \mu(A\times [0,1])$
and
 $\mu^y(B)=\mu([0,1]\times B)$
for all Borel subsets
 $A,B\in\mathcal{B}([0,1])$
. We begin with the following characterisation of
 $\mathcal{C}$
.
Proposition 2.1. Let
 $m \in \mathcal{M}([0,1]^2)$
. The measure m is a coherent distribution if and only if it is the joint distribution of a two-variate random vector (X,Y) such that
 $X=\mathbb{E}(Z\mid X)$
and
 $Y=\mathbb{E}(Z\mid Y)$
almost surely for some random variable Z with
 $0\le Z\le 1$
.
Proof. This is straightforward. See [Reference Burdzy and Pitman6, Reference Cichomski7].
Recall the definition of the class
 $\mathcal{R}$
formulated in the previous section. Let us study the connection between this class and the family of all coherent distributions.
Proof of Proposition 1.1. First, we show that the decomposition
 $m=\mu+\nu$
exists for all
 $m\in \mathcal{C}$
. Indeed, by virtue of Proposition 2.1, we can find a random vector
 $(X,Y)\sim m$
defined on some probability space
 $(\Omega, \mathcal{F}, \mathbb{P})$
such that
 $X=\mathbb{E}(Z\mid X)$
and
 $Y=\mathbb{E}(Z\mid Y)$
for some random variable
 $Z\in[0,1]$
. For a set
 $C\in\mathcal{B}([0,1]^2)$
, we put
 \begin{equation} \mu(C) = \int_{\{(X,Y)\in C\}}Z\,\mathrm{d}\mathbb{P}, \qquad \nu(C) = \int_{\{(X,Y)\in C\}}(1-Z)\,\mathrm{d}\mathbb{P}. \end{equation}
Then the equality
 $m=\mu+\nu$
is evident. Furthermore, for a fixed
 $A\in \mathcal{B}([0,1])$
,
 \begin{equation} \int_{\{X\in A\}}X\,\mathrm{d}\mathbb{P} = \int_{\{X\in A\}}Z\,\mathrm{d}\mathbb{P} = \int_{A}1\,\mathrm{d}\mu^x, \end{equation}
where the first equality is due to
 $X=\mathbb{E}(Z\mid X)$
and the second is a consequence of (2.1). Moreover, we may also write
 \begin{equation} \int_{\{X\in A\}}X\,\mathrm{d}\mathbb{P} = \int_{A\times[0,1]}x\,\mathrm{d}m = \int_{A}x\,\mathrm{d}\mu^x + \int_{A}x\,\mathrm{d}\nu^x. \end{equation}
Combining (2.2) and (2.3), we get
 $\int_{A}(1-x)\,\mathrm{d}\mu^x = \int_{A}x\,\mathrm{d}\nu^x$
for all
 $A\in \mathcal{B}([0,1])$
. The symmetric condition (the second requirement in Definition 1.1) is shown analogously. This completes the first part of the proof.
Now, pick a probability measure m on
 $[0,1]^2$
such that
 $m=\mu+\nu$
for some
 $(\mu, \nu) \in \mathcal{R}$
. We need to show that m is coherent. To this end, consider the probability space
 $([0,1]^2, \mathcal{B}([0,1]^2),m)$
and the random variables
 $X,Y\colon[0,1]^2 \rightarrow [0,1]$
defined by
 $X(x,y)=x$
and
 $Y(x,y)=y$
,
 $x,y\in [0,1]$
. Additionally, let Z denote the Radon–Nikodym derivative of
 $\mu$
with respect to m: we have
 $0\le Z \le 1$
m-almost surely and
 $\mu(C) = \int_{C}Z\,\mathrm{d}m$
for all
 $C\in\mathcal{B}([0,1]^2)$
. Again by Proposition 2.1, it is sufficient to verify that
 $X=\mathbb{E}(Z\mid X)$
and
 $Y=\mathbb{E}(Z\mid Y)$
. By symmetry, it is enough to show the first equality. Fix
 $A\in \mathcal{B}([0,1])$
and note that
 \begin{equation} \int_{\{X\in A\}}X\,\mathrm{d}m = \int_{A\times[0,1]}x\,\mathrm{d}m = \int_{A}x\,\mathrm{d}\mu^x + \int_{A}x\,\mathrm{d}\nu^x. \end{equation}
Similarly, we also have
 \begin{equation} \int_{\{X\in A\}}Z\,\mathrm{d}m = \int_{A\times[0,1]}Z\,\mathrm{d}m = \mu(A\times[0,1]) = \int_{A}1\,\mathrm{d}\mu^x. \end{equation}
Finally, note that by
 $(\mu, \nu) \in \mathcal{R}$
, the right-hand sides of (2.4) and (2.5) are equal. Therefore, we obtain the identity
 $\int_{\{X\in A\}}X\,\mathrm{d}m = \int_{\{X\in A\}}Z\,\mathrm{d}m$
for arbitrary
 $A\in \mathcal{B}([0,1])$
. This yields the claim.
We turn our attention to the characterisation of
 $\mathrm{ext}(\mathcal{C})$
stated in the previous section.
Proof of Theorem 1.4. For the implication ‘
 $\Rightarrow$
’, let m be an extremal coherent measure and suppose, on the contrary, that
 $(\mu_1, \nu_1)$
and
 $(\mu_2, \nu_2)$
are two different elements of
 $\mathcal{R}(m)$
. We will prove that
 $m-\mu_1+\mu_2$
and
 $m-\mu_2+\mu_1$
are also coherent distributions. Because
 \begin{align*}m = \frac{1}{2}(m-\mu_1+\mu_2) + \frac{1}{2}(m-\mu_2+\mu_1),\end{align*}
we obtain a contradiction with the assumed extremality of m. By symmetry, it is enough to show that
 $(m-\mu_1+\mu_2) \in \mathcal{C}$
. To this end, by virtue of Proposition 1.1, it suffices to check that
 $m-\mu_1+\mu_2$
is a probability measure and
 $(\mu_2, m-\mu_1) \in \mathcal{R}$
. First, note that
 $\nu_1=m-\mu_1$
is nonnegative, and fix an arbitrary
 $A\in \mathcal{B}([0,1])$
. As
 $(\mu_1, \nu_1)$
and
 $(\mu_2, \nu_2)$
are representations of m, Definition 1.1 gives
 \begin{align} \int_{A}1\,\mathrm{d}\mu_1^x = \int_{A}x\,(\mathrm{d}\nu_1^x+\mathrm{d}\mu_1^x) = \int_{A}x\,\mathrm{d}m^x, \nonumber \\[5pt] \int_{A}1\,\mathrm{d}\mu_2^x = \int_{A}x\,(\mathrm{d}\nu_2^x+\mathrm{d}\mu_2^x) = \int_{A}x\,\mathrm{d}m^x, \end{align}
so
 $\mu_1^x(A)=\mu_2^x(A)$
. Similarly, we can deduce that
 $\mu_1^y=\mu_2^y$
, which means that marginal distributions of
 $\mu_1$
and
 $\mu_2$
are equal. This, together with
 $m-\mu_1\ge 0$
, proves that
 $m-\mu_1+\mu_2$
is a probability measure. Next, using (2.6) and
 $\mu_1^x=\mu_2^x$
, we can also write
 \begin{equation} \int_{A}(1-x)\,\mathrm{d}\mu_2^x = \int_{A}x\,\mathrm{d}m^x - \int_{A}x\,\mathrm{d}\mu_1^x = \int_{A}x\,\mathrm{d}(m-\mu_1)^x. \end{equation}
In the same way, we get
 \begin{equation} \int_{B}(1-y)\,\mathrm{d}\mu_2^y = \int_{B}y\,\mathrm{d}(m-\mu_1)^y \end{equation}
for all
 $B\in \mathcal{B}([0,1])$
. By (2.7) and (2.8), we obtain
 $(\mu_2, m-\mu_1) \in \mathcal{R}$
, and this completes the proof of uniqueness.
To show the minimality, let m be an extremal coherent measure with the representation
 $(\mu,\nu)$
(which is unique, as we have just proved). Consider any nonzero
 $(\tilde{\mu},\tilde{\nu})\in\mathcal{R}$
with
 $\tilde{\mu}\le \mu$
and
 $\tilde{\nu}\le \nu$
. Then, by the very definition of
 $\mathcal{R}$
,
 $(\mu-\tilde{\mu},\nu-\tilde{\nu})\in\mathcal{R}$
. Therefore, by Proposition 1.1, we get
 $\alpha^{-1}(\tilde{\mu}+\tilde{\nu}),(1-\alpha)^{-1}(m-\tilde{\mu}-\tilde{\nu}) \in \mathcal{C}$
, where
 $\alpha=(\tilde{\mu}+\tilde{\nu})([0,1]^2) \in (0,1]$
. We have the identity
 \begin{equation*} m = \alpha\cdot(\alpha^{-1}(\tilde{\mu}+\tilde{\nu})) + (1-\alpha)\cdot((1-\alpha)^{-1}(m-\tilde{\mu}-\tilde{\nu})), \end{equation*}
which, combined with the extremality of m, yields
 $m=\alpha^{-1}(\tilde{\mu}+\tilde{\nu})=\alpha^{-1}\tilde{\mu}+\alpha^{-1}\tilde{\nu}$
. But
 $(\alpha^{-1}\tilde{\mu},\alpha^{-1}\tilde{\nu})$
belongs to
 $\mathcal{R}$
, since
 $(\tilde{\mu},\tilde{\nu})$
does, and hence
 $(\alpha^{-1}\tilde{\mu},\alpha^{-1}\tilde{\nu})$
is a representation of m. By the uniqueness, we deduce that
 $(\tilde{\mu}, \tilde{\nu}) = \alpha\cdot(\mu,\nu)$
.
For the implication ‘
 $\Leftarrow$
’, let m be a coherent distribution with the unique and minimal representation
 $(\mu, \nu)$
. To show that m is extremal, consider the decomposition
 $m=\beta \cdot m_1+(1-\beta)\cdot m_2$
for some
 $m_1, m_2 \in \mathcal{C}$
and
 $\beta \in (0,1)$
. Moreover, let
 $(\mu_1, \nu_1)\in \mathcal{R}(m_1)$
and
 $(\mu_2, \nu_2) \in \mathcal{R}(m_2)$
. By the convexity of
 $\mathcal{R}$
, we have
 \begin{equation*} (\mu', \nu') \;:\!=\; (\beta\mu_1 + (1-\beta)\mu_2,\,\beta\nu_1 +(1-\beta)\nu_2) \in \mathcal{R}(m) \end{equation*}
and hence, by the uniqueness, we get
 $(\mu', \nu')=(\mu, \nu)$
. Then, directly from the previous equation, we have
 $\beta \mu_1\le \mu$
and
 $\beta \nu_1 \le \nu$
. Combining this with the minimality of
 $(\mu, \nu)$
, we get
 $(\beta\mu_1,\beta\nu_1)=\alpha (\mu,\nu)$
for some
 $\alpha\in [0,1]$
. Since
 $m=\mu+\nu$
and
 $m_1=\mu_1+\nu_1$
are probability measures, this gives
 $\alpha=\beta$
and hence
 $(\mu_1, \nu_1)=(\mu, \nu)$
. This implies
 $m=m_1$
and completes the proof.
3. Extreme points with finite support
In this section we study the geometric structure of the supports of measures belonging to
 $\textrm{ext}_\mathrm{f}(\mathcal{C}) = \{\eta \in \textrm{ext}(\mathcal{C}) \colon |\mathrm{supp}(\eta)|<\infty\}$
. Our key result is presented in Theorem 3.1—we prove that the support of an extremal coherent distribution cannot contain any axial cycles (see Definition 1.4). Let us emphasise that this property was originally conjectured in [Reference Zhu21]. We start with a simple combinatorial observation: it is straightforward to check that certain special ‘alternating’ cycles are forbidden.
Definition 3.1. Let
 $\eta$
be a coherent distribution with a unique representation
 $(\mu, \nu)$
, and let
 $\big((x_i,y_i)\big)_{i=1}^{2n}$
be an axial cycle contained in
 $\mathrm{supp}(\eta)$
. Then
 $\big((x_i,y_i)\big)_{i=1}^{2n}$
is an alternating cycle if
 $(x_{2i+1},y_{2i+1})\in\mathrm{supp}(\mu)$
and
 $(x_{2i}, y_{2i})\in\mathrm{supp}(\nu)$
, for all
 $i=1,2,\dots, n$
(with the convention that
 $x_{2n+1}=x_1$
,
 $y_{2n+1}=y_1$
).
An example of such an alternating cycle is shown in Figure 1.
An example of an alternating cycle. Red points represent probability masses in
 $\mathrm{supp}(\mu)$
, while blue points indicate probability masses in
 $\mathrm{supp}(\nu)$
. Arrows outline a possible transformation of the representation
 $(\mu,\nu)$
.

Proposition 3.1. If
 $\eta \in \mathrm{ext}_\mathrm{f}(\mathcal{C})$
, then
 $\mathrm{supp}(\eta)$
does not contain any alternating cycles.
Proof. Let
 $\eta$
be a coherent distribution with a unique representation
 $(\mu,\nu)$
and a finite support. Additionally, assume that
 $\big((x_i,y_i)\big)_{i=1}^{2n}$
is an alternating cycle contained in
 $\mathrm{supp}(\eta)$
. Let
 $\delta$
be the smaller of the two numbers
 $\min_{0\le i \le n-1}\mu(x_{2i+1}, y_{2i+1})$
and
 $\min_{1\le i \le n}\nu(x_{2i}, y_{2i})$
(for brevity, in what follows we will skip the braces and write
 $\mu(a,b)$
,
 $\nu(a,b)$
instead of
 $\mu(\{a,b\})$
,
 $\nu(\{a,b\})$
, respectively). By Definition 3.1, we have
 $\delta>0$
. Now, consider the transformation
 $(\mu, \nu) \mapsto (\mu', \nu')$
described by the following requirements:
-
1. for
$i=0,1,\dots, n-1$
, put
\begin{align*}\mu'(x_{2i+1},y_{2i+1}) \;:\!=\; \mu(x_{2i+1},y_{2i+1}) - \delta, \qquad \nu'(x_{2i+1},y_{2i+1}) \;:\!=\; \nu(x_{2i+1},y_{2i+1}) + \delta;\end{align*}
-
2. for
$i=1,2,\dots, n$
, put
\begin{align*}\mu'(x_{2i}, y_{2i}) \;:\!=\; \mu(x_{2i}, y_{2i})+\delta, \qquad \nu'(x_{2i}, y_{2i}) \;:\!=\; \nu(x_{2i}, y_{2i})-\delta;\end{align*}
-
3. for
$(x,y)\not \in \{ (x_i,y_i)\colon 1\le i \le 2n\}$
, set
$\mu'(x,y)=\mu(x,y)$
,
$\nu'(x,y)=\nu(x,y)$
.






Note that
 $\mu$
and
 $\mu'$
, as well as
 $\nu$
and
 $\nu'$
, have the same marginal distributions and hence
 $(\mu', \nu')\in \mathcal{R}$
. We also have
 $\mu'+\nu'=\mu+\nu=\eta$
and thus
 $(\mu',\nu')\in\mathcal{R}(\eta)$
. This contradicts the uniqueness of the representation
 $(\mu,\nu)$
and shows that
 $\mathrm{supp}(\eta)$
cannot contain an alternating cycle. By Theorem 1.4, this ends the proof.
Before the further combinatorial analysis, we need to introduce some useful auxiliary notation. For
 $\mu, \nu \in \mathcal{M}([0,1]^2)$
with
 $|\mathrm{supp}(\mu+\nu)|<\infty$
, we define a quotient function
 $q_{(\mu, \nu)}\colon \mathrm{supp}(\mu+\nu) \rightarrow [0,1]$
by
 \begin{align*}q_{(\mu, \nu)}(x,y)= \frac{\mu(x,y)}{\mu(x,y)+\nu(x,y)}.\end{align*}
In what follows, we omit the subscripts and write q for
 $q_{(\mu,\nu)}$
whenever the choice for
 $(\mu,\nu)$
is clear from the context.
Proposition 3.2. Let
 $\mu, \nu \in \mathcal{M}([0,1]^2)$
and
 $|\mathrm{supp}(\mu+\nu)|<\infty$
. Then
 $(\mu, \nu) \in \mathcal{R}$
if and only if the following conditions hold simultaneously:
-
for every x satisfying
$\mu(\{x\}\times[0,1])+\nu(\{x\}\times [0,1])>0$
, (3.1)
\begin{equation} \sum_{\substack{y\in[0,1],\\ (x,y)\in\mathrm{supp}(\mu+\nu)}}q(x,y) \frac{\mu(x,y)+\nu(x,y)}{\mu(\{x\}\times[0,1])+\nu(\{x\}\times [0,1])} = x; \end{equation}
-
for every y satisfying
$\mu([0,1]\times \{y\})+\nu([0,1]\times \{y\})>0$
, (3.2)
\begin{equation} \sum_{\substack{x\in[0,1],\\ (x,y)\in\mathrm{supp}(\mu+\nu)}}q(x,y) \frac{\mu(x,y)+\nu(x,y)}{\mu([0,1]\times \{y\})+\nu([0,1]\times \{y\})} = y, \end{equation}




where the sums in (3.1) and (3.2) are well defined—in both cases, there is only a finite number of nonzero summands.
Proof. Due to
 $|\mathrm{supp}(\mu+\nu)|<\infty$
, this is a simple consequence of Definition 1.1.
Next, we will require an additional distinction between three different types of points.
Definition 3.2. Let
 $(\mu, \nu)\in \mathcal{R}$
. A point
 $(x,y)\in \mathrm{supp}(\mu+\nu)$
is said to be
-
(i) a lower out point if
$q(x,y)< \min(x,y)$
; -
(ii) an upper out point if
$q(x,y)> \max(x,y)$
; -
(iii) a cut point if it is not an out point, i.e.
$x\leq(x,y)\le y$
or
$y\le q(x,y) \le x$
.




Finally, for the sake of completeness, we include a formal definition of an axial path.
Definition 3.3. The sequence
 $\big((x_i,y_i)\big)_{i=1}^{n}$
with terms in
 $[0,1]^2$
is called an axial path if all the points
 $(x_i, y_i)$
are distinct, and
 $x_{2i} = x_{2i+1}$
and
 $y_{2i-1} = y_{2i}$
or
 $y_{2i} = y_{2i+1}$
and
 $x_{2i-1} = x_{2i}$
, for all i.
To develop some intuition, it is convenient to inspect the following example.
Example 3.1. Let m be a probability measure given by
 \begin{align*} m\bigg(\frac{1}{8},\frac{1}{4}\bigg)=\frac{84}{196}, \qquad m\bigg(\frac{1}{2},\frac{1}{4}\bigg)=\frac{14}{196}, \qquad m\bigg(\frac{1}{2},\frac{3}{4}\bigg)=\frac{14}{196}, \qquad m\bigg(\frac{7}{8},\frac{3}{4}\bigg)=\frac{84}{196}. \end{align*}
There are five observations, which we discuss separately.
-
(i) Consider the decomposition
$m=\mu+\nu$
, where
$(\mu,\nu)$
is determined by the quotient function Using Proposition 3.2, we can check that
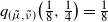
\begin{align*} q\bigg(\frac{1}{8},\frac{1}{4}\bigg)=\frac{1}{8}, \qquad q\bigg(\frac{1}{2},\frac{1}{4}\bigg)=1, \qquad q\bigg(\frac{1}{2},\frac{3}{4}\bigg)=0, \qquad q\bigg(\frac{7}{8},\frac{3}{4}\bigg)=\frac{7}{8}. \end{align*}
$(\mu,\nu)\in\mathcal{R}$
. For instance, for
$y=\frac{1}{4}$
we get (3.3)which agrees with (3.2). As a direct consequence, by Proposition 1.1, we have
\begin{equation} \frac{q\big(\frac{1}{8},\frac{1}{4}\big)\cdot m\big(\frac{1}{8},\frac{1}{4}\big) + q\big(\frac{1}{2},\frac{1}{4}\big)\cdot m\big(\frac{1}{2},\frac{1}{4}\big)} {m\big(\frac{1}{8}, \frac{1}{4}\big)+m\big(\frac{1}{2}, \frac{1}{4}\big)} = \frac{\frac{1}{8}\cdot \frac{84}{196}+1\cdot \frac{14}{196}}{\frac{84}{196}+\frac{14}{196}} = \frac{1}{4}, \end{equation}
$m\in \mathcal{C}$
.
-
(ii) Observe that
$\big(\frac{1}{8}, \frac{1}{4}\big)$
and
$\big(\frac{7}{8}, \frac{3}{4}\big)$
are cut points,
$\big(\frac{1}{2}, \frac{1}{4}\big)$
is an upper out point, and
$\big(\frac{1}{2}, \frac{3}{4}\big)$
is a lower out point. Moreover,
$\mathrm{supp}(m)$
is an axial path without cycles—see Figure 2.Figure 2.Support of a coherent distribution m. Purple points (endpoints of the path) are cut points. The red point represents a mass in
$\mathrm{supp}(\mu)$
and is an upper out point. The blue point indicates a mass in
$\mathrm{supp}(\nu)$
and it is a lower out point.


-
(iii) Notably,
$(\mu, \nu)$
is a unique representation of m. Indeed,
$\big(\frac{1}{8},\frac{1}{4}\big)$
is the only point in
$\mathrm{supp}(m)$
with x-coordinate equal to
$\frac{1}{8}$
and hence
$q\big(\frac{1}{8}, \frac{1}{4}\big)=\frac{1}{8}$
. Accordingly,
$q\big(\frac{1}{2}, \frac{1}{4}\big)=1$
is now a consequence of (3.3). The derivation of
$q\big(\frac{1}{2}, \frac{3}{4}\big)=0$
and
$q\big(\frac{7}{8}, \frac{3}{4}\big)=\frac{7}{8}$
follows from an analogous computation. -
(iv) Finally, the representation
$(\mu, \nu)$
is minimal; let
$(\tilde{\mu},\tilde{\nu})\in\mathcal{R}$
satisfy
$\tilde{\mu}\le\mu$
and
$\tilde{\nu}\le\nu$
. Suppose that
$\big(\frac{1}{8}, \frac{1}{4}\big)\in \mathrm{supp}(\tilde{\mu}+\tilde{\nu})$
. Again, as
$\big(\frac{1}{8}, \frac{1}{4}\big)$
is the only point in
$\mathrm{supp}(m)$
with x-coordinate equal to
$\frac{1}{8}$
, we get
$q_{(\tilde{\mu},\tilde{\nu})}\big(\frac{1}{8},\frac{1}{4}\big)=\frac{1}{8}$
. Next, assume that
$\big(\frac{1}{2}, \frac{1}{4}\big)\in \mathrm{supp}(\tilde{\mu}+\tilde{\nu})$
. As
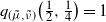
$\tilde{\nu}\big(\frac{1}{2}, \frac{1}{4}\big) \le \nu\big(\frac{1}{2}, \frac{1}{4}\big)=0$
, we have
$q_{(\tilde{\mu},\tilde{\nu})}\big(\frac{1}{2}, \frac{1}{4}\big)=1$
. Likewise, we can check that
$q_{(\tilde{\mu},\tilde{\nu})}(x,y) = q_{(\mu, \nu)}(x,y)$
for all
$(x,y)\in \mathrm{supp}(\tilde{\mu}+\tilde{\nu})$
. From this and Proposition 3.2, we easily obtain that
$\tilde{\mu} +\tilde{\nu}=0$
or
$\mathrm{supp}(\tilde{\mu}+\tilde{\nu})=\mathrm{supp}(m)$
. For example,-
if
$\big(\frac{1}{2}, \frac{1}{4}\big)\in \mathrm{supp}(\tilde{\mu}+\tilde{\nu})$
, then (3.1) gives
$\big(\frac{1}{2}, \frac{3}{4}\big) \in \mathrm{supp}(\tilde{\mu}+\tilde{\nu})$
; -
if
$\big(\frac{1}{2}, \frac{3}{4}\big)\in \mathrm{supp}(\tilde{\mu}+\tilde{\nu})$
, then (3.2) yields
$\big(\frac{7}{8}, \frac{3}{4}\big) \in \mathrm{supp}(\tilde{\mu}+\tilde{\nu})$
.
Therefore, if
$\tilde{\mu}+\tilde{\nu}\not=0$
, then the measure
$\tilde{\mu}+\tilde{\nu}$
is supported on the same set as m and
$q_{(\tilde{\mu},\tilde{\nu})} \equiv q_{(\mu, \nu)}$
. For the same reason, i.e. using Proposition 3.2 and the path structure of
$\mathrm{supp}(m)$
, it follows that
$\tilde{\mu}+ \tilde{\nu} = \alpha \cdot m$
for some
$\alpha \in [0,1]$
. For instance, by (3.2) for
$y=\frac{1}{4}$
, we get where
\begin{align*} \frac{\frac{1}{8}\cdot\tilde{m}\big(\frac{1}{8},\frac{1}{4}\big) + 1\cdot\tilde{m}\big(\frac{1}{2}, \frac{1}{4}\big)} {\tilde{m}\big(\frac{1}{8},\frac{1}{4}\big) + \tilde{m}\big(\frac{1}{2},\frac{1}{4}\big)} = \frac{1}{4}, \end{align*}
$\tilde{m}= \tilde{\mu}+\tilde{\nu}.$
Hence
$\tilde{m}\big(\frac{1}{8}, \frac{1}{4}\big)\tilde{m}\big(\frac{1}{2},\frac{1}{4}\big)^{-1} = m\big(\frac{1}{8}, \frac{1}{4}\big)m\big(\frac{1}{2}, \frac{1}{4}\big)^{-1}=\frac{84}{14}$
.
-


















-
(v) By the above analysis and Theorem 1.4, we conclude that
$m\in\mathrm{ext}_\mathrm{f}(\mathcal{C})$
.

To clarify the main reasoning, we first record an obvious geometric lemma.
Lemma 3.1. Let
 $\big((x_i,y_i)\big)_{i=1}^{n}$
be an axial path without cycles.
-
(i) If
$x_{n-1}=x_n$
(or
$y_{n-1}=y_n$
), then
$y_n \not= y_j$
(or
$x_n\not = x_j$
) for all
$j<n$
. -
(ii) For every
$x,y \in [0,1]$
,
$\max\{|\{i\colon x_i=x\}|,\,|\{j\colon y_j=y\}|\} < 3$
.



Proof. Part (i) can be verified by induction. Part (ii) follows from (i).
We are now ready to demonstrate the central result of this section.
Theorem 3.1. If
 $\eta \in \mathrm{ext}_\mathrm{f}(\mathcal{C})$
, then
 $\mathrm{supp}(\eta)$
is an axial path without cycles.
Let us briefly explain the main idea of the proof. For
 $\eta \in \mathrm{ext}_\mathrm{f}(\mathcal{C})$
, we inductively construct a special axial path contained in
 $\mathrm{supp}(\eta)$
, which does not contain any cut points (apart from the endpoints). We show that the axial path obtained in this process is acyclic and involves all the points from
 $\mathrm{supp}(\eta)$
.
Proof of Theorem 3.1. Fix
 $\eta \in \mathrm{ext}_\mathrm{f}(\mathcal{C})$
and let
 $(\mu, \nu)$
be the unique representation of
 $\eta$
. By
 $\mathcal{L}(\eta)$
and
 $\mathcal{U}(\eta)$
denote the sets of lower and upper out points. Choose any
 $(x_0,y_0)\in \mathrm{supp}(\eta)$
. We consider two separate cases.
Case I:
 $(x_0, y_0)$
is an out point. With no loss of generality, we can assume that
 $(x_0, y_0) \in \mathcal{L}(\eta)$
. We then use the following inductive procedure.
-
(i) Suppose we have successfully found
$(x_n, y_n)\in \mathcal{L}(\eta)$
and it is the first time we have chosen a point with the x-coordinate equal to
$x_n$
. Since
$(x_n,y_n)\in\mathcal{L}(\eta)$
, we have
$q(x_n, y_n)<x_n$
. By (3.1), there must exist a point
$(x_{n+1},y_{n+1})\in \mathrm{supp}(\eta)$
such that
$x_{n+1}=x_n$
and
$q(x_{n+1}, y_{n+1})>x_n$
. We pick one such point and add it at the end of the path. If
$(x_{n+1}, y_{n+1})$
is a cut point or an axial cycle was just created, we exit the loop. Otherwise, note that
$(x_{n+1},y_{n+1})\in\mathcal{U}(\eta)$
and
$y_{n+1}\not=y_j$
for all
$j<n+1$
(by Lemma 3.1(i)). Go to (ii). -
(ii) Assume we have successfully found
$(x_n, y_n)\in \mathcal{U}(\eta)$
and it is the first time we have chosen a point with the y-coordinate equal to
$y_n$
. Since
$(x_n, y_n)\in \mathcal{U}(\eta)$
, we have
$q(x_n, y_n)>y_n$
. By (3.2), there must exist a point
$(x_{n+1},y_{n+1})\in \mathrm{supp}(\eta)$
such that
$y_{n+1}=y_n$
and
$q(x_{n+1}, y_{n+1})<y_n$
. We pick one such point and add it at the end of the path. If
$(x_{n+1}, y_{n+1})$
is a cut point or an axial cycle was just created, we exit the loop. Otherwise, note that
$(x_{n+1},y_{n+1})\in\mathcal{L}(\eta)$
and
$x_{n+1}\not=x_j$
for all
$j<n+1$
(by Lemma 3.1(i)). Go to (i).
















As
 $|\mathrm{supp}(\eta)|<\infty$
, the procedure terminates after a finite number of steps (denote it by k) and produces an axial path
 $\big((x_i,y_i)\big)_{i=0}^{k}$
contained in
 $\mathrm{supp}(\eta)$
. Notice that it is possible that
 $(x_k,y_k)$
is a third point on some horizontal or vertical line—in such a case, by Lemma 3.1(ii), the sequence
 $\big((x_i,y_i)\big)_{i=0}^{k}$
contains an axial cycle. Now, by the construction of the loop, point
 $(x_k, y_k)$
is either an endpoint of an axial cycle or a cut point. Let us show that the first alternative is impossible. First, we clearly have
 $\mathcal{L}(\eta)\subset\mathrm{supp}(\nu)$
and
 $\mathcal{U}(\eta)\subset\mathrm{supp}(\mu)$
(see Figure 3). Next, assume that
 $(x_{k-1}, y_{k-1})\in \mathcal{U}(\eta)$
. This means that
 $(x_k, y_k)$
was found in step (ii) and
 $q(x_k, y_k)<y_{k-1}\le 1$
. Therefore
 $(x_k, y_k)\in \mathrm{supp}(\nu)$
and there exists an alternating cycle in
 $\mathrm{supp}(\eta)$
. However, this is not possible because of Proposition 3.1. If
 $(x_{k-1}, y_{k-1})\in \mathcal{L}(\eta)$
, the argument is analogous.
An example of an axial path constructed by the algorithm. The symbols
 $\vee, \wedge$
are placed next to lower (
 $\vee$
) and upper (
 $\wedge$
) out points. The purple point
 $(x_k, y_k)$
is the endpoint of the path. The red points represent probability masses in
 $\mathrm{supp}(\mu)$
, while the blue points indicate probability masses in
 $\mathrm{supp}(\nu)$
.

We have shown that
 $(x_{k}, y_k)$
is a cut point. Set
 $\Gamma_+=\bigcup_{i=1}^k\{(x_i,y_i)\}$
. Moving on, we can return to the starting point
 $(x_0,y_0)$
and repeat the above construction in the reverse direction. By switching the roles of the x- and y-coordinates in steps (i) and (ii), we produce another axial path
 $(x_i,y_i)_{i=0}^{-l}$
. Set
 $\Gamma_-=\bigcup_{i=-1}^{-l}\{(x_i,y_i)\}$
and
 $\Gamma = \Gamma_+ \cup \{(x_0,y_0)\} \cup \Gamma_-$
. Repeating the same arguments as before, we show that
 $(x_{-l}, y_{-l})$
is a cut point and
 $\Gamma$
is an axial path without cycles (see Figure 4).
It remains to verify that
 $\mathrm{supp}(\eta)=\Gamma$
. This is accomplished by showing that there exists
 $(\tilde{\mu}, \tilde{\nu})\in \mathcal{R}$
with
 $\tilde{\mu}\le \mu$
,
 $\tilde{\nu}\le \nu$
, and
 $\mathrm{supp}(\tilde{\mu}+\tilde{\nu})=\Gamma$
. This will give the claim: by the minimality of the representation
 $(\mu, \nu)$
, we deduce that
 $\tilde{\mu}+ \tilde{\nu} = \alpha \cdot \eta$
for some
 $\alpha \in (0,1]$
, and hence
 $\mathrm{supp}(\tilde{\mu}+\tilde{\nu})=\mathrm{supp}(\eta)$
.
An example of an axial path
 $\Gamma$
constructed after the second run of the algorithm. The purple points
 $(x_k, y_k)$
and
 $(x_{-l}, y_{-l})$
(endpoints of
 $\Gamma$
) are cut points. The red points represent probability masses in
 $\mathrm{supp}(\mu)$
, while the blue points indicate probability masses in
 $\mathrm{supp}(\nu)$
.

We begin with the endpoints of
 $\Gamma$
. As
 $(x_k, y_k)$
is a cut point, there exists
 $\gamma \in [0,1]$
such that
 $q(x_k, y_k)=\gamma x_k + (1-\gamma)y_k$
. We can write
 \begin{equation} \eta(x_k, y_k) = \eta'(x_k, y_k) + \eta''(x_k, y_k), \end{equation}
where
 $\eta'(x_k, y_k)=\gamma\eta(x_k, y_k)$
and
 $\eta''(x_k, y_k)=(1-\gamma)\eta(x_k, y_k)$
. Set
 \begin{equation} \mu'(x_k, y_k) = x_k\eta'(x_k, y_k), \qquad \mu''(x_k, y_k)=y_k\eta''(x_k, y_k). \end{equation}
 \begin{equation} \mu'(x_k, y_k)+\mu''(x_k, y_k) = (x_k\gamma+y_k(1-\gamma))\eta(x_k,y_k) = \mu(x_k, y_k). \end{equation}
Equations (3.4) and (3.6) have a clear and convenient interpretation. Namely, we can visualize it as ‘cutting’ the point
 $(x_k, y_k)$
into two separate points:
 $(x_k, y_k)'$
with mass
 $\eta'(x_k, y_k)$
and
 $(x_k, y_k)''$
with mass
 $\eta''(x_k, y_k)$
. Moreover, calculating their quotient functions independently, we get
 $q'(x_k, y_k)=x_k$
and
 $q''(x_k, y_k)=y_k$
. Performing the same ‘cut’ operation on
 $(x_{-l}, y_{-l})$
we can divide this point into
 $(x_{-l}, y_{-l})'$
and
 $(x_{-l}, y_{-l})''$
such that
 $q'(x_{-l}, y_{-l})=x_{-l}$
and
 $q''(x_{-l}, y_{-l})=y_{-l}$
.
Observe that
 $(x_k,y_k)$
and
 $(x_{k-1},y_{k-1})$
have exactly one common coordinate, say
 $y_k=y_{k-1}$
. Consequently,
 $(x_k, y_k)$
is the only point in
 $\Gamma$
with x-coordinate equal to
 $x_k$
. Additionally, by (3.2) and
 $(x_{k-1}, y_{k-1}) \in \mathcal{U}(\eta)$
, this means that
 $q(x_k, y_k)\not=y_{k}$
and
 $\gamma>0$
. Hence
 $\eta'(x_k, y_k)>0$
. Similarly, suppose that
 $y_{-l}=y_{-l+1}$
(as presented in Figure 4; for other configurations of endpoints, we proceed by analogy). Thus,
 $(x_{-l}, y_{-l})$
is the only point in
 $\Gamma$
with x-coordinate equal to
 $x_{-l}$
. By (3.2) and
 $(x_{-l+1}, y_{-l+1}) \in \mathcal{L}(\eta)$
, we have
 $\eta'(x_{-l}, y_{-l})>0$
.
Next, consider the function
 $\tilde{q}\colon\Gamma \rightarrow [0,1]$
uniquely determined by the following requirements:
-
$\tilde{q}(x_k, y_k)=x_k$
(if
$y_k=y_{k-1}$
, as we have assumed) or
$\tilde{q}(x_k, y_k)=y_k$
(in the case when
$x_k=x_{k-1}$
);
-
$\tilde{q}(x_{-l}, y_{-l})=x_{-l}$
(if
$y_{-l}=y_{-l+1}$
, as we have assumed) or
$\tilde{q}(x_{-l}, y_{-l})=y_{-l}$
(in the case when
$x_{-l}=x_{-l+1}$
);
-
$\tilde{q}(x,y)=0$
for all
$(x,y)\in \Gamma \cap \mathcal{L}(\eta)$
;
-
$\tilde{q}(x,y)=1$
for all
$(x,y)\in \Gamma \cap \mathcal{U}(\eta)$
.










Set
 $\delta=\min(a,b,c,d)$
, where
 $a = \eta'(x_k, y_k)$
(if
 $y_k=y_{k-1}$
) or
 $a = \eta''(x_k, y_k)$
(if
 $x_{k}=x_{k-1}$
),
 $b = \eta'(x_{-l}, y_{-l})$
(if
 $y_{-l}=y_{-l+1}$
) or
 $b=\eta''(x_{-l}, y_{-l})$
(if
 $x_{-l}=x_{-l+1}$
),
 $c = \min_{(x,y)\in\Gamma\cap\mathcal{L}(\eta)}\nu(x,y)$
,
 $d = \min_{(x,y)\in\Gamma\cap\mathcal{U}(\eta)}\mu(x,y).$
Then
 $\delta>0$
, which follows from the previous discussion. Finally, using the acyclic path structure of
 $\Gamma$
and Proposition 3.2 (just as in Example 3.1), we are able to find a pair
 $(\tilde{\mu}, \tilde{\nu})\in \mathcal{R}$
with
 $\mathrm{supp}(\tilde{\mu}+\tilde{\nu})=\Gamma$
and a quotient function
 $q_{(\tilde{\mu}, \tilde{\nu})}=\tilde{q}$
. Letting
 $\beta = \delta\cdot(\max_{(x,y)\in \Gamma}(\tilde{\mu}+\tilde{\nu})(x,y))^{-1}$
, we see that
 $\beta\tilde{\mu} \le \mu$
and
 $\beta\tilde{\nu} \le \nu$
, as desired.
Case II:
 $(x_0, y_0)$
is a cut point. Suppose that
 $x_0=y_0$
and
 $q(x_0, x_0)=x_0$
. Put
 $\tilde{\mu} = \textbf{1}_{\{(x_0, x_0)\}} x_0 \eta(x_0, y_0)$
and
 $\tilde{\nu}=\textbf{1}_{\{(x_0, x_0)\}}(1-x_0)\eta(x_0, y_0)$
. We have
 $(\tilde{\mu}, \tilde{\nu})\in \mathcal{R}$
and
 $\tilde{\mu}\le \mu$
,
 $\tilde{\nu}\le \nu$
. Hence
 $\mathrm{supp}(\eta)=\{(x_0, x_0)\}$
. Next, assume that
 $x_0\not=y_0$
. In that case,
 $q(x_0, y_0)$
cannot be equal to both
 $x_0$
and
 $y_0$
at the same time and we can clearly apply the same recursive procedure as in Case I. For example, let us assume that
 $q(x_0, y_0)<x_0$
. Although
 $(x_0, y_0) \not \in \mathcal{L}(\eta)$
, by (3.1) there still must exist a point
 $(x_{1},y_{1})\in \mathrm{supp}(\eta)$
such that
 $x_{1}=x_0$
and
 $q(x_{1}, y_{1})>x_0$
. If
 $(x_1, y_1)$
is not a cut point, then
 $(x_1, y_1)\in \mathcal{U}(\eta)$
and we can go to (ii). The procedure now continues without any further changes. The details of the proof remain the same as in Case I.
From the proof provided, we can deduce yet another conclusion.
Corollary 3.1. If
 $\eta \in \mathrm{ext}_\mathrm{f}(\mathcal{C})$
, then
 $q(x,y)=0$
for all
 $(x,y)\in\mathcal{L}(\eta)$
and
 $q(x,y)=1$
for all
 $(x,y)\in\mathcal{U}(\eta)$
. Except for the endpoints of this axial path (which are cut points),
 $\mathrm{supp}(\eta)$
consists of lower and upper out points, appearing alternately.
Proof. Note that
 $\mathcal{L}(\eta)$
and
 $\mathcal{U}(\eta)$
are well defined as the representation of
 $\eta$
is unique. The statement follows directly from the proof of Theorem 3.1.
4. Asymptotic estimate
Equipped with the machinery developed in the previous sections, we are ready to establish the asymptotic estimate (1.3). We need to clarify how the properties of
 $\mathrm{ext}_\mathrm{f}(\mathcal{C})$
covered in the preceding part apply to this problem. Referring to the prior notation, we will write
 $(X, Y) \in \mathcal{C}_\mathrm{f}$
or
 $(X, Y) \in \mathrm{ext}_\mathrm{f}(\mathcal{C})$
to indicate that the distribution of a random vector (X, Y) is a coherent (or an extremal coherent) measure with finite support.
Proposition 4.1. For any
 $\alpha>0$
,
 $\sup_{(X,Y)\in\mathcal{C}}\mathbb{E}|X-Y|^{\alpha} = \sup_{(X,Y)\in\mathcal{C}_\mathrm{f}}\mathbb{E}|X-Y|^{\alpha}$
.
Proof. Fix any
 $(X,Y)\in \mathcal{C}$
. As shown in [Reference Burdzy and Pal5, Reference Cichomski7], there exists a sequence
 $(X_n,Y_n)\in \mathcal{C}_f$
such that
 $X_n$
,
 $Y_n$
each take at most n different values and
 \begin{equation*} \max\{|X-X_n|,|Y-Y_n|\} \le \frac{1}{n} \qquad \mbox{for all}\ n=1,2,\ldots \end{equation*}
almost surely. Consequently, by dominated convergence and the previous inequality, we obtain
 \begin{align*}\mathbb{E}|X-Y|^{\alpha} = \lim_{n \rightarrow \infty} \mathbb{E}|X_n-Y_n|^{\alpha},\end{align*}
and thus
 \begin{align*}\mathbb{E}|X-Y|^{\alpha} \le \sup_{n\in \mathbb{N}}\mathbb{E}|X_n-Y_n|^{\alpha} \le \sup_{(X,Y)\in \mathcal{C}_f} \mathbb{E}|X-Y|^{\alpha}.\end{align*}
This proves the ‘
 $\le$
’ inequality, while in the reverse direction it is obvious.
Next, we will apply the celebrated Krein–Milman theorem, see [Reference Rudin18].
Theorem 4.1. (Krein—Milman.) A compact convex subset of a Hausdorff locally convex topological vector space is equal to the closed convex hull of its extreme points.
The above statement enables us to restrict the analysis of the estimate in (1.3) to extremal measures. Precisely, we have the following statement.
Proposition 4.2. For any
 $\alpha>0$
,
 $\sup_{(X,Y)\in\mathcal{C}_\mathrm{f}}\mathbb{E}|X-Y|^{\alpha} = \sup_{(X,Y)\in\mathrm{ext}_\mathrm{f}(\mathcal{C})}\mathbb{E}|X-Y|^{\alpha}$
.
Proof. Let
 $Z=C([0,1]^2, \mathbb{R})$
; then
 $Z^*$
is the space of finite signed Borel measures with the total variation norm
 $\| \cdot \|_{\mathrm{TV}}$
. Let us equip
 $Z^*$
with the topology of weak
 $^*$
convergence. Under this topology,
 $Z^*$
is a Hausdorff and a locally convex space. For a fixed
 $m\in \mathcal{C}_\mathrm{f}$
, let
 $\mathcal{C}_m = \{m'\in \mathcal{C}_\mathrm{f}\colon\mathrm{supp}(m')\subseteq\mathrm{supp}(m)\}$
denote the family of coherent distributions supported on the subsets of
 $\mathrm{supp}(m)$
. First, observe that
 $\mathcal{C}_m$
is convex. Second, we can easily verify that
 $\mathrm{ext}(\mathcal{C}_m)=\mathcal{C}_m\cap \mathrm{ext}_\mathrm{f}(\mathcal{C})$
. Plainly, if
 $m'\in \mathcal{C}_m$
and
 $m'=\alpha\cdot m_1 + (1-\alpha)\cdot m_2$
for some
 $\alpha\in (0,1)$
and
 $m_1, m_2 \in \mathcal{C}$
, then
 $\mathrm{supp}(m')= \mathrm{supp}(m_1) \cup \mathrm{supp}(m_2)$
and we must have
 $m_1, m_2 \in \mathcal{C}_m$
. Hence
 $\mathrm{ext}(\mathcal{C}_m)\subset \mathrm{ext}_\mathrm{f}(\mathcal{C})$
, whereas
 $\mathrm{ext}_\mathrm{f}(\mathcal{C})\cap \mathcal{C}_m \subset \mathrm{ext}(\mathcal{C}_m)$
is obvious.
Moreover, we claim that
 $\mathcal{C}_m$
is compact in the weak
 $^*$
topology. Indeed, by the Banach–Alaoglu theorem,
 $B_{Z^*} = \{\mu \in Z^*\colon\|\mu\|_{\mathrm{TV}}\le 1\}$
is weak
 $^*$
compact. As
 $\mathcal{C}_m\subset B_{Z^{*}}$
, it remains to check that
 $\mathcal{C}_m$
is weak
 $^*$
closed. We can write
 $\mathcal{C}_m=\mathcal{C}\cap \mathcal{P}_m$
, where
 $\mathcal{P}_m$
stands for the set of all probability measures supported on the subsets of
 $\mathrm{supp}(m)$
. Note that
 $\mathcal{P}_m$
is clearly weak
 $^*$
closed. Lastly, coherent distributions on
 $[0,1]^2$
are also weak
 $^*$
closed, as demonstrated in [Reference Burdzy and Pitman6].
Thus, by the Krein–Milman theorem, there exists a sequence
 $(m_n)_{n=1}^{\infty}$
with values in
 $\mathcal{C}_m$
satisfying
 \begin{equation} m_n = \beta_1^{(n)}\eta_1^{(n)}+\beta_2^{(n)}\eta_2^{(n)}+\dots +\beta_{k_n}^{(n)}\eta_{k_n}^{(n)}, \end{equation}
where
 $\eta_{1}^{(n)}, \dots, \eta_{k_n}^{(n)} \in \mathrm{ext}(\mathcal{C}_m)$
and
 $\beta_{1}^{(n)}, \dots, \beta_{k_n}^{(n)}$
are positive numbers summing to 1 such that
 \begin{equation} \int_{[0,1]^2}f\,\mathrm{d}m_n \longrightarrow \int_{[0,1]^2}f\,\mathrm{d}m \end{equation}
for all bounded, continuous functions
 $f\colon[0,1]^2\rightarrow\mathbb{R}$
. Put
 $f(x,y)=|x-y|^{\alpha}$
. By (4.2) and (4.1), we have
 \begin{align*} \int_{[0,1]^2}|x-y|^{\alpha}\,\mathrm{d}m & \le \sup_{n\in\mathbb{N}}\int_{[0,1]^2}|x-y|^{\alpha}\,\mathrm{d}m_n \\[5pt] & \le \sup_{\substack{n\in\mathbb{N},\\ 1\le i\le k_n}}\int_{[0,1]^2}|x-y|^{\alpha}\,\mathrm{d}\eta_i^{(n)} \\[5pt] & \le \sup_{\eta\in\mathrm{ext}_\mathrm{f}(\mathcal{C})}\int_{[0,1]^2}|x-y|^{\alpha}\,\mathrm{d}\eta, \end{align*}
and hence
 $\sup_{(X,Y)\in\mathcal{C}_\mathrm{f}}\mathbb{E}|X-Y|^{\alpha} \le \sup_{(X,Y)\in\mathrm{ext}_\mathrm{f}(\mathcal{C})}\mathbb{E}|X-Y|^{\alpha}.$
The reverse inequality is clear.
Now we have the following significant reduction. Denote by
 $\mathcal{S}$
the family of all finite sequences
 $\textbf{z}=(z_0, z_1, \dots, z_{n+1})$
,
 $n\in \mathbb{N}$
, with
 $z_0=z_{n+1}=0$
,
 $\sum_{i=1}^n z_i=1$
, and
 $z_i>0$
for
 $i=1,2,\dots, n$
. We emphasise that
 $n=n(\textbf{z})$
, the length of
 $\textbf{z}$
, is also allowed to vary. In what follows, we write n instead of
 $n(\textbf{z})$
; this should not lead to any confusion.
Proposition 4.3. For any
 $\alpha \ge 1$
,
 \begin{equation} \sup_{(X,Y)\in\mathrm{ext}_\mathrm{f}(\mathcal{C})}\mathbb{E}|X-Y|^{\alpha} = \sup_{{\textbf{z}\in\mathcal{S}}}\sum_{i=1}^{n}z_i\bigg|\frac{z_i}{z_{i-1}+z_i}-\frac{z_i}{z_i+z_{i+1}}\bigg|^{\alpha}. \end{equation}
Proof. Consider an arbitrary
 $\eta \in \mathrm{ext}_\mathrm{f}(\mathcal{C})$
and let
 $(\mu, \nu)$
be its unique representation. Recall, based on Theorem 3.1, that
 $\mathrm{supp}(\eta)$
is an axial path without cycles. Set
 $\mathrm{supp}(\eta)=\{(x_i, y_i \}_{i=1}^n$
and let
 $q\colon\mathrm{supp}(\eta)\rightarrow[0,1]$
be the quotient function associated with
 $(\mu,\nu)$
. In this setup, by (3.1) and (3.2), we can write
 \begin{equation} \int_{[0,1]^2}|x-y|^{\alpha}\,\mathrm{d}\eta = \sum_{i=1}^n z_i\bigg|\frac{q_{i-1}z_{i-1}+q_iz_i}{z_{i-1}+z_i}-\frac{q_iz_i+q_{i+1}z_{i+1}}{z_i+z_{i+1}}\bigg|^{\alpha}, \end{equation}
where
 $z_0=z_{n+1}=0$
,
 $q_0=q_{n+1}=0$
, and
 $q_i=q(x_i, y_i)$
,
 $z_i=\eta(x_i, y_i)$
for all
 $i=1,\,2,\,\dots,n$
. Note that if
 $n=1$
, then both sides of (4.4) are equal to zero; hence
 $\eta$
does not bring any contribution to (4.3). Hence, from now on, we will assume that
 $n\geq 2$
. Notice that by Corollary 3.1, the sequence
 $(q_1, q_2, \dots, q_n)$
is given by
 $(q_1, 0, 1, 0, 1, \dots, q_n)$
or
 $(q_1, 1, 0, 1, 0, \dots, q_n)$
; except for
 $q_1$
and
 $q_n$
,
 $(q_2, \dots, q_{n-1})$
is simply an alternating binary sequence. Furthermore, the right-hand side of (4.4) is the sum of
 \begin{equation*} P(q_1) \;:\!=\; z_1\bigg|q_1-\frac{q_1z_1+q_{2}z_{2}}{z_1+z_{2}}\bigg|^{\alpha} + z_2\bigg|\frac{q_{1}z_{1}+q_2z_2}{z_{1}+z_2}-\frac{q_2z_2+q_{3}z_{3}}{z_2+z_{3}}\bigg|^{\alpha} \end{equation*}
and some other terms not involving
 $q_1$
. Since
 $\alpha \ge1$
, P is a convex function on [0, 1] and hence it is maximized by some
 $q'_{\!\!1}\in \{0,1\}$
; in the case of
 $P(0)=P(1)$
, we choose
 $q'_{\!\!1}$
arbitrarily. Depending on
 $q'_{\!\!1}$
, we now perform one of the following transformations
 $(q, z) \mapsto (\tilde{q}, \tilde{z})$
:
-
If
$q'_{\!\!1}\not=q_2$
, we let
$\tilde{n}=n$
,
$\tilde{q}_1=q'_{\!\!1}$
,
$\tilde{q}_i=q_i$
for
$i \in \{0\} \cup \{2,3,\dots, n+1\}$
, and
$\tilde{z}_i=z_i$
for
$i \in \{0,1,\dots, n+1\}$
. This operation only changes
$q_1$
into
$q'_{\!\!1}$
—we increase the right-hand side of (4.4) by ‘correcting’ the quotient function on the first atom. -
If
$q'_{\!\!1}=q_2$
, we take
$\tilde{n}=n-1$
,
$\tilde{q}_0=0$
,
$\tilde{z}_0=0$
, and This modification removes the first atom and rescales the remaining ones. It is easy to see that for the transformed sequences
\begin{align*}\tilde{q}_i=q_{i+1}, \quad \tilde{z}_i=\frac{z_{i+1}}{z_2+z_3+\ldots+z_n} \qquad \mbox{ for } i \in \{1,2,\dots, \tilde{n}+1\}.\end{align*}
$(\tilde{q},\tilde{z})$
, the right-hand side of (4.4) does not decrease.





Performing a similar transformation for the last summand in (4.4) (depending on
 $q_n'$
and
 $q_{n-1}$
) we obtain a pair of sequences
 $(\tilde{q}, \tilde{z})$
such that
 $(\tilde{q}_1, \dots, \tilde{q}_{\tilde{n}})$
is an alternating binary sequence and
 \begin{align*} \int_{[0,1]^2}|x-y|^{\alpha}\,\mathrm{d}\eta & \le \sum_{i=1}^{\tilde{n}}\tilde{z}_i \bigg|\frac{\tilde{q}_{i-1}\tilde{z}_{i-1}+\tilde{q}_i\tilde{z}_i}{\tilde{z}_{i-1}+\tilde{z}_i} - \frac{\tilde{q}_i\tilde{z}_i+\tilde{q}_{i+1}\tilde{z}_{i+1}}{\tilde{z}_i+\tilde{z}_{i+1}}\bigg|^{\alpha} \\[5pt] & = \sum_{i=1}^{\tilde{n}}\tilde{z}_i\bigg|\frac{\tilde{z}_i}{\tilde{z}_{i-1}+\tilde{z}_i} - \frac{\tilde{z}_i}{\tilde{z}_i+\tilde{z}_{i+1}}\bigg|^{\alpha} \\[5pt] & \le \sup_{\tilde{\textbf{z}}}\sum_{i=1}^{n}z_i\bigg|\frac{z_i}{z_{i-1}+z_i}-\frac{z_i}{z_i+z_{i+1}}\bigg|^{\alpha}, \end{align*}
which proves the inequality ‘
 $\le$
’ in (4.3). The reverse bound follows by a straightforward construction involving measures with quotient functions equal to 0 or 1; see (4.4).
We require some further notation. Given
 $\alpha>0$
, let
 $\Phi_{\alpha}\colon\mathcal{S}\rightarrow [0,1]$
be defined by
 \begin{align*}\Phi_{\alpha}(z) = \sum_{i=1}^{n} z_i\bigg|\frac{z_i}{z_{i-1}+z_i}-\frac{z_i}{z_i+z_{i+1}}\bigg|^{\alpha}.\end{align*}
By the preceding discussion, for
 $\alpha\ge 1$
we have
 $\sup_{(X,Y)\in \mathcal{C}}\mathbb{E}|X-Y|^{\alpha} = \sup_{z\in \mathcal{S}}\Phi_{\alpha}(z)$
, and our main problem amounts to the identification of
 \begin{equation} \limsup_{\alpha\to\infty}\bigg[\alpha\cdot\sup_{z\in\mathcal{S}}\Phi_{\alpha}(z)\bigg].\end{equation}
It will later become clear that
 $\limsup$
in (4.5) can be replaced by an ordinary limit. We begin by making some introductory observations.
Definition 4.1. Fix
 $\alpha\ge 1$
and let
 $\textbf{z}=(z_0, z_1, \dots, z_{n+1})$
be a generic element of
 $\mathcal{S}$
. For
 $1\le i \le n$
, we say that the term (component)
 $z_i$
of
 $\textbf{z}$
is significant if
 $\sqrt{\alpha} \cdot z_{i-1} < z_i$
and
 $\sqrt{\alpha} \cdot z_{i} < z_{i+1}$
, or
 $z_{i-1} > \sqrt{\alpha} \cdot z_i$
and
 $z_{i} > \sqrt{\alpha} \cdot z_{i+1}$
. The set of all significant components of z will be denoted by
 $\phi_\alpha(z)$
. Whenever a component
 $z_i$
of
 $\textbf{z}$
(
 $1\le i \le n$
) is not significant, we say that
 $z_i$
is negligible. The terms
 $z_0$
and
 $z_{n+1}$
will be treated as neither significant nor negligible.
Now we will show that the contribution of all negligible terms of z to the total sum
 $\Phi_{\alpha}(z)$
vanishes in the limit
 $\alpha\to \infty$
. Precisely, we have the following.
Proposition 4.4. For
 $\alpha\ge1$
and
 $z\in \mathcal{S}$
,
 \begin{align*}\Phi_{\alpha}(z) \le \Psi_{\alpha}(z) + \bigg|1-\frac{1}{1+\sqrt{\alpha}\,}\bigg|^{\alpha},\end{align*}
where
 $\Psi_{\alpha}\colon\mathcal{S}\rightarrow [0,1]$
is defined by
 \begin{align*}\Psi_{\alpha}(z) = \sum_{z_i\in\phi_{\alpha}(z)}z_i\bigg|\frac{z_i}{z_{i-1}+z_i}-\frac{z_i}{z_i+z_{i+1}}\bigg|^{\alpha}.\end{align*}
Proof. Since
 $z_1+z_2+\dots+z_n=1$
, it is sufficient to show that
 \begin{equation*} \bigg|\frac{z_i}{z_{i-1}+z_i}-\frac{z_i}{z_i+z_{i+1}}\bigg| \le \bigg|1-\frac{1}{1+\sqrt{\alpha}\,}\bigg| \end{equation*}
for all negligible components
 $z_i$
. Assume it does not hold. Since the ratios
 $z_i/(z_{i-1}+z_i)$
and
 $z_{i+1}/(z_i+z_{i+1})$
take values in [0, 1], we must have
 \begin{equation*} \min\bigg\{\frac{z_i}{z_{i-1}+z_i},\frac{z_i}{z_i+z_{i+1}}\bigg\} < \frac{1}{1+\sqrt{\alpha}\,}, \qquad \max\bigg\{\frac{z_i}{z_{i-1}+z_i},\frac{z_i}{z_i+z_{i+1}}\bigg\} > \frac{\sqrt{\alpha}}{1+\sqrt{\alpha}\,}. \end{equation*}
It remains to note that component
 $z_i$
fulfilling these two inequalities is significant.
It is also useful to consider some special arrangements consisting of three successive components
 $(z_{i-1}, z_i, z_{i+1})$
of the generic sequence
 $z\in \mathcal{S}$
.
Definition 4.2. Let
 $\textbf{z} = (z_0, z_1, \dots, z_{n+1})$
be an element of
 $\mathcal{S}$
. For
 $1\le i \le n$
, we say that a subsequence
 $(z_{i-1}, z_i, z_{i+1})$
of
 $\textbf{z}$
is
-
a split if
$z_{i-1} > z_i < z_{i+1}$
; -
a peak if
$z_{i-1}<z_i>z_{i+1}$
.


In what follows, let
 $\mathcal{S}'$
be the subset of all those
 $z\in \mathcal{S}$
that satisfy:
-
(1)
$z_{i-1}\not= z_i$
for all
$i\in \{1,2,\dots,n+1\}$
. -
(2) There are no split subsequences in z.
-
(3) There is exactly one peak in z.
-
(4) There is exactly one negligible component
$z_{j_0}$
in z, and
$z_{j_0}$
is the centre of the unique peak
$(z_{j_0-1}, z_{j_0}, z_{j_0+1})$
.





Proposition 4.5. For
 $\alpha\ge1$
,
 $\sup_{z\in\mathcal{S}}\Psi_{\alpha}(z) \le \sup_{z\in\mathcal{S}'}\Psi_{\alpha}(z)$
.
Proof. Let us start by outlining the structure of the proof. Pick an arbitrary
 $z\in\mathcal{S}$
. We will gradually improve z by a series of subsequent combinatorial reductions
 $z \longrightarrow z^{(1)} \longrightarrow z^{(2)} \longrightarrow z^{(3)} \longrightarrow z^{(4)}$
such that
 $\Psi_{\alpha}(z) \le \Psi_{\alpha}(z^{(i)}) \le \Psi_{\alpha}(z^{(j)})$
for
 $1\le i\le j\le 4$
, and
 $z^{(i)}$
will satisfy the requirements from (1) to (i) in the definition of
 $\mathcal{S}'$
. This will give
 $\Psi_{\alpha}(z) \le \Psi_{\alpha}(z^{(4)})$
for some
 $z^{(4)}\in \mathcal{S}'$
, and the claim will be proved.
 $z \rightarrow z^{(1)}$
. Put
 $z= (z_0, z_1, \dots, z_{n+1})$
. If
 $z_{i-1}\not=z_i$
for all
 $i\in \{1,2,\dots, n+1\}$
, then we are done. Otherwise, let
 $i_0$
be the smallest index without this property. As
 $z_0=0$
and
 $z_1$
is strictly positive, we must have
 $i_0>1$
. Analogously, we have
 $i_0<n+1$
. Consequently, observe that
 $z_{i_0-1}$
and
 $z_{i_0}$
are negligible. Examine the transformation
 $z\mapsto \tilde{z}$
,
 \begin{equation} (\dots, z_{i_0-1}, z_{i_0}, z_{i_0+1}, \dots) \longrightarrow w^{-1}\cdot(\dots, z_{i_0-1}, z_{i_0+1}, \dots), \end{equation}
 $w = 1-z_{i_0}$
, which removes
 $z_{i_0}$
and rescales the remaining elements. If
 $z_{i_0+1}\in \phi_{\alpha}(z)$
, then
 $w^{-1}z_{i_0+1}$
will remain a significant component of
 $\tilde{z}$
. The contribution of
 $z_{i_0+1}$
(and all the other significant components of z) to the overall sum will grow by a factor of
 $w^{-1}>1$
. The contribution of
 $z_{i_0-1}$
to
 $\Psi_{\alpha}(z)$
is zero and it can only increase if
 $z_{i_0-1}$
becomes significant. Therefore,
 $\Psi_{\alpha}(z) \le \Psi_{\alpha}(\tilde{z})$
. After a finite number of such operations, we obtain a sequence
 $z^{(1)}$
for which (1) holds.
 $z^{(1)} \rightarrow z^{(2)}$
. Set
 $z^{(1)}=(z_i^{(1)})_{i=0}^{n+1}$
and suppose that
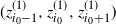 $(z_{i_0-1}^{(1)}, z_{i_0}^{(1)}, z_{i_0+1}^{(1)})$
is a split for some
 $i_0\in \{2,3,\dots, n-1\}$
; by the definition of split configuration,
 $i_0$
must be greater than 1 and smaller than n. Accordingly, note that
 $z_{i_0}^{(1)}$
is negligible and consider the preliminary modification
 $z^{(1)}\mapsto \hat{z}^{(1)}$
given by
 \begin{align*}(\dots, z_{i_0-1}^{(1)}, z_{i_0}^{(1)}, z_{i_0+1}^{(1)}, \dots) \longrightarrow (\dots, z_{i_0-1}^{(1)},0, z_{i_0+1}^{(1)}, \dots),\end{align*}
which changes
 $z_{i_0}^{(1)}$
into 0 (so
 $\hat{z}^{(1)}\not\in \mathcal{S}$
: we will handle this later). As
 $z_{i_0-1}^{(1)}>z_{i_0}^{(1)}$
, we have
 \begin{equation} \Bigg|\frac{z_{i_0-1}^{(1)}}{z_{i_0-2}^{(1)}+z_{i_0-1}^{(1)}}-\frac{z_{i_0-1}^{(1)}}{z_{i_0-1}^{(1)}+z_{i_0}^{(1)}}\Bigg| < \Bigg|\frac{z_{i_0-1}^{(1)}}{z_{i_0-2}^{(1)}+z_{i_0-1}^{(1)}}-1\Bigg| \end{equation}
if only
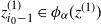 ${z_{i_0-1}^{(1)}\in \phi_{\alpha}(z^{(1)})}$
. Similarly, as
 $z_{i_0}^{(1)}<z_{i_0+1}^{(1)}$
, we get
 \begin{equation} \Bigg|\frac{z_{i_0+1}^{(1)}}{z_{i_0}^{(1)}+z_{i_0+1}^{(1)}}-\frac{z_{i_0+1}^{(1)}}{z_{i_0+1}^{(1)}+z_{i_0+2}^{(1)}}\Bigg| < \Bigg|1-\frac{z_{i_0+1}^{(1)}}{z_{i_0+1}^{(1)}+z_{i_0+2}^{(1)}}\Bigg| \end{equation}
as long as
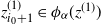 ${z_{i_0+1}^{(1)}\in \phi_{\alpha}(z^{(1)})}$
. By (4.7) and (4.8), with a slight abuse of notation (the domain of
 $\Psi_{\alpha}$
does not formally contain
 $\hat{z}^{(1)}$
, but we may extend the definition for
 $\Psi_{\alpha}(\hat{z}^{(1)})$
in a straightforward way), we can write
 $\Psi_{\alpha}(z^{(1)}) \le \Psi_{\alpha}(\hat{z}^{(1)})$
. Now, let us write
 $\hat{z}^{(1, \leftarrow)} = \big(0, \hat{z}_{1}^{(1)}, \dots, \hat{z}_{i_0-1}^{(1)}, 0\big)$
and
 $\hat{z}^{(1, \rightarrow)} = \big(0, \hat{z}_{i_0+1}^{(1)}, \dots, \hat{z}_{n}^{(1)}, 0\big)$
. In other words, the sequences
 $\hat{z}^{(1, \leftarrow)}$
and
 $\hat{z}^{(1, \rightarrow)}$
are two consecutive parts of
 $\hat{z}^{(1)}$
and we can restore
 $\hat{z}^{(1)}$
by glueing their corresponding zeros together. Moreover, after normalising them by the weights
 $w^{(1,\leftarrow)}=\sum_{i=1}^{i_0-1}\hat{z}_{i}^{(1)}$
and
 $w^{(1,\rightarrow)}=\sum_{i=i_0+1}^{n}\hat{z}_{i}^{(1)}$
, we get
 $(w^{(1,\leftarrow)})^{-1}\hat{z}^{(1,\leftarrow)},(w^{(1,\rightarrow)})^{-1}\hat{z}^{(1,\rightarrow)}\in\mathcal{S}$
. Next, in this setup, we are left with
 \begin{align*} \Psi_{\alpha}(\hat{z}^{(1)}) & = w^{(1, \leftarrow)}\cdot\Psi_{\alpha}\bigg( \frac{\hat{z}^{(1, \leftarrow)}}{w^{(1, \leftarrow)}}\bigg) + w^{(1, \rightarrow)}\cdot\Psi_{\alpha}\bigg(\frac{\hat{z}^{(1, \rightarrow)}}{w^{(1, \rightarrow)}}\bigg) \\[5pt] & \le \max\bigg\{\Psi_{\alpha}\bigg( \frac{\hat{z}^{(1, \leftarrow)}}{w^{(1, \leftarrow)}}\bigg), \Psi_{\alpha}\bigg(\frac{\hat{z}^{(1, \rightarrow)}}{w^{(1, \rightarrow)}}\bigg)\bigg\}, \end{align*}
where we have used
 $w^{(1, \leftarrow)}+w^{(1, \rightarrow)}=1$
. Let
 \begin{align*} \tilde{z}^{(1)} = \arg\max\bigg\{\Psi_{\alpha}(z)\colon z \in \bigg\{\frac{\hat{z}^{(1,\leftarrow)}}{w^{(1,\leftarrow)}},\frac{\hat{z}^{(1,\rightarrow)}}{w^{(1,\rightarrow)}}\bigg\}\bigg\}. \end{align*}
By construction, we have
 $\Psi_{\alpha}(z^{(1)}) \le \Psi_{\alpha}(\tilde{z}^{(1)})$
, the new sequence
 $\tilde{z}^{(1)}$
is shorter than
 $z^{(1)}$
, and
 $\tilde{z}^{(1)}$
contains fewer split configurations than
 $z^{(1)}$
. After repeating this procedure (
 $z^{(1)}\mapsto \tilde{z}^{(1)}$
) multiple times, we acquire a new sequence
 $z^{(2)}$
obeying requirements (1) and (2).
 $z^{(2)} \rightarrow z^{(3)}$
. Surprisingly, it is enough to put
 $z^{(3)}=z^{(2)}$
. Indeed, we can show that the sequence
 $z^{(2)}$
already satisfies the third condition. First, suppose that
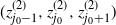 $(z_{j_0-1}^{(2)},z_{j_0}^{(2)},z_{j_0+1}^{(2)})$
and
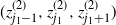 $(z_{j_1-1}^{(2)}, z_{j_1}^{(2)}, z_{j_1+1}^{(2)})$
are two different peaks with indices
 $j_0<j_1$
. Hence, as
 $z_{j_0}^{(2)}>z_{j_0+1}^{(2)}$
and
 $z_{j_1-1}^{(2)}<z_{j_1}^{(2)}$
, there is at least one point
 $i_0\in\{j_0+1, \dots, j_1-1\}$
at which we are forced to ‘flip’ the direction of the previous inequality sign:
 \begin{align*}z_{j_0-1}^{(2)}< z_{j_0}^{(2)}>z_{j_0+1}^{(2)}>\dots > z_{i_0}^{(2)}<\dots<z_{j_1-1}^{(2)}< z_{j_1}^{(2)}>z_{j_1+1}^{(2)}.\end{align*}
Equivalently, this means that
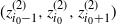 $(z_{i_0-1}^{(2)}, z_{i_0}^{(2)}, z_{i_0+1}^{(2)})$
is a split configuration. This contradicts our initial assumptions about
 $z^{(2)}$
(requirement (2) is not met) and proves that there is at most one peak in
 $z^{(2)}$
. Second, we have
 $0=z_{0}^{(2)}<z_1^{(2)}$
and
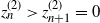 $z_{n}^{(2)}>z_{n+1}^{(2)}=0$
, so there exists a point
 $j_0$
at which the direction of the inequalities must be changed from ‘
 $<$
’ to ‘
 $>$
’. Thus, there is at least one peak in
 $z^{(2)}$
.
 $z^{(3)} \rightarrow z^{(4)}$
. Let
 $z^{(3)}=(z_i^{(3)})_{i=0}^{n+1}$
and assume that
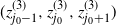 $(z_{j_0-1}^{(3)}, z_{j_0}^{(3)}, z_{j_0+1}^{(3)})$
is the unique peak of
 $z^{(3)}$
:
 \begin{equation} 0<z_1^{(3)}<\dots<z_{j_0-1}^{(3)} < z_{j_0}^{(3)} > z_{j_0+1}^{(3)} > \dots > z_n^{(3)}>0. \end{equation}
The further reasoning is similar to points (1) and (2), so we will just sketch it. If requirement (4) is not satisfied, pick a negligible component
 $z_{i_0}^{(3)}$
with
 $i_0\not=j_0$
. Next, apply the transformation
 $z^{(3)}\mapsto\tilde{z}^{(3)}$
defined by (4.6), i.e. remove
 $z_{i_0}^{(3)}$
and rescale the remaining components. Thanks to the ‘single-peak structure’ (4.9), all the significant components of
 $z^{(3)}$
remain significant for
 $\tilde{z}^{(3)}$
. The terms associated with components
 $z^{(3)}_i \in \phi_{\alpha}(z^{(3)})\setminus \{z_{i_0-1}^{(3)}, z_{i_0+1}^{(3)} \}$
are not changed (and their contribution grows after the rescaling). The summands corresponding to
 $z_{i_0-1}^{(3)}$
and
 $z_{i_0+1}^{(3)}$
can only increase, just as in (4.7) and (4.8). Therefore
 $\Psi_{\alpha}(z^{(3)}) \le \Psi_{\alpha}(\tilde{z}^{(3)})$
. After several repetitions and discarding of all unnecessary negligible components (beyond the central
 $z_{j_0}$
), we finally obtain the desired sequence
 $z^{(4)}\in \mathcal{S}'$
.
We proceed to the proof of our main result.
Proof of Theorem 1.3. We start with the lower estimate, for which the argument is simpler. By Proposition 4.3 and the reformulation in (4.5), for
 $\alpha > 2$
,
 \begin{align*} \alpha\cdot\sup_{(X,Y)\in\mathcal{C}}\mathbb{E}|X-Y|^{\alpha} = \alpha\cdot\sup_{z\in\mathcal{S}}\Phi_{\alpha}(z) & \ge \alpha\cdot\Phi_{\alpha}\bigg(0,\frac{1}{\alpha},\frac{\alpha-2}{\alpha},\frac{1}{\alpha},0\bigg) \\[5pt] & = \alpha\cdot\frac{2}{\alpha}\bigg|1-\frac{1}{\alpha-1}\bigg|^{\alpha} \xrightarrow{\alpha\rightarrow\infty} \frac{2}{\mathrm{e}}. \end{align*}
Now we turn our attention to the upper estimate. By Propositions 4.4 and 4.5, we get
 \begin{align*} \alpha\cdot\sup_{(X,Y)\in\mathcal{C}}\mathbb{E}|X-Y|^{\alpha} \le \alpha\cdot\bigg(\bigg|1-\frac{1}{1+\sqrt{\alpha}\,}\bigg|^{\alpha} + \sup_{z\in\mathcal{S}'}\Psi_{\alpha}(z)\bigg). \end{align*}
Next, because
 \begin{align*}\lim_{\alpha \to \infty} \alpha\cdot \bigg|1-\frac{1}{1+\sqrt{\alpha}\,}\bigg|^{\alpha} = 0,\end{align*}
it is enough to provide an asymptotic estimate for
 $\alpha\cdot\sup_{z\in\mathcal{S}'}\Psi_{\alpha}(z)$
. Fix an arbitrary
 $z= (z_0, z_1,\dots, z_{n+1})\in \mathcal S'$
and let
 $z_{j_0}$
be the centre of the unique peak contained in z:
 \begin{align*}0<z_1<\dots<z_{j_0-1} < z_{j_0} > z_{j_0+1} > \dots > z_n>0.\end{align*}
As
 $z_{j_0}$
is the only negligible component contained in z, we have
 $\sqrt{\alpha}\cdot z_i<z_{i+1}$
for
 $1\le i\le j_{0}-1$
and
 $z_{i-1}>\sqrt{\alpha}\cdot z_i$
for
 $j_0+1\le i\le n$
. In particular, we get
 $0\le z_{j_0-1}, z_{j_0+1} < 1/\sqrt{\alpha}$
. Consequently, we can write
 $\Psi_{\alpha}(z) = A + B + C$
, where
 \begin{align*} A & = \sum_{|i-j_0|>2}z_i\bigg|\frac{z_i}{z_{i-1}+z_i} - \frac{z_i}{z_i+z_{i+1}}\bigg|^{\alpha}, \\[5pt] B & = z_{i_0-2}\bigg|\frac{z_{i_0-2}}{z_{i_0-3} + z_{i_0-2}} - \frac{z_{i_0-2}}{z_{i_0-2} + z_{i_0-1}}\bigg|^{\alpha} + z_{i_0+2}\bigg|\frac{z_{i_0+2}}{z_{i_0+1} + z_{i_0+2}} - \frac{z_{i_0+2}}{z_{i_0+2} + z_{i_0+3}}\bigg|^{\alpha}, \\[5pt] C & = z_{i_0-1}\bigg|\frac{z_{i_0-1}}{z_{i_0-2} + z_{i_0-1}} - \frac{z_{i_0-1}}{z_{i_0-1} + z_{i_0}}\bigg|^{\alpha} + z_{i_0+1}\bigg|\frac{z_{i_0+1}}{z_{i_0} + z_{i_0+1}} - \frac{z_{i_0+1}}{z_{i_0+1} + z_{i_0+2}}\bigg|^{\alpha}. \end{align*}
We examine these three parts separately.
Looking at A, since
 $z_i/(z_{i-1}+z_i)$
and
 $z_{i}/(z_i+z_{i+1})$
belong to [0, 1], we may write
 \begin{align*} A \le \sum_{i=1}^{j_0-3}z_i + \sum_{i=j_0+3}^{n}z_i & < z_{j_0-3}\cdot\sum_{i=0}^{j_0-4}\bigg(\frac{1}{\sqrt{\alpha}\,}\bigg)^i + z_{j_0+3}\cdot\sum_{i=0}^{n-j_0-3}\bigg(\frac{1}{\sqrt{\alpha}\,}\bigg)^i \\[5pt] & < (z_{j_0-1}+z_{j_0+1})\cdot\frac{1}{\alpha}\cdot\sum_{i=0}^{\infty}\bigg(\frac{1}{\sqrt{\alpha}\,}\bigg)^i \\[5pt] & < \frac{2}{\alpha\sqrt{\alpha}\,}\cdot\sum_{i=0}^{\infty}\bigg(\frac{1}{\sqrt{\alpha}\,}\bigg)^i = \frac{2}{\alpha(\sqrt{\alpha}-1)}, \end{align*}
and hence
 \begin{align*}\alpha\cdot A < \frac{2}{\sqrt{\alpha}-1} \xrightarrow{\alpha \rightarrow \infty} 0.\end{align*}
For B, we have
 \begin{align*} B & \le z_{i_0-2}\bigg|1-\frac{z_{i_0-2}}{z_{i_0-2} + z_{i_0-1}}\bigg|^{\alpha} + z_{i_0+2}\bigg|\frac{z_{i_0+2}}{z_{i_0+1} + z_{i_0+2}}-1\bigg|^{\alpha} \\[5pt] & < z_{i_0-2}\bigg|1-\frac{z_{i_0-2}}{z_{i_0-2} + ({1}/{\sqrt{\alpha}})}\bigg|^{\alpha} + z_{i_0+2}\bigg|\frac{z_{i_0+2}}{({1}/{\sqrt{\alpha}}) + z_{i_0+2}}-1\bigg|^{\alpha} \\[5pt] & \le 2\cdot\sup_{x\in[0,1]}x\bigg|1-\frac{x}{x+({1}/{\sqrt{\alpha}})}\bigg|^{\alpha} = \frac{2}{\sqrt{\alpha}(\alpha-1)}\cdot\bigg(1-\frac{1}{\alpha}\bigg)^{\alpha}. \end{align*}
This yields
 \begin{align*}\alpha\cdot B < \frac{2\sqrt{\alpha}}{\alpha-1}\cdot\bigg(1-\frac{1}{\alpha}\bigg)^{\alpha} \xrightarrow{\alpha \rightarrow \infty} 0.\end{align*}
Finally, for C, we observe that
 \begin{align*} C & \le z_{i_0-1}\bigg|1-\frac{z_{i_0-1}}{z_{i_0-1} + z_{i_0}}\bigg|^{\alpha} + z_{i_0+1}\bigg|\frac{z_{i_0+1}}{z_{i_0} + z_{i_0+1}}-1\bigg|^{\alpha} \\[5pt] & \le z_{i_0-1}|1-z_{i_0-1}|^{\alpha} + z_{i_0+1}|z_{i_0+1}-1|^{\alpha} \\[5pt] & \le 2\cdot\sup_{x\in[0,1]}x|1-x|^{\alpha} = \frac{2}{\alpha+1}\cdot\bigg(1-\frac{1}{\alpha+1}\bigg)^{\alpha}. \end{align*}
Consequently, we obtain
 \begin{align*}\alpha\cdot C \le \frac{2\alpha}{\alpha+1}\cdot\bigg(1-\frac{1}{\alpha+1}\bigg)^{\alpha} \xrightarrow{\alpha \rightarrow \infty} \frac{2}{\mathrm{e}}.\end{align*}
The estimates for A, B, and C give the desired upper bound. The proof is complete.
5. Concluding remarks
The proof of Theorem 1.3 presented above is just an example of a novel, geometric-type approach in the analysis of coherent distributions and related inequalities. We strongly believe that our study of extreme coherent distributions will turn out to be useful in other applications. While some of the results obtained can be easily extended to a wider context, others seem to be harder to generalize. Let us include a short discussion.
-
Definition 1.1, Proposition 1.1, and Theorem 1.4 extend naturally to higher dimensions—the omitted proofs remain analogous. For an arbitrary number
$n\ge2$
, extreme coherent distributions on
$[0,1]^n$
are exactly those whose representations are unique and minimal. -
It is unclear whether Theorem 3.1 enjoys any comparable counterpart for
$n\ge3$
. Without resolving this open question, plausible applications of our geometric approach are rather limited to the two-variate setup. -
A stronger result follows immediately from the proof of Proposition 4.2. We have
for every continuous function
\begin{align*}\sup_{(X,Y)\in\mathcal{C}}\mathbb{E}\tilde{f}(X,Y) = \sup_{(X,Y)\in\mathrm{ext}_\mathrm{f}(\mathcal{C})}\mathbb{E}\tilde{f}(X,Y)\end{align*}
$\tilde{f}\colon[0,1]^2\rightarrow[0,1]$
.
-
The converse of Theorem 3.1 does not hold true. For example, let m be a probability distribution given by
The support of m is just a three-point axial path without cycles. Next, the unique representation of m is now clearly determined by the quotient function
\begin{align*}m\bigg(\frac{1}{4}, 0\bigg) = \frac{1}{3}, \qquad m\bigg(\frac{1}{4}, \frac{3}{4}\bigg) = \frac{1}{3}, \qquad m\bigg(1, \frac{3}{4}\bigg) = \frac{1}{3}.\end{align*}
Note that
\begin{align*}q\bigg(\frac{1}{4}, 0\bigg)=0, \qquad q\bigg(\frac{1}{4}, \frac{3}{4}\bigg) = \frac{1}{2}, \qquad q\bigg(1, \frac{3}{4}\bigg) = 1.\end{align*}
$(\frac{1}{4}, \frac{3}{4})$
is a cut point, even though it is not an endpoint of the axial path. Thus, by Corollary 3.1, coherent measure m is not an extreme point. Indeed, we have
$m = \frac{1}{2}(m_1+m_2)$
, where
$m_1, m_2 \in \mathcal{C}$
are given by In practice, to prove the extremality of a discrete coherent distribution (whose support is an axial path without cycles), we need to compute its quotient function.
\begin{align*}m_1\bigg(\frac{1}{4}, 0\bigg) = \frac{2}{3}, \qquad m_1\bigg(\frac{1}{4}, \frac{3}{4}\bigg) = \frac{1}{3}, \qquad m_2\bigg(\frac{1}{4}, \frac{3}{4}\bigg) = \frac{1}{3}, \qquad m_2\bigg(1, \frac{3}{4}\bigg) = \frac{2}{3}.\end{align*}
-
In the proof of Proposition 4.3, we applied Corollary 3.1 to justify the reduction (1.1). A similar argumentation might enable or simplify the evaluation of the quantity
$\sup_{(X,Y)\in\mathrm{ext}_\mathrm{f}(\mathcal{C})}\mathbb{E}\tilde{f}(X,Y)$
for multiple (not necessarily convex) continuous functions
$\tilde{f}\colon[0,1]^2\rightarrow[0,1]$
.










Acknowledgements
The authors would like to thank the anonymous reviewers for their very careful reading of the first version of this paper, and for their insightful comments and useful suggestions.
Funding information
There are no funding bodies to thank relating to the creation of this article.
Competing interests
There were no competing interests to declare which arose during the preparation or publication process of this article.



