


10.1 Introduction
In the late 1990s, Social Democrats governed twelve of the then fifteen European Union states, and their electoral successes often correlated with Third Way–style ideological moderation to the center (Blair and Schröder Reference Blair and Schröder2000; Keman Reference Keman2011). Yet the first two decades of the twenty-first century have been considerably less kind to Social Democracy at the ballot box (Benedetto et al. Reference Benedetto, Hix and Mastrorocco2020). To what extent does moderation in ideological positioning by social democratic parties affect their short- and long-term electoral fortunes in contemporary advanced democracies? Do the electorates of the major moderate left parties treat these parties differently when they moderate their positions on the economic or cultural dimension?
The ability of citizens to express their preferences by voting for parties with the most congruent policy positions is a fundamental feature of representation (Soroka and Wlezien Reference Soroka and Wlezien2010; Budge et al. Reference Budge, Keman, McDonald and Pennings2012; Rohrschneider and Whitefield Reference Rohrschneider and Whitefield2012). Studying if and how citizens respond to the ideological moderation of major moderate left parties helps clarify if and when party leaders can shape public opinion, and whether citizens approve of or otherwise react to the positional changes of major political parties. It therefore directly addresses the contemporary connection between parties and voters, a cornerstone of representative democracy.
In their analysis of the British electorate between 1983 and 2010, Evans and Tilley (Reference Evans and Tilley2012a: 974) find that “[l]eft-right ideology matters to voters’ party choices, but it matters a lot less when parties are offering policy options that do not differ ideologically from one another.” We extend this supply-side explanation to other party systems of Western Europe to address the fact that “[a]lthough extensive research analyzes the factors that motivate European parties to shift their policy positions, there is little cross-national research that analyzes how voters respond to parties’ policy shifts” (Adams et al. Reference Adams, Ezrow and Somer-Topcu2011: 370). In this chapter, we therefore test competing and complementary ideas about the electoral effects of ideological moderation using a range of social democratic parties over a longer time span with individual-level data.
Our chapter also addresses the rise of sociocultural political competition and the impact of mainstream party policy positions on minor (or previously minor) party successes and failures in elections across Europe (Meguid Reference Meguid2008; van der Brug and van Spanje Reference Van der Brug and van Spanje2009; Pardos-Prado Reference Pardos-Prado2015; Abou-Chadi and Wagner Reference Abou-Chadi and Wagner2020; Spoon and Klüver Reference Spoon and Klüver2020). If supporters of moderate left parties respond to moderation in a similar fashion, a common theoretical framework could help us understand if ideological repositioning by these political parties facilitates challenger party successes and increased party competition over sociocultural issues (Hobolt and Tilley Reference Hobolt and Tilley2016; Spoon and Klüver Reference Spoon and Klüver2019; De Vries and Hobolt Reference De Vries and Hobolt2020).
We make three interrelated contributions to knowledge in these areas: First, the chapter suggests that citizens do respond to changes in the policy positions of social democratic parties. Moderation has driven some voters away from these parties but also helped them retain other voters – though at lower rates. Second, our multidimensional perspective allows us to report additional information about the economic and cultural dimensions of electoral competition. More specifically, social democratic party moderation on the economic left–right dimension decreases the propensity of previous voters to stay with that party in the subsequent election. Whereas for the sociocultural dimension, moderation does not seem to penalize these parties down the road, at least in relation to retaining existing party supporters. Finally, we illustrate that supplementing aggregate-level analysis with individual-level data is crucial to capturing the dynamic relationship between a party’s shift to the center and electoral support. Our compilation and use of individual-level data to carefully track citizen responses to party policy shifts allows us to show that while moderation could pay off in the short run, it may also reduce the chances that voters stick with social democratic parties at subsequent elections. These differences would not be observable in aggregate analysis.
10.2 Explaining How Voters Respond to Shifts in Party Positions
There is strong empirical evidence that parties update and adjust their positions in response to shifts in citizen preferences, presumably in an attempt to enhance their electoral prospects (Adams et al. Reference Adams, Clark, Ezrow and Glasgow2006; Ezrow et al. Reference Ezrow, de Vries, Steenbergen and Edwards2011; Lehrer Reference Lehrer2012; Schumacher et al. Reference Schumacher, de Vries and Vis2013; Abou-Chadi and Orlowski Reference Abou-Chadi and Orlowski2016).Footnote 1 However, the relatively few cross-national studies that examine if citizens systematically react to parties’ policy shifts in real-world multiparty electoral competition provide less consistent evidence (see, e.g., Adams Reference Adams2012; Meyer Reference Meyer2013). A particularly influential and provocative study found little to no responsiveness from voters to shifts in party policy statements (Adams et al. Reference Adams, Ezrow and Somer-Topcu2011). Respecifying some key components of this research, others report that election platforms and campaigns produce at least small changes in voter perceptions of party positions (Fernandez-Vazquez Reference Fernandez-Vazquez2014). Still others found that while voters do not respond to shifts as captured in party manifestos, they are responsive to coalition participation as a heuristic for ideological changes (Fortunato and Stevenson Reference Fortunato and Stevenson2013; Fortunato and Adams Reference Fortunato and Adams2015; Adams et al. Reference Adams, Ezrow and Wlezien2016), or respond to other highly visible real-world changes from parties (Seeberg et al. Reference Seeberg, Slothuus and Stubager2017).Footnote 2 For the purposes of this chapter, the lack of consensus about voter responsiveness to the policy shifts of parties as reported in election manifestos is the key takeaway from this debate.
Despite the ongoing discussion about whether or not voters are attentive to and affected by party policy shifts, there is surprisingly more agreement that ideological moderation enhances a party’s vote share, at least initially. Yet much of the empirical evidence suggests that this effect is rather small substantively. The results of Ezrow (Reference Ezrow2005) indicate that the vote shares of Western European political parties increase the closer they are to the middle of the voter distribution on the left–right dimension. Policy moderation as a strategy to expand parties’ vote share is grounded in the spatial voting model (Downs Reference Downs1957a; Enelow and Hinich Reference Enelow and Hinich1984; Lin et al. Reference Lin, Enelow and Dorussen1999). Assuming that the electorate can be aligned along a single dimension and that the distribution of voters on this dimension peaks in the center (see Ezrow Reference Ezrow2005 for cross-country support of the latter proposition),Footnote 3 the optimal strategy of non-extremist parties is to move to the middle, where most voters are located.
Although the expected convergence on the median voter position is based in models of two party competition, Adams and Somer-Topcu (Reference Adams and Somer-Topcu2009b) assert that the Downsian model anticipates party gains from moderation even in elections with four or more competitors, increasing its applicability to Western European democracies.Footnote 4 Beyond vote-seeking centripetal forces, office-seeking parties (Strøm and Müller Reference Strøm, Müller, Müller and Strøm1999) in democracies where coalitions are the norm have additional reasons to take more moderate positions. A party that positions itself near the central tendency of the electorate could increase its flexibility in the formation of government coalitions or its attractiveness to other government formateurs (Ezrow Reference Ezrow2008; Lehrer Reference Lehrer2012). Taken together, the implication is that parties can successfully focus on the political center while maintaining a core base. Kirchheimer (Reference Kirchheimer, LaPalombara and Weiner1966) famously expected that moderate right and moderate left parties would moderate their policy positions in pursuit of the median voter; we follow his terminology here and refer to this as the “catchall argument.”
Adams and Somer-Topcu (Reference Adams and Somer-Topcu2009b) extend on the finding of Ezrow (Reference Ezrow2005) with evidence of a lagged policy moderation benefit for parties in postwar democracies. Aggregate voter support at the current election increased (again by rather small amounts) when left-wing parties moved right or when right-wing parties moved left in the previous election. These authors draw on studies of issue evolution and macro partisanship from the United States (Carmines and Stimson Reference Carmines and Stimson1989; Erikson et al. Reference Erikson, MacKuen and Stimson2002) to make the case that there can be a substantial time lag between when a party elite’s behavior changes, for example, positional shifts, and when voters fully pick up on and respond to these changes.
In contrast to those that find short or longer-term electoral benefits from moderation, others argue that focusing on the center exposes parties to attacks from smaller, more ideologically extreme parties, particularly in proportional electoral systems (Allen Reference Allen2009; Arndt Reference Arndt2014; Schwander and Manow Reference Schwander and Manow2017). This research emphasizes a different aspect of the catchall thesis, namely, the loss of distinctiveness in mainstream party ideologies and longer-term damage this may cause for party brands.Footnote 5 This approach is also consistent with the argument that parties cannot suddenly and costlessly move from point to point in the policy space but are also constrained by activists, organizations, and ideological histories (see, e.g., Meyer Reference Meyer2013; Kitschelt and Rehm Reference Kitschelt, Rehm, Beramendi, Häusermann, Kitschelt and Kriesi2015; Hooghe and Marks Reference Hooghe and Marks2018).
In prior work, we attempted to combine these competing perspectives in an analysis of social democratic electoral performance during the 1980s–2000s in three countries with institutional differences structuring party competition (Karreth et al. Reference Karreth, Polk and Allen2013). After adopting more centrist stances Social Democrats in Germany, Sweden, and the United Kingdom received an anticipated increase in support from centrist voters. These same parties, however, went on to lose voters from the center and the Left in elections that took place more than one electoral cycle after moderation. The moderating moves of Social Democrats in the 1990s, “while initially successful, contributed to their losing power by the early to mid-2000s” (Allen Reference Allen2009: 636). We argued that the influx of centrist support receded because this voting bloc was less attached to Social Democrats and just as willing to vote for other parties or abstain. Over time, programmatic moderation also alienated left-leaning, former supporters as well. In this chapter, we continue to refer to this as the “catch-and-release argument.”
A surge and decline in post-moderation electoral support could result from a combination of political-economic, electoral, and organizational dilemmas faced by most contemporary social democratic parties (Kitschelt Reference Kitschelt1994, Reference Kitschelt, Kitschelt, Lange, Marks and Stephen1999; Green-Pedersen and van Kersbergen 2002; Oesch and Rennwald Reference Oesch and Rennwald2018). The growth and diversification of the service sector encouraged Social Democrats to appeal to more professional workers in addition to the working class (Gingrich and Häusermann Reference Gingrich and Häusermann2015; Häusermann Reference Häusermann, Manow, Palier and Schwander2018).Footnote 6 More market-oriented economic stances and increasingly liberal positions on sociocultural issues were adopted as a means of appealing to these voters (Kitschelt Reference Kitschelt1994; Giddens Reference Giddens1998; Blair and Schröder Reference Blair and Schröder2000). However, the shifts to culturally liberal and market-oriented policy stances that attracted emerging post-material voting groups simultaneously generated tensions within the rank-and-file electoral base of social democratic parties (Rennwald and Evans Reference Rennwald and Evans2014; Oesch and Rennwald Reference Oesch and Rennwald2018). Many core social democrat supporters expect protection of the welfare state and job creation rather than economic moderation and spending cuts (Bremer Reference Bremer2018; Horn Reference Horn2021); when confronted with austerity policies from social democratic governments, these supporters could abstain or defect to competitor leftist parties (Kitschelt Reference Kitschelt, Kitschelt, Lange, Marks and Stephen1999: 324). It therefore remains an important question how the repositioning of social democratic parties on the economic and cultural dimensions of politics has affected electoral outcomes for these parties. Our chapter complements this research by answering calls for cross-national explorations of the electoral effects of policy shifts (Tavits Reference Tavits2007; Adams Reference Adams2012), and by including the fuller range of social democratic parties in a long-term analysis.
Up to this point, we have focused on two interrelated questions: (1) Do voters respond to shifts in party positions over time? and (2) Are mainstream moderate left parties electorally rewarded or punished for ideological moderation? Implicit within this discussion has been the additional complicating factor that party competition in Western Europe is increasingly multidimensional. The importance of a second, sociocultural dimension to contemporary European party politics has been extensively documented by a range of scholars (see, e.g., Kitschelt Reference Kitschelt1994; Kriesi et al. Reference Kriesi, Grande, Lachat, Dolezal, Bornschier and Frey2008; Hooghe and Marks Reference Hooghe and Marks2009; van der Brug and van Spanje Reference Van der Brug and van Spanje2009; Bornschier Reference Bornschier2010; Beramendi et al. Reference Beramendi, Häusermann, Kitschelt, Kriesi, Beramendi, Häusermann, Kitschelt and Kriesi2015).Footnote 7
Changes to the political economies of European democracies pushed many social democratic parties to more culturally liberal policies in the latter part of the twentieth century. At the same time or just slightly later, the anti-immigration positions of the Radical Right presented a challenge on the cultural dimension for the parties of both the Moderate Right (Bale Reference Bale2003, Reference Bale2008; de Lange Reference De Lange2012; Pardos-Prado Reference Pardos-Prado2015) and the Moderate Left (Bale et al. Reference Bale, Green-Pedersen, Krouwel, Luther and Sitter2010; Hinnfors et al. Reference Hinnfors, Spehar and Bucken-Knapp2012). Throughout Europe mainstream moderate left parties face incentives to respond to environmental and/or immigration politics in ways that alter their policy positions on the cultural dimension (Spoon et al. Reference Spoon, Hobolt and de Vries2014; Abou-Chadi Reference Abou-Chadi2016). Recently, Wagner and Meyer (Reference Wagner and Meyer2017) report evidence of an authoritarian shift on the cultural dimension for mainstream parties across the party systems of Europe, and Abou-Chadi and Krause (Reference Abou-Chadi and Krause2020) highlight that radical right party success leads to more culturally protectionist positions from mainstream political parties. Overall, this suggests substantial positional changes on the cultural dimension for the major left parties of Europe, but scholarship examining voter responsiveness to shifts on this dimension has only recently come into sharper focus (but see Plescia and Staniek Reference Plescia and Staniek2017 for related research).
The potential promise of “rightward” shifts by social democratic parties on immigration issues has received particular attention in public and scholarly discourse. An experiment involving Danish citizens in the context of the 2019 parliamentary elections finds that the social democratic party taking more anti-immigration positions attracts anti-immigration voters and repels pro-immigration voters, but that the latter tend to defect to supporting parties of the Left, thus increasing overall support for a social democratic-led government (Hjorth and Larsen Reference Hjorth and Vinæs Larsen2022). In a comparative study, Spoon and Klüver (Reference Spoon and Klüver2020) further report that shifts in an anti-immigration direction provide electoral benefits for mainstream left parties. Alternatively, Abou-Chadi and Wagner (Reference Abou-Chadi and Wagner2020) report no evidence for the expectation that taking more authoritarian/nationalist and anti-EU positions increases electoral support for social democratic parties and find that social democratic parties can win votes by focusing on investing in citizens’ productivity when they also take more liberal sociocultural positions and are not opposed by strong unions (Abou-Chadi and Wagner Reference Abou-Chadi and Wagner2019). Connecting to this line of research, we therefore test our arguments on both the economic and cultural dimensions of party competition – but unlike other work, we focus on the longer-term impact of moderation and right-ward shifts by examining voter responses one election after major left parties moderated their platform.
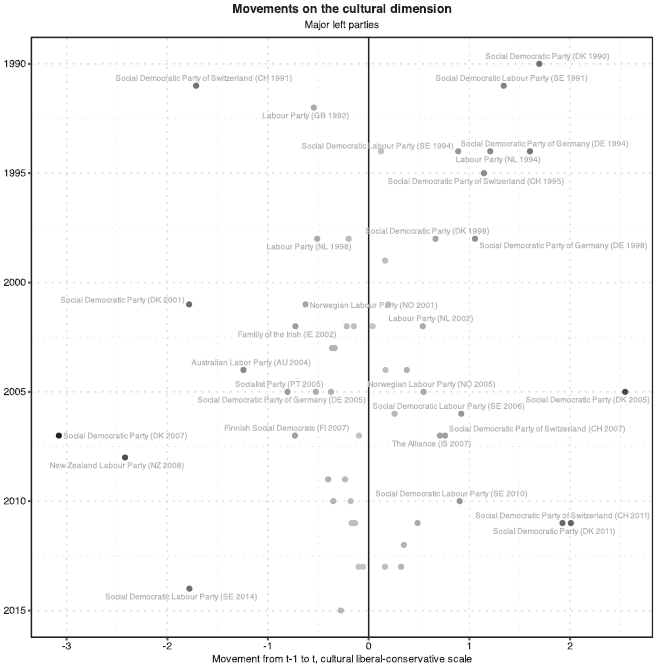
Does the impact of moderation on repeat voting vary between the economic and cultural dimension? While disentangling the separate effects of economic and cultural preferences on vote choice is difficult (Stoetzer and Zittlau Reference Stoetzer and Zittlau2020), we highlight the historical importance of the economic dimension for the social democratic party. Using a measure of relative salience between the economic and cultural dimensions for the party families of Western Europe with manifesto data, Koedam (Reference Koedam2022) reports that social democratic parties attribute more weight to the economic dimension relative to the cultural dimension than do any other party family. Thus, not only should Social Democrats be more rooted and ideologically constrained on their dominant dimension (Hooghe and Marks Reference Hooghe and Marks2018), here economic left–right, but the electoral effects of positional changes on the dominant dimension (positive or negative) should also be stronger than changes on the subordinate dimension. On the sociocultural dimension, the party family should have more positional flexibility (Rovny Reference Rovny2013; Koedam Reference Koedam2022), but could also expect relatively less electoral impact from their positional changes. Any expected electoral gains from moderation on the sociocultural dimension by social democratic parties are further complicated by the existence of “new left” and “new right” competitor parties with substantial and rather durable ownership of issues like the environment and immigration that feature prominently in the cultural dimension (Abou-Chadi Reference Abou-Chadi2016; Seeberg Reference Seeberg2017). In the hypotheses that follow, we therefore anticipate moderation on the economic dimension to have a larger impact on repeat votes for Social Democrats than moderation on the sociocultural dimension. This is also the case because, as Figure 10.4 shows, more pronounced moves on the cultural dimension happened in the later periods of our dataset, implying that any voters who may have been attracted to social democratic parties because of these moves would not yet appear in our data as prior social democratic voters.
10.3 Hypotheses on the Longer-Term Impact of Moderation
Drawing on arguments in the existing literature that highlight the benefits and drawbacks of catchall strategies, we test the following hypotheses. The catchall argument can be extended to suggest that voters reward moderation beyond the immediate preelection period (Adams and Somer-Topcu Reference Adams and Somer-Topcu2009b). Therefore, a successful catchall strategy implies that voters are more likely to vote again for social democratic parties in consecutive elections if these parties have moderated in the previous election cycle, compared to parties that did not moderate (H1).
The counterargument, outlined in Karreth et al. (Reference Karreth, Polk and Allen2013) but also with roots in standard spatial theory (e.g., Häusermann and Kitschelt, this volume) suggests the opposite: Voters may be more likely to vote for social democratic parties that moderated in the election immediately following moderation (compared to parties that did not moderate), but they will be less likely to vote for the same social democratic party again in the subsequent election (H2).
In our analyses in this chapter, we compare three different vote choices associated with these hypotheses: continued voting for major left parties (vs. any other party or abstention), switching to minor left parties (vs. any other party or abstention), and switching to parties on the right (vs. any other party or abstention). As we discuss in more detail in Section 10.4, our empirical strategy focuses on the effects of social democratic moderation on retaining prior supporters of the party family. For methodological reasons, we do not test here if moderation results in the expected influx of centrist voters, a dynamic for which we have found some evidence in our prior work (Karreth et al. Reference Karreth, Polk and Allen2013). We stress that attracting such centrist voters through moderation would also be consistent with the literature and doing so is the intended goal of moderation in the first place. We do, however, note that subsequently switching to parties on the right (the third set of our analyses) would be a likely outcome for any centrist voters picked up by moderation but with only weak or no enduring bond to social democratic parties.
The present chapter is particularly well-suited to examining the response of social democratic electorates to positional moderation in the form of vote switching to minor left challenger parties within the same ideological bloc, a scenario highlighted as a pressing concern for contemporary Social Democracy (Allen Reference Allen2009; Arndt Reference Arndt2014; Schwander and Manow Reference Schwander and Manow2017).
10.4 Empirical Strategy
This chapter makes three main contributions; the research design reflects each. First, distinct from most studies in this area as well and continuing an idea outlined in Karreth et al. (Reference Karreth, Polk and Allen2013), we broaden our focus from immediate movements (directly prior to an election) to movements one period before the election in order to capture possible mid-to longer-term effects of moderation and test whether voters respond differently to these than to more recent party position movements. Second, following studies exploring the impact of Downsian moderation strategies at the aggregate level of vote shares (see, e.g., Ezrow Reference Ezrow2005; Adams and Somer-Topcu Reference Adams and Somer-Topcu2009b), we focus on the individual level of analysis and explore the impact of movements in parties’ positions on individual vote choice, following cues from prior studies (e.g., Tavits Reference Tavits2007: 161). Finally, reflecting the growing importance of multidimensional political competition in European democracies, we track party moderation on both the economic left–right and cultural liberal–conservative dimensions.
The unit of analysis for this study is the individual voter who had previously voted for a major left party. We obtain information on these individuals from a number of election studies. These studies cover elections in up to sixteen countries during the years from 1996 to 2013, with varying coverage by country. Table 10.1 lists all elections covered in the analyses discussed later. This time period comports well with the trend that motivates this chapter: major left parties’ move to the center in the 1990s and our interest in estimating longer-term effects of these moves.
| Australia 2004 | Iceland 2007 | Portugal 2005 |
| Australia 2013 | Iceland 2009 | Portugal 2009 |
| Austria 2008 | Iceland 2013 | Spain 1996 |
| Austria 2013 | Ireland 2002 | Spain 2000 |
| Canada 2004 | Ireland 2007 | Spain 2004 |
| Canada 2011 | Ireland 2011 | Spain 2008 |
| Denmark 1998 | Netherlands 1998 | Sweden 1998 |
| Denmark 2001 | Netherlands 2002 | Sweden 2002 |
| Denmark 2007 | Netherlands 2006 | Sweden 2006 |
| Finland 2003 | Netherlands 2010 | Sweden 2014 |
| Finland 2007 | New Zealand 2002 | Switzerland 1999 |
| Germany 1998 | New Zealand 2008 | Switzerland 2003 |
| Germany 2002 | New Zealand 2011 | Switzerland 2007 |
| Germany 2005 | Norway 1997 | Switzerland 2011 |
| Germany 2009 | Norway 2001 | United Kingdom 1997 |
| Germany 2013 | Norway 2005 | United Kingdom 2005 |
| Iceland 1999 | Portugal 2002 |
Sources for the individual-level data include four modules of the Comparative Study of Electoral Systems (The Comparative Study of Electoral Systems 2015a, 2015b, 2015c, 2017) as well as national election studies from Denmark (Andersen Reference Andersen2007, Stubager et al. Reference Stubager, Andersen and Hansen2013), Germany (Berger et al. Reference Berger, Jung and Roth1999), Great Britain (Clarke et al. Reference Clarke2006, Fieldhouse et al. Reference Fieldhouse, Green, Evans, Schmitt, van der Eijk, Mellon and Prosser2016), the Netherlands (Todosijević et al. Reference Todosijević, Aarts and van der Kaap2010), Norway (Aardal 2016), Sweden (Holmberg and Oscarsson Reference Holmberg and Oscarsson2012, Reference Holmberg and Oscarsson2017), and Switzerland (Selects 2013).Footnote 8 We then match information on party positions and their movements to survey respondents’ vote choices. This information comes from the Comparative Manifesto Project (Volkens et al. Reference Volkens, Lehmann, Matthieß, Merz and Regel2016).Footnote 9 For the majority of our analyses, a voter enters the sample if they voted for a major left party at t − 1, the election prior to the election that is the focus of the respective survey. This important choice reflects our interest in whether any voters gained (or retained) after moderation at t − 1 will continue to vote for major left parties or defect at t. Our research design thus captures the longer-term impact of moderation strategies on retaining old and new voters. The question of whether moderation can attract new voters (at t − 1, following our notation) is the subject of other studies (e.g., Arndt Reference Arndt2014; Schwander Reference Schwander2019; Polacko Reference Polacko2022; Rennwald and Pontusson Reference Rennwald and Pontusson2021) and not of primary interest for this chapter.
10.4.1 Key Variables
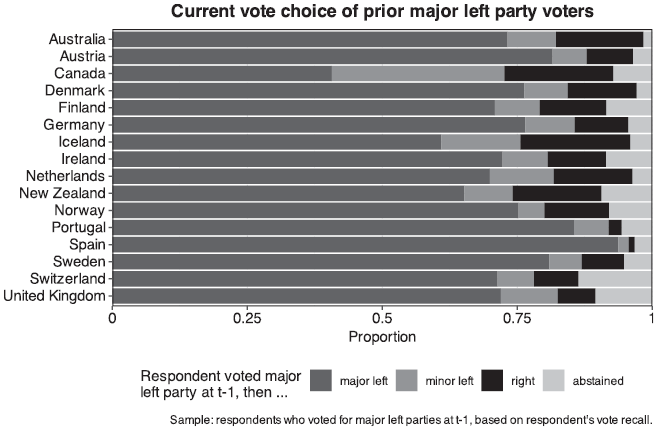
Vote choice with regard to social democratic parties is the main outcome of interest in this study. For the previous election (at time t − 1), we use vote choice for major left parties to define our sample of voters who previously chose major left parties. We then distinguish between multiple choices at time t: voting for the major left party (again), for a minor left party, for a (major or minor) party on the right, or abstention. These choices are coded for the current election (at time t, the election on which the respective election study is focused) and are shown in Figure 10.1. For the regressions reported later, we then generate three outcome variables: continued voting for major left parties (vs. any other party or abstention), switching to minor left parties (vs. any other party or abstention), and switching to parties on the right (vs. any other party or abstention). Information about the prior vote comes from a recall question, asking respondents who they voted for at the previous (parliamentary) election.Footnote 10
Distribution of current vote choices of voters who had chosen major left parties at t − 1. n = 42,506 respondents
As major left parties, we define political parties that have been the major (formateur) party in non-caretaker governments at least once before they enter our analysis. We use this criterion to ensure that all parties considered major parties have at least once held primary governing responsibility. To identify left parties, we use the party family classification from the Manifesto Project Dataset (Budge et al. Reference Budge, Klingemann, Volkens, Bara and Tanenbaum2001; Klingemann et al. Reference Klingemann, Volkens, Bara, Budge and McDonald2006; Volkens et al. Reference Volkens, Lehmann, Matthieß, Merz and Regel2016). We require parties to have competed in at least three elections to be included in this list. The full classification scheme is available in Table 10.A1.
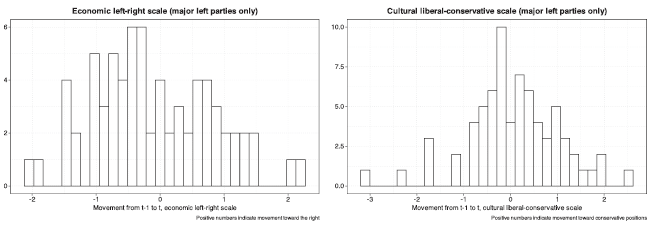
Changes in parties’ programmatic positions drive vote choice per the arguments explored in this study. In line with much of the literature, we consider shifts in party positions from one election manifesto to the next as an appropriate indicator for programmatic changes that might drive vote choice.Footnote 11 We obtain measurements of party positions from the Comparative Manifesto Project (Lowe et al. Reference Lowe, Benoit, Mikhaylov and Laver2012; Volkens et al. Reference Volkens, Lehmann, Matthieß, Merz and Regel2016) and focus on the two main dimensions of political contestation: the economic left–right dimension (stateconomy) and the cultural liberal–conservative dimension (loglibcons). For each party, we calculate movements on each dimension over the period before the preceding election, that is, from t − 2 to t − 1. As an example, for a survey fielded in the United Kingdom for the 1997 election, we measure the movement of parties between the 1987 and 1992 elections. These movements are measured in the logit scale discussed in Lowe et al. (Reference Lowe, Benoit, Mikhaylov and Laver2011). Movements are nearly symmetrically centered around 0, as illustrated in Figure 10.2. For the analyses discussed later, we standardize these movement indicators into a measure of moderation, so that a movement of 1 is equivalent to moving to the center (i.e., to the right for left parties) by one standard deviation. Moderation for left parties, thus, means a move to the right, regardless of the party’s programmatic position before it released a new manifesto. To identify how these movements relate to vote choice, we map each respondent’s choice (in current and prior elections) to that party’s movement in the relevant time period on the respective dimension.Footnote 12
Distribution of movements between prior and current election, all major left parties in the data. Movements calculated on CMP data (stateconomy and loglibcons variables)
In the regression analyses in this chapter, we use a basic set of control variables at the individual level: respondents’ self-placement on the left–right scale as well as the squared term of that measure to account for respondents at extreme ends of the scale and their age (coded in four categories: 29 or below, 30–44 as the baseline category, 45–64, and 65 or older). At the party level, we control for a party’s incumbency status in the period prior to the relevant election. At the system level, we use a polarization measure from Dalton (Reference Dalton2008) to account for the availability of alternative choices. This variable “measures how parties are dispersed along an ideological continuum” (Dalton Reference Dalton2008, 915). Higher polarization suggests closer proximity of parties on the same side of the spectrum, which could make switching easier. But a depolarized party system also diminishes the differences between left–right ideological blocs (Evans and Tilley Reference Evans and Tilley2012b), potentially facilitating switching between mainstream parties. In either scenario, the polarization measure is an important systemic contextual variable for our analyses of switching.
We limit control variables to these in order to maximize the sample of respondents across elections; this is necessary because our focus on voters who had previously voted for major left parties cuts down the observations available in the election studies we use. Using these control variables allows us to recover the equivalent to an average causal effect of party position movements, where control variables remove the other most prominent determinants of vote choice as potential confounders of the effect of party position movements.Footnote 13 In other words, this specification aims to simulate a panel study that allows us to estimate the effect of party positions on otherwise identical respondents (voters) at different time points. In addition, we estimate all models without control variables on the same samples and find substantively consistent results (not reported here). In further analyses reported later, we use additional control variables and geographic subsets to explore how institutional context and class-based dynamics impact the relationship between moderation and vote choice.
10.4.2 Statistical Method
The evidence in this chapter is based on regression analyses of the vote choice variables discussed earlier. These analyses yield an average effect of moderation on individual vote choice. To capture the influence of country-specific or election-specific factors on our estimates of the effect of moderation, we fit multilevel logistic regression models with varying intercepts for countries and election years. In general terms, these models take the following (simplified) form:

where i is an index for individuals, j is an index for countries, t is an index for years, k is an index for major left parties, X is a matrix of control variables, δj[i] is a varying intercept (random effect) for countries, and ηt[i] is a varying intercept for years. Moderation measures the change in the position of the party of interest k in each analysis.
Previewing a benchmark for effect estimates for moderation, vote switching is not a frequent observation in the survey data used in this study. About 3 percent of respondents switched from a major left to a minor left party (see Table 10.2). Therefore, even a one-percentage point change in one individual’s propensity to stay with a major party (or switch to a minor party or abstain) is a meaningful quantity. For these comparisons, we assume that shifts in respondents’ vote propensities translate into changes in vote shares and, more generally, that respondent i’s predicted probability of voting for a party k translates into party k’s vote share by the following formula:

where n is the number of respondents in the sample (or voters in the population, for extrapolation).
| → Vote at t ↓ Vote at t − 1 | Abstain | Major Left | Major Right | Minor Left | Minor Right |
|---|---|---|---|---|---|
| Major LeftFootnote * | 2.4 | 27.9 | 2.3 | 2.8 | 1.6 |
| Major Right | 2.1 | 1.9 | 28.8 | 1.0 | 2.8 |
| Minor Left | 0.6 | 1.5 | 0.5 | 6.9 | 0.5 |
| Minor Right | 0.9 | 1.1 | 2.6 | 0.6 | 11.0 |
Cell entries are percentages based on the full sample of voters in our individual-level data (n = 113,134 respondents). Repeat voters are highlighted in bold.
* These voters define the sample for our regression analyses in this chapter.
10.5 Movements of Party Positions: Descriptive Information
We first describe trends in moderation of major parties on the Left in the countries analyzed in this study. This description clarifies which parties have moderated their position (or moved away from the center). It also shows that parties’ moderation strategies are not always executed on both (economic left–right and cultural liberal–conservative) dimensions in parallel.
Most major parties in the sixteen countries in this study have moved their party positions, as measured in their manifestos, substantially between elections. Some major parties on the Left (Figure 10.3) moved to the right considerably in the 1990s. Here, social democratic parties in Germany, Great Britain, Sweden, Denmark, and the Netherlands form a noticeable cluster, consistent with the conventional wisdom about the “Third Way” narrative’s influence on other social democratic parties at the time. Others moved toward the Left in the early 2000s. Movements on the cultural liberal–conservative scale have been slightly more centered around the middle but are noticeable as well (Figure 10.4). Overall, this shows considerable variation in left parties’ moderation strategies, our key explanatory variable.
Movement from t − 1 to t on the economic left–right scale
Notes: Movements are based on the Comparative Manifesto Project (using raw scores) for major left parties. Only parties moving by more than 0.5 points are labeled. Years in parentheses refer to the election at time t, that is, the election for which the party changed its (manifesto-based) position.

Movement from t − 1 to t on the cultural liberal−conservative scale
Notes: Movements are based on the Comparative Manifesto Project (using raw scores) for major left parties. Only parties moving by more than 0.5 points are labeled.
Because it is difficult to discern from Figures 10.3 and 10.4, we show separately that major parties did not move in parallel on the economic left–right and cultural liberal–conservative scale. Among major parties on the Left, several moderated on the economic scale, but moved further away from the center on the cultural scale. Similarly, some parties moved away from the center on the economic dimension, but moderated on the cultural dimension. The correlation between these movements is too low to warrant conflating both dimensions (Figure 10.5).
Comparing movements from t − 1 to t, economic left–right and cultural liberal−conservative scales
Notes: Only parties with residuals higher than 1 are labeled. The correlation coefficient (r) between movements on the two dimensions is 0.08.

Having demonstrated (a) variation in moderation strategies within and between major parties on the Left and (b) that movements on economic and cultural dimensions are different, we turn to evaluating the evidence on how voters respond to moderation in the long run.
10.6 The Longer-Term Impact of Moderation
In the following analyses, vote choice is coded into several binary variables. These distinguish between:
1. voting for the same (major) left party twice, versus any other party or abstention;
2. voting for a major left party, then voting for a minor left party, versus voting for any other party or abstention;
3. voting for a major left party, then voting for a right party, versus any other choice.
The catchall hypothesis is consistent with no (or a positive) association between prior movement and current choice in (1) and a negative (or no) association between prior movement and current choice in (2) and (3). The catch-and-release hypothesis would suggest that moderation at a prior point is negatively associated with voting for the same party again in the present (1) and a positive association with switching to other parties (2) and (3).
The individual-level evidence presented here varies by the dimension of contestation.Footnote 14 Previewing our main findings, on the economic left–right dimension, moderation is consistent with catch-and-release arguments. Moderation before the prior election reduces the propensity of voters to choose the moderating party again – one election after the party moderated initially. Moderation also drives voters to minor left parties, and at a slightly lower rate to parties on the right. On the cultural dimension, moderation does not penalize parties at the same level; voters are more likely to continue supporting major left parties, but some defect to minor left parties.
10.6.1 Voting for the Same Major Left Party Twice
First, Figure 10.6(a) shows differences in respondents’ propensity to vote for major left parties after those parties moderated one period before the current election.Footnote 15 We find that after one election cycle, previous voters of a major left party that moderated on the economic left–right dimension voted at lower rates for that party – a decrease of close to four percentage points. Interpreting this difference as a potential decline of that party’s vote share of four percentage points, this is a substantial finding. On the cultural dimension, the data show the opposite, though weaker effect. Moderation on that dimension, that is, moving toward more culturally conservative positions, is associated with a higher propensity of voters staying with this party, just below two percentage points.
Moderation in prior cycle and subsequent vote choice of survey respondents who had voted for major left parties in the prior cycle.
Notes: Estimates show the difference between two individuals’ propensity to vote for a major left party at t − 1 and the respective choice at t, where in one case the major left party had moderated in the prior cycle and in other it had not. Full results printed in Tables 10.A2–10.A4; (n = 19,033 respondents).

For all analyses in this section and later, control variables perform as one would expect. Younger voters are more mobile, whereas more older voters voted for the same party twice in a row. The further to the right a voter, the less they voted for the same major left party twice. Incumbency status was associated with fewer repeat votes. In more polarized systems with more options close to the previous choice, voters moved away from major left parties more frequently.
Substantively, these results suggest that based on individual-level survey data, catchall strategies do not pay off in the longer term – on the economic dimension. This is consistent with Karreth et al. (Reference Karreth, Polk and Allen2013) and others that stress the importance of a distinctive economic profile for social democratic parties (Bremer Reference Bremer2018; Berman and Snegovaya Reference Berman and Snegovaya2019). On the cultural dimension, these results are consistent with evidence for the success of catchall strategies, though our results reported later show a more nuanced picture.
10.6.2 Switching to Minor Left Parties
We also evaluate whether moderation in the prior period increases vote switching to minor parties on the same side of the political spectrum or abstentions down the road, one facet of the arguments discussed in Karreth et al. (Reference Karreth, Polk and Allen2013). This is slightly different from the abovementioned analyses, which conflated all non-repeat votes into one category, including switches from major left parties to minor parties on the opposite side of the spectrum (i.e., major left to minor right). The results (see Figure 10.6(b)) lead to similar conclusions. Voters switched to minor left parties when major left parties moderated on the economic dimension. After moderation on the cultural dimension, some voters also defected to minor left parties, at marginally lower rates. The finding on the economic dimension is again consistent with a catch-and-release argument. Immediately after moderation, voters may put their hopes into a major left party, possibly due to its track record on economic policy. After one cycle, a considerable share of these voters defects to minor left parties that may offer economic policies more in line with the earlier platforms of major left parties before they moderated. Similarly, the pattern on the cultural dimension is consistent with a catch-and-release argument inasmuch as the turn toward the right on the cultural dimension may have been tolerable for some voters for one election, but not twice.
10.6.3 Switching to Parties on the Right
We track whether (former) voters of major left parties switch to parties on the right (Figure 10.6(c)). Centrist or “fickle” voters in particular may be drawn to parties on the right after voting for a moderated major left party once. Figure 10.6(c) suggests that switching to right parties indeed happens, at a rate of just below 1 percent, after major left parties moderate on the economic dimension. In combination with increased switching to minor left parties (shown in Figure 10.6(b)), we conclude that the catch-and-release dynamic associated with major left parties’ moderation on the economic dimension loses voters to the Left and the Right. Further analyses to explore a conditional effect of moderation depending on economic performance or other factors would require statistical power that the surveys we use cannot provide. We note, however, that moderation leading to voters leaving not only for minor left parties but also parties on the Right, is consistent with centrist voters leaving Social Democrats (Table 10.A4 and, in a different analysis, Abou-Chadi and Wagner, this volume).
On the cultural dimension, we find that moderation is associated with less switching to right parties. This is consistent with a successful catchall strategy; major left parties may avoid losing voters to parties on the Right with a more conservative profile. However, we note that this dynamic in particular may be sensitive to the composition of voter groups. Other contributions to this volume address this point more explicitly, whereas our chapter only disaggregates this dynamic by ideology and class below and does not address varying effects by gender, age, or race.
10.7 Electoral Institutions and Contexts Can Shape the Impact of Moderation
Because our initial sample combines a variety of electoral contexts and party systems, and in keeping with recent research emphasizing the importance of welfare state configuration for Social Democracy (Manow et al. Reference Manow, Palier and Schwander2018; Loxbo et al. Reference Loxbo, Hinnfors, Hagevi, Blombäck and Demker2021), we report in Table 10.3 separate analyses for the following country groups: Nordic and Northwestern European democracies with proportional representation (PR) and more available choices for voters (and postindustrial structures); Anglo-Saxon First-Past-The-Post (FPTP) systems with fewer choices and limited welfare states; and Mediterranean democracies with political contestation aligned along industrial society lines (during the time period of this study).
| Effect of moderation t − 2 to t − 1 | ||||||
|---|---|---|---|---|---|---|
| Along the economic left–right dimension | Along the cultural lib-cons dimension | |||||
| Respondents in … | On major left, | On major left, | On major left, | On major left, | On major left, | On major left, |
| Then major left | Then minor left | Then right | Then major left | Then minor left | Then right | |
| Full sample | Negative | Positive | Positive | Positive | Positive | Negative |
| NWE | Negative | Marginally positive | Marginally positive | … | Positive | Negative |
| NWE+ | Negative | Positive | Positive | Positive | Positive | Negative |
| FPTP | Positive | Negative | Negative | Negative | Positive | Positive |
| Med. | Negative | Positive | … | Negative | Positive | … |
Notes: This table summarizes results from regressions with our main specification (Tables 10.A2–10.A4) estimated on the respective subset.
Abbreviations: NWE: Nordic and NW European PR democracies; NWE+: NWE plus ICE, IRL, NZD; FPTP: AUS, CND, UK; Med: ESP, PRT.
…: no meaningful difference in vote propensity.
In Nordic and Northwestern European democracies with PR,Footnote 16 we find evidence for the catch-and-release dynamic (H2) on the economic dimension. Moderation on the economic dimension is associated with individual voters deserting major left parties one election later and switching to left (or right) parties. After moderation on the cultural dimension, we find evidence for the catchall effect (H1) inasmuch as voters are more likely to stay with major left parties and less likely to switch to parties on the Right, but we also find that voters do leave for minor left parties (though at lower rates). The menu of available choices in these PR democracies and rise of postindustrial structures are well aligned with the theoretical argument for moderation as a losing strategy, that is, the catch-and-release dynamic.
By contrast, the Anglo-Saxon FPTP systems offer fewer choices and should be less prone to the exhibit voter movements and catch-and-release dynamics as suggested in the PR context. Indeed, our analyses in the smaller samples of these FPTP systems show the inverse: Moderation on the economic dimension was not associated with a declining rate of repeat votes for major left parties, but with a higher rate of repeat votes instead. Conversely, voters were less likely to desert to minor left or right parties. After moderation on the cultural dimension, however, we find evidence for movements of prior major left voters toward minor left and right parties. Due to the smaller sample size in surveys covering these FPTP systems, we consider these findings more preliminary. But we note that they are consistent with a catch-and-release argument on the cultural dimension, whereas the lack of alternatives especially on the economic dimension may help major left parties retain voters at least for two rounds after moderation.
In the two Mediterranean democracies in our data, we observe a catch-and-release dynamic on the economic dimension and on the cultural dimension as well. Even more than in the case of the FPTP cases, small sample sizes preclude more robust conclusions, but the presence of more alternatives than in FPTP systems – despite potentially more durable ties between voters and parties in industrial societies – may lead to the result of a catch-and-release dynamic as observed here.
10.8 Left and Centrist Voters Respond Differently to Moderation
The results so far analyze the payoff or penalty of moderation strategies for voters across the board. But from the vantage point of examining the composition of a party’s electorate and the role of different groups of voters, ranging from those with solidly left identities to those in the political center, understanding the differential impact of moderation on different types of voters is crucial. We conduct this analysis only for all countries and the Northwestern European subsamples due to the geographic focus of this volume and sample size considerations.
In these analyses (Table 10.4), we find evidence that more leftist,Footnote 17 or “core,” voters are more likely to desert major left parties and switch to minor left parties one round after major left parties moderated on the economic dimension. This dynamic appears in all three samples with sufficient observations. Contrarily, more centrist voters did not respond systematically to moderation. This is consistent with a “release” dynamic for left voters and, potentially, a catchall dynamic for more centrist voters. Additionally, the heterogeneity of these findings highlights the value and importance of differentiating between voting groups that is only possible with individual-level analysis. On the cultural dimension, we find no systematic differences between how more leftist and centrist voters responded to moderation.
| Effect of moderation t − 2 to t − 1 along the economic left–right dimension | |||
|---|---|---|---|
| Respondents in … | On major left, then major left | On major left, then minor left | On major left, then right |
| Full sample | Negative for Left voters | Positive for Left voters | Marginally positive for Left voters |
| NWE | Negative for Left voters | Positive for Left voters | Marginally positive for Left voters |
| NWE+ | Negative for Left voters | Positive for Left voters | Marginally positive for Left voters |
Notes: This table summarizes results from regressions with our main specification (Tables 10.A2–10.A4) but with an interaction term between moderation and a binary indicator for left voters, estimated on the respective subset.
Abbreviations: NWE: Nordic and NW European PR democracies; NWE+: NWE plus ICE, IRL, NZD.
Subsamples for FPTP and Mediterranean democracies not estimated due to small subsample size.
10.9 Moderation and Voting for all Left Parties
As we note earlier in this chapter, catch-and-release dynamics can be damaging for individual major left parties but may also have less impact on policy outcomes if major left parties lose voters only to other left parties and, therefore, any “release” of voters does not weaken coalitions of left parties. In fact, moderation of one major left party may be a winning strategy for left coalitions if it can attract voters from outside this coalition (Hjorth and Larsen 2022). In Table 10.5, we explore part of this possibility in separate analyses with a different sample and outcome variable.
| Effect of moderation t − 2 to t − 1 on voting for major or minor left, then major or minor left | ||||||
|---|---|---|---|---|---|---|
| Along the economic left–right dimension | Along the cultural lib-cons dimension | |||||
| Respondents in … | All voters | Left voters | Non-left voters | All voters | Left voters | Non-left voters |
| Full sample | … | … | … | Positive | … | Positive |
| new | … | … | … | Positive | … | Positive |
| NWE+ | … | … | … | Positive | … | Positive |
Notes: This table summarizes results from regressions with our main specification (Tables 10.A2−10.A4), but with a different outcome variable: voting for any major or minor left party at t − 1 and again at t.
Abbreviations: NWE: Nordic and NW European PR democracies; NWE+: NWE plus ICE, IRL, NZD.
Subsamples for FPTP and Mediterranean democracies not estimated due to small subsample size.
Here, we define our sample as those survey respondents who voted for any left party at t − 1 (and not just the major left party in the respective country). The outcome of interest is also voting for any left party at t. We find that major parties’ moderation on the economic dimension does not lead to voters abandoning the Left. This applies to all voters and the subgroups of left and centrist voters alike. On the cultural dimension, however, we find that moderation may indeed pay off for the Left as a whole: Parties that moderated on this dimension did not lose voters, but in comparison to those parties that did not moderate, moving to the center increased the odds that non-left voters stayed with the Left overall.
10.10 Additional Analyses and Benchmarking
In addition to distinguishing between left and non-left (or centrist) voters, we also repeat our main analyses (Tables 10.A2–10.A4) with an additional control variable for party attachment. We find the same evidence on catch-and-release dynamics mostly after moderation on the economic left–right dimension. Party attachment may be too closely related to our outcome variable of vote choice because higher attachment likely predicts a more correct recall of prior votes, this additional result serves to mitigate concerns about omitted variable bias.
We also subset the data by class to probe whether working-class voters are less prone to switching than nonworking-class voters with more post-materialist priorities. Small subset samples make these results noisier and less robust. We do find some evidence that moderation on the economic dimension is associated with nonworking-class voters leaving major left parties in Northwestern Europe, but not in the FPTP countries. Working class voters do not respond negatively to moderation on this dimension and were more likely to stay with major left parties in the FPTP countries compared to settings where these parties did not moderate. On the cultural dimension, we find some weak evidence that moderation reduced defection to the Right among lower-income voters.
Our main results show a small negative incumbency effect for major left parties; voters penalized major left parties across the board during the time period of this study. We probe the nature of this effect further by conditioning incumbency effects on economic performance.
These analyses in Table 10.6 mostly reveal that negative incumbency effects are due to incumbents presiding over periods of low economic growth. Once again, small sample sizes do not allow for more robust subgroup analyses or exploring the impact of moderation in different growth scenarios. But the available results suggest that holding all else constant, poor economic performance drives former voters away from major left parties, and high economic performance under major left parties does not equally work to keep voters with these parties. In combination with our findings on moderation, this pattern invites additional research to tease out the role of moderation under low and high growth conditions.
| Incumbency effect under … | ||||||
|---|---|---|---|---|---|---|
| Low growth | High growth | |||||
| Respondents in … | On major left, | On major left, | On major left, | On major left, | On major left, | On major left, |
| Then major left | Then minor left | Then right | Then major left | Then minor left | Then right | |
| Full sample | Negative | Positive | Positive | … | … | |
| NWE | Negative | Positive | … | Negative | … | Positive |
| NWE+ | Negative | Positive | Positive | … | … | Positive |
Notes: This table summarizes results from regressions with our main specification (Tables 10.A2−10.A4), but with an interaction term between incumbency and a binary indicator for below (vs. above) average economic growth in the year preceding the election.
Abbreviations: NWE: Nordic and NW European PR democracies; NWE+: NWE plus ICE, IRL, NZD.
Subsamples for FPTP and Mediterranean democracies not estimated due to small subsample size.
In substantive terms, and when statistically distinguishable from 0, we find point estimates for the impact of moderation on vote choice to be mostly around two to four percentage points. This is not a trivial change. If about 9 percent of respondents in the data switched from a major left to a different party or abstained (see Table 10.2), then about one-third of this group can be attributed due to a change in party positions. Similarly, a three-percentage point change in a party’s vote share (following the benchmarking previous discussion) due to moderation is considerable given (a) the other potential influences on changes in parties’ vote share and (b) the typical range of changes in vote shares of several percentage points.
10.11 Summary
The analyses reported in this chapter provide some new, nuanced evidence about the effect of moderation strategies for major social democratic parties in industrialized and postindustrial societies in the past decades. We find the following:
The longer-term impact of moderation appears to hurt major left parties. We find evidence mostly for a catch-and-release dynamic (H2). Moderation on the economic dimension decreased the propensity of previous voters to stay with that party in the subsequent election, consistent with the catch-and-release hypothesis.
Moderation along the cultural dimension hurts major parties less but also drives voters away to minor left parties.
Party systems matter: Moderation hurts major left parties more when voters can choose from a larger menu of competitive parties on the Left.
Left (core) voters are more susceptible to catch-and-release dynamics, but more centrist voters do not respond positively enough to moderation to make up for the loss of left voters.
Catch-and-release dynamics for major left parties do not usually lead to a net positive for the Left overall.
These results mostly support the catch-and-release hypothesis. They also strongly suggest that analyses of voter responses to parties’ repositioning should consider effects beyond the election immediately following a change in parties’ positions. At the same time, the findings open the door for more fine-grained analyses and additional research, to which we turn next.
10.12 Limitations
The findings reported earlier contribute evidence to long-standing debates about benefits and costs of moderation strategies and the importance of longer-term dynamics in studying voter behavior. At the same time, this version of our study is limited by a number of factors that offer a path forward for future research.
First, the findings reported here treat parties’ moderation strategies in isolation from each other. In our empirical specification, a party’s moderation directly influences whether voters choose this party. But party competition takes place in a relational environment, where voters evaluate one party’s position as relative to other parties’ position. We try to address this to some extent by including a measure of party system polarization in our models as well as conducting separate analyses for different electoral systems (PR vs. FPTP). Following research which finds that the relative ideological distinctiveness of rival parties affects vote choice (Green Reference Green2015), levels of class voting (Evans and Tilley Reference Evans and Tilley2012a, Reference Evans and Tilley2012b; Jansen et al. Reference Jansen, Evans and Dirk de Graaf2013), and party attachments (Lupu Reference Lupu2016), other current studies, such as Spoon and Klüver (Reference Spoon and Klüver2019), focus on convergence of parties rather than individual party positions. Merging these two approaches – incorporating relational positions while still maintaining a focus on individual party strategies – would extend this research and offer more nuanced insights in the effects of moderation strategies.
Second, our analyses as reported do not incorporate other contextual factors at the level of partisan competition or at the country level. Such factors may include the strength of unions, international constraints on policy, or other economic factors beyond growth and unemployment that might influence vote choice. The data used in our analyses also largely precede the 2015–16 increase in asylum applications in many European countries, which facilitated heightened attention to the sociocultural dimension among many parties in the region.
Third, vote choice in our analyses is structured as a binary choice between voting for major parties and select “other” choices. Recent electoral trends, though, support the notion that party systems are more fluid than our rigid distinction between major and minor parties allows.
Lastly, and partly due to sample size consideration, this chapter only explores a small selection of subgroup effects. It is likely that not all voters respond to moderation the same way. We explore such subgroups only with regard to left and more centrist voters, but other contributions to this volume and recent studies such as Abou-Chadi and Hix (Reference Abou-Chadi and Hix2021) suggest that there are several other types of groups that might structure responses to party moderation: gender, age, race, occupational class, or union membership all are important to examine in more depth.
10.13 Discussion and Outlook
This chapter is motivated by the observation that social democratic parties suffered at the polls following catchall moderation strategies in the 1990s even though research in political science suggests that moderation is a beneficial strategy for major parties. Our goal is to evaluate whether an approach that is more sensitive to temporal dynamics and individual voting behavior could reconcile this perceived trend with conventional wisdom about party competition. The findings suggest that voters – as captured in election studies – likely punish major left parties for moderation in the second election after parties moderated, and thus are both attentive and responsive to shifts in parties’ positions. Moderation can elicit different changes depending on the dimension of contestation, though. Voters’ punishment appears to be a response to moderation on the economic dimension, the neoliberal turn of social democratic parties. In the data analyzed in this chapter, we see no punishment for moderation on the cultural dimension; instead, during the time period under consideration, moderation on the cultural dimension may retain new voters.
This insight should serve as a starting point for future research investigating how voters respond to changes in party positions over time, and whether these changes create long-term adjustments in perception and, subsequently, behavior in (potential) voters. A key challenge for such research is a lack of data on how the same individuals view and respond to parties at different points in time, beyond just two electoral cycles. The current chapter is limited to exploring whether voters stayed with, or switched away from, a party in two consecutive elections. Yet, recent reports from elections around Western Europe abound with stories of voters who turned away from parties for which they had voted for a long time. This has materialized, for instance, in unprecedented dramatic losses of social democratic parties in the Netherlands, France, and Germany in 2017. While the approach chosen in this chapter does not yet allow us to show definitively whether moderation drives individual voters away from major parties in the longer run, and especially if parties recalibrate their positions, it still offers a first glimpse into when and for which voter groups the benefits of moderation wear off.
Our findings also resonate with many of the conclusions in other chapters of this volume, not least in illustrating the complex trade-offs involved in social democratic parties’ choice of electoral programs (Abou-Chadi, Häusermann, et al., this volume) and the ramifications of these programmatic decisions for a party’s broader strategic objectives (Häusermann and Kitschelt, this volume). Moderation on the economic dimension by Social Democrats in our analyses sheds former voters to green and radical left parties slightly more than it does to the Radical Right. This reinforces the significance of “new left” competitors for voters in the left sector (Abou-Chadi and Wagner, this volume; Bischof and Kurer, this volume). It is also consistent with Abou-Chadi and Wagner’s finding that those who switched away from major left parties were disproportionately centrist (which we also find in our estimates for ideology in Tables 10.A2–10.A4).
We also stress the risks of vote loss in relation to moderation on the economic dimension of competition, if the goal is vote maximization as a party (e.g., Bremer, this volume). However, as the editors note in the introduction (Häusermann and Kitschelt, this volume), in some scenarios social democratic parties may opt to pursue a programmatic package that increases the electoral size of the left bloc as a whole, which requires consideration of the broader strategic context across party systems. But even here, the findings we report in Table 10.5 do not generally recommend programmatic moderation as a strategy for the left bloc. Our chapter illustrates that the programmatic choices of the present continue to resonate with social democratic partisans beyond the immediate electoral cycle.
11.1 Introduction
Explaining the electoral success of political parties is a daunting undertaking. Complexity of each actor’s decision-making situation and limited knowledge about the parameters that affect the outcomes of each strategy haunt efforts to identify optimal strategies. Theory building shares this predicament with the players, reflected in the current state of the art to examine the electoral consequences of strategic interaction among competing parties. In this chapter, we explore three avenues to shed some light on the relationship between social democratic parties’ strategic interaction with competitors and their respective electoral payoffs.
We start from premises of spatial theories of party competition but hypothesize only behavioral relations between party choices and electoral outcomes, not strategic equilibrium configurations. Nevertheless, we find that the electoral payoffs of certain strategy configurations look like Nash equilibria, but then pose the puzzle that many parties do not follow them. We proceed in three steps. First, holding all other parties’ positions constant, do party positions closer to the center of a policy dimension – where empirically most voters are located – pay off in electoral terms? And does this effect vary across relevant dimensions of party competition?
Second, we examine the relations between social democratic parties and their competitors more closely. Being close to concentrations of voters should boost a party’s electoral take – provided competitors are not fishing in the same waters. Hence, does distance of parties from competitors improve their electoral fortunes? Taking spatial considerations of the first two steps together, are parties electorally better off if they place themselves closer to the center of the policy space, while simultaneously facing only distant competitors?
The third step is the most complicated one as it seeks to identify the electoral consequences of two focal parties – a moderate left (social democratic) and a moderate right (conservative or Christian Democratic or People’s) party – simultaneously choosing positions in a multiparty field. Party strategists (and analytic observers) may study these electoral consequences not just for the individual parties but also for “fields” or “sectors” of multiple political parties with different, but overlapping and adjoining policy appeals. A party’s strategy may have rather different electoral payoffs for the party itself than the field of competitors in which it is situated.
Section 11.2 will detail our theoretical considerations and tentative hypotheses. Section 11.3 introduces our data sources, before exploring our questions itemized earlier, in successive order (Section 11.4). Section 11.5 concludes with speculations about how to improve this altogether quite unsatisfactory exploration.
11.2 Theoretical Considerations
Ideally, party strategists would like to know what their own party’s electoral payoffs will be given a range of strategies from which their party may choose and a range of choices from which their competitors may select in an otherwise stable environment, for example, characterized by a fixed voter preference distribution. Also, ideally, the resulting electoral payoff matrix for all parties will yield for each party a unique choice that results in a strategy configuration such that no individual party can improve on the outcome by unilaterally changing its strategy (Nash equilibrium).
Even in a simple world of two parties and one policy dimension, deriving an equilibrium of party strategies rests on a large number of additional assumptions (Grofman Reference Grofman2004). Once one or several complicating considerations – such as multiple policy dimensions, voter abstention, different time horizons over which utilities are maximized, heterogeneous objectives (vote, office, or policy), or differential voter distributions on dimensions – are factored in, the aspiration to find a unique or very small set of strategy equilibria come to naught. The possibility of entry of new parties and multiparty competition thwarts the identification of unambiguous analytical equilibrium strategies for parties to maximize their votes in most circumstances.
Political scientists have pursued at least three strategies to cope with this situation. The first is to extent formal models by one complication at a time and – with further model restrictions – derive strategic equilibria, such as Roemer’s (Reference Roemer2001) Party-Unity Nash Equilibrium (PUNE) in two-dimensional spaces. But also in this model an overwhelming number of empirically implausible assumptions is still needed despite strenuous formal complexity.Footnote 1 A second strategy is to impose behavioral features of voters on models, and measure these as empirical input in the prediction of optimal party positions, such as estimations of voters’ discounting of party positions, their affective party identification, and their propensities to abstain from voting (Adams et al. Reference Adams, Clark, Ezrow and Glasgow2004). But the critical moving parts driving predictions here are the contingent behavioral regularities the variance of which would need to be theorized to generate a satisfactory explanatory account.
A third strategy is to abandon the equilibrium expectation and to run simulations of parties’ behaviors in agent-based models with constructed actor rationales and preference spaces (Laver Reference Laver2005; Laver and Sergenti Reference Laver and Sergenti2011). These simulations are instructive, when plausible assumptions yield verisimilitude, that is, outcome patterns approximating real life data. But often enough even small changes in the model constructions lead to vast changes in the simulation runs.
All of these are reasonable, instructive, and worthwhile attempts to cope with a difficult intellectual challenge, and we do not have to offer a superior alternative. Instead, we pursue here a fourth strand of literature one might call “behavioral party competition theory.” It uses a loose set of spatial assumptions about how voters value congruence of preferences with their parties of choice in order to study observable patterns of party strategizing. This channel of investigation has been mostly applied to studying the parties’ choices of strategies contingent upon other parties’ strategies and movements in public opinion in the policy space. For example, do parties adjust their strategies to mean voter movements or those of their own electorates, and which parties follow one or the other benchmark?Footnote 2 And how do parties react to other parties’ positional changes over time?Footnote 3
Relative few studies, however, have examined the relationship of strategy choice to electoral outcomes, and particularly the electoral payoffs for each party that result from their simultaneous choice of strategic appeals.Footnote 4 And these existing studies analyze a focal party’s electoral payoffs contingent upon the presence or absence of competitors, conceived as party families, but not based on the strategic positions of such competitors that results in a particular configuration of strategies with the focal party in the competitive systems. Our first two empirical steps adopt this common framework as well: Examine how a focal party’s electoral payoffs vary with its strategic choices, without examining modifications of other parties’ strategic choices. Our final step, however, attempts to inch toward exploring the electoral consequences of strategic interaction among parties.
To explore the questions outlined earlier, we rely on behavioral spatial theory of party competition to derive a small set of guiding hypotheses. Spatial theories of voting have to make many simplifying assumptions. Among the most important ones for our application are the following:
Political space
◦ Political competition occurs in a low-dimensional issue space. We assume a two- or three-dimensional space (Kitschelt and Rehm Reference Kitschelt and Rehm2014). For some purposes, the second and third dimensions can be folded together, but not for others.
◦ An “economic” dimension of distributive choices (G1: “greed”), advocating more or less redistributive government intervention, correcting spontaneous results of market processes in terms of actors’ income and wealth.
◦ A “societal” dimension of sociopolitical governance (G2: “grid”) determining how much priority and respect policy accords to individual citizens’ autonomy in terms of rights and liberties, whether they concern due process (civil liberties), kinship/family relations, or forms of political and cultural expression.
◦ A “citizenship” dimension (G3: “group”) defining criteria to qualify for membership in the polity either in terms of very broad, thin universalistic criteria (“cosmopolitan”) or in terms of narrower, denser, more specific particularistic criteria (“parochial”).
◦ The first dimension is typically the most salient dimension, but the robustness of electoral payoffs across dimensions should be explored.
Voters
◦ Voters are roughly normally distributed on each dimension. There may be no unique median voter in multidimensional spaces, but there is a sort of median “yolk,” a small area in a multidimensional space around the midpoint of all dimensions, where many voters on all dimensions are located.
◦ Voters’ positions in the policy space are exogenous to party positions.
◦ Voters choose parties that are spatially close to them (on issues that matter to them).
Parties
◦ Parties know voters’ positions.
◦ Parties know other parties’ positions.
◦ Parties can only move incrementally in the policy space.
◦ Parties mostly seek votes rather than office or policy. But where the benefits of office-seeking or policy-seeking strategies are high and/or the costs of electoral losses due to vote-seeking strategies are minimal, parties may diverge from pure vote seeking. For example, parties may want to promote a “field” of parties that together could dominate policy and/or executive government office, if the individual electoral costs for the focal party are modest.
With these assumptions made, what follows for party “strategy?” By strategy we mean a vector of positions that parties adopt on the different policy dimensions itemized above, according more or less salience to one or the other. In spatial theory, party strategies yield differential electoral payoffs for parties contingent upon other parties’ strategies, determining what share of voters ends up being closest to each party (capturing voters inside its Voronoi tessellation: Laver Reference Laver2005; Laver and Sergenti Reference Laver and Sergenti2011). A party’s electoral payoff, therefore, is a function of (1) the distribution of voters in the policy space, (2) its own position in the policy space, and (3) the position of other parties in the policy space. This makes electoral performance a strategic problem.
11.2.1 The Electoral Payoffs of Absolute Party Positioning
We advance two hypotheses to account for variable electoral payoffs from strategic choices. First, proximity to the center pays off. As per our (realistic) assumption that voters cluster in the middle (or core area, or “yolk”) of the policy space, taking centrist positions promises higher vote shares. Ceteris paribus, dipping into support in the middle tier of a policy dimension, therefore, may yield electorally favorable results, whereas at the outer periphery of the issue dimensional space, even large distances between party strategies deliver only modest electoral returns.
Hypothesis 1: All else equal, parties near the center of gravity (“yolk”) attract more electoral support than parties situated toward the outer periphery of that space with lower density of voters. (Median Proximity Hypothesis)
Contrary to the hypothesis, centrist strategies may backfire because positioning in the policy space is a strategic choice involving several players. For example, if many parties adopt centrist strategies in the same election, they each would only get a small slice of the “yolk” of voters. Alternatively, centrist strategies of the main players may incentivize extreme parties to move inward as well, offsetting any gains from moderation. Centrist strategies may also lead to abstention because voters do not perceive meaningful differences between parties. Clearly, there are countervailing forces that promote a dispersion of political parties (Adams et al. Reference Adams, Merrill, Zur, Curini and Franzese2020). This may seriously diminish the advantage of centrist political strategies (Zur Reference Zur2021).
11.2.2 The Electoral Payoffs of Relative Party Positioning
Second, distance to competitors pays off. If a large share of voters is located in a centrist yolk of a multidimensional space and voters choose parties close to their personal ideal points, many parties may try to win a slice of that centrist pool. Therefore, vote-seeking parties should take into account the position of their “neighboring” parties. Consequently, parties may seek a somewhat “eccentric” programmatic position on at least one salient dimension of competition – with options G1 through G3 itemized earlier – that distinguishes them from their competitors, but still in the vicinity of a considerable vote share. The greater is a party’s Voronoi tessellation in the electoral space, that is, the space in which voters’ ideal points are closer to the focal party than to any other, the larger is the share of votes that the party is likely to receive. This is a strategy of “product differentiation” from other parties (Kitschelt Reference Kitschelt1994, chapter 4) and informs our second hypothesis.
Hypothesis 2: A party’s electoral success is a function of the distance between its own issue positions and that of its closest neighbors. All else equal, greater distances result in greater electoral payoffs.
11.2.3 Strategic Interaction and Electoral Payoffs
We will explore this basic setup for moderate left parties, such as Social Democrats, and moderate right parties in knowledge society democracies. Hypotheses 1 and 2 concern the electoral payoffs of party positioning, but they are only the first step of analysis, as they do not explicitly consider the strategic interaction among parties. In order to bring in how the payoffs of choices of individual parties depend on the choices of other parties, let us introduce a simple setup.
First, the multiparty systems of contemporary Western democracies is divided into two “fields” of parties, a “left” field and a “right” field. Within each field, there may be several parties that distinguish themselves in terms of extremism or centrism of positions on two or three issue dimensions. The left field incorporates parties that position themselves from the center to an extremely redistributive position on economics, a highly libertarian position on societal governance, and an inclusive-cosmopolitan position on citizenship.Footnote 5 In terms of party families, this field includes more extreme parties – Radical Left (RL) socialist or post-communist parties with firmly redistributive positions and Green Left (GL) parties with highly libertarian and cosmopolitan appeals – as well as a Moderate Left (ML) with somewhat more centrist positions on all of these dimensions that typically belong to the family of social democratic or labor parties. The right field covers parties that extend from the center to the extremes in terms of affirmation of market liberalism on economic distribution, authoritarian and traditionalist positions on societal governance, and particularistic-nationalist positions on immigration and citizenship. This field encompasses a Moderate Right (MR) on all of these dimensions, consisting of party families with Conservative, Christian Democratic, Agrarian or Liberal labels, as we well as Radical Right (RR) populist parties with more extreme positions on authoritarian societal governance and exclusive national citizenship, combined with somewhat heterogeneous centrist to right-wing economic positions.Footnote 6
Second, consider that the largest, most important moderate parties within the left and right “fields” have a choice between a centripetal (MOD = moderate) strategy, primarily trying to attract voters from the moderate parties in the opposite field, and a somewhat more centrifugal (RAD = radical) strategy, competing against parties substantially more extreme on one or several dimensions within their own fields. With two parties – ML and MR – and two strategies – MOD and RAD – there are four possibilities:
MOD/MOD: If both parties choose the median-yolk centrist strategy MOD, they will split the pool of voters about equally between the two fields. They follow the proximity to the center rule, albeit with some accommodation to the strategic differentiation (“eccentricity”) rule: To prevent abstention due to indifference, there will be some distance between ML and MR in the centrist yolk of the voters’ preference distribution.
RAD/RAD: ML and MR will also split the pool between the fields equally, if they both opt for the more radical, centrifugal strategies RAD.
MOD/RAD or RAD/MOD: If one of the parties opts for the RAD, noncentrist strategy, but the other moves toward the MOD strategy, the latter will win. At the level of the “fields” of parties, then, moderate strategies tend to be the vote maximizing options for the ML and MR parties, yielding the following rank ordering of payoffs among strategy dyads from the vantage point of the party whose strategy is listed first:Footnote 7
(1) MOD/RAD > MOD/MOD or RAD/RAD > RAD/MOD
These payoffs are for the entire focal party’s “field,” not the party itself. Whether the ML and MR’s moderate strategies, however, also satisfy these parties’ individual aspirations to maximize their own vote shares, and how big the margin is by which a MOD strategy improves on a RAD strategy for the focal party, compared to the electoral gains other parties in their own field are likely to make, depends on the precise distribution of voters within the fields as well as the strategic capacity of the more extreme parties to extract voters from their centrist neighbors.
Can the extreme parties “squeeze” the ML/MR parties in their fields by adopting more moderate positions themselves, if ML/MR choose MOD as their strategy? If so, this would limit the electoral yield of the MOD strategy for the ML/MR parties, if not make such moderate options unattractive. In limitational cases, if extreme parties can squeeze them, ML/MR parties’ choice of vote share may improve only the share of their more extreme field members and the electoral take of the field as a whole, but little or not at all the individual ML/MR parties’ vote share. By contrast, if extreme parties within their respective fields cannot squeeze their moderate field members, most of the electoral benefits of strategic moderation by ML/MR parties may accrue to the latter. Table 11.1 illustrates the different strategic situations ML/MR parties may face with fictitious electoral payoffs that may result for them contingent upon whether extreme within-field competitors cannot (Panel A) or can (Panel B) squeeze their moderate field member’s support. The first two lines of payoffs in each quadrant are for ML and MR parties as well as all of the more extreme members RL/GL and RR within their own fields. The final cursive line in each cell summarizes the total take of the left and the right fields given ML and MR strategies.
| Panel A. RL or RR parties cannot “squeeze” ML or MR, if latter choose moderate strategy | |||
|---|---|---|---|
| Strategic position of the Moderate Right (MR) | |||
| MOD | RAD | ||
| Strategic position of Moderate Left (ML) | MOD | ML 30 / MR 30 RL 20 / RR 20 Left 50 / Right 50 => Nash equilibrium | ML 37 / MR 24 RL 23 / RR 16 Left 60 / Right 40 |
| RAD | ML 24 / MR 37 RL 16 / RR 23 Left 40 / Right 60 | ML 30 / MR 30 RL 20 / RR 20 Left 50 / Right 50 | |
| Panel B. RL or RR parties “squeeze” ML or MR, if latter choose moderate strategy | |||
|---|---|---|---|
| Strategic position of the Moderate Right (MR) | |||
| MOD | RAD | ||
| Strategic position of Moderate Left (ML) | MOD | ML 24 / MR 24 RL 26 / RR 26 Left 50 / Right 50 | ML 32 / MR 25 RL 28 / RR 15 Left 60 / Right 40 => Nash equilibrium |
| RAD | ML 25 / MR 32 RL 15 / RR 28 Left 40 / Right 60 => Nash equilibrium | ML 30 / MR 30 RL 20 / RR 20 Left 50 / Right 50 | |
If ML and MR parties maximize their field’s return, the (hypothetical) result of strategic interaction looks like a Nash equilibrium. Both ML and MR will choose MOD and divide the voter pie equally. Any party’s choice of RAD would be to the field’s detriment, as it would result in a clear victory of the opposite side, if that chooses MOD. When we deal with real numbers, based on observed elections, later, the entries in the quadrants, of course, represent only averages of heterogeneous individual election observations. Let us therefore call what looks like Nash equilibria, when aggregated, just “quasi-Nash” equilibria to highlight the artificiality of the average account.
Examining the individual ML and MR level of parties’ electoral payoffs, in panel A extreme parties within each field are highly constrained in benefiting from their moderate field members’ choice of MOD strategy. This configuration leads to the same ML/MR strategy choice as at the field level: The quasi-Nash equilibrium is a MOD/MOD strategy dyad. When extreme parties in each field are strategically immobile, more than half of the aggregate field benefits of strategic moderation is reaped by the moderate parties themselves. Thus, for example, when MR (ML) chooses MOD, the benefit for ML (MR) of moving from RAD to MOD is 6 (going from 24 to 30), while the benefit of the more extreme parties by attracting some of ML’s (MR’s) more extreme former voters is 4.
The situation is quite different in panel B. Again, the field-level payoffs are the same as in panel A. But now extreme parties are flexible and “move in” on more centrist ML and MR parties, were the latter to choose MOD strategies. Thus, with MR choosing MOD, for ML to go from RAD to MOD increases the left field by +10, but more than the entire gain is pocketed by the extreme RL parties, not ML. Even if a less extreme numerical example was chosen, moderate parties might think twice about moving to more centrist positions when most of the electoral field gains flow to more extreme parties in the same field. In this extreme example of panel B, what also evaporates is the quasi-Nash equilibrium at MOD/MOD. There is no unique Nash equilibrium, but two equilibria: The strategic interaction may reach either the RAD/MOD or MOD/RAD equilibrium, from which no party can unilaterally improve.Footnote 8
Therefore, in our hypothetical examples, the optimal strategies depend on whether the situation resembles panel A or B in Table 11.1. In panel A – when the middle parties (ML and MR) can move toward the center without their more extreme parties in the same field following them – the unique Nash equilibrium is MOD/MOD. In panel B – when the middle parties lose vote shares toward their field competitors when becoming more moderate – the two equilibria are MOD/RAD and RAD/MOD. Even the dominated strategy RAD/RAD may happen if parties play mixed strategies in the two Nash equilibria scenario of panel B.
Given that the payoffs in individual cells of Table 11.1 are averages of many observations of party dyads, it cannot be asserted for any individually observed dyad that parties chose their optimal strategies. But if parties are generally following a vote maximizing strategy, more observations should be clustered in the MOD/MOD cell for both party- and field-level payoff. There may be a second cluster in the RAD/MOD or MOD/RAD cell at the individual party level, if that turns out to deliver more favorable electoral results for the RAD choosing ML or MR party, as depicted in panel B, or at least incur only small electoral losses for such parties so as to suggest that often enough parties may choose this dyad under uncertainty over the precise outcomes.
What should not occur, if parties behave according to this simple spatial theory, however, is a high concentration of observations in the asymmetrical RAD/MOD and MOD/RAD dyads, if these dyads empirically deliver – on average – highly unfavorable electoral returns to whichever party – ML or MR – happens to choose RAD. As will emerge later in this chapter, many social democratic parties choose this unfavorable dyad RAD/MOD with detrimental electoral consequences. This fact will require additional theorizing and empirical investigation to probe into the reason for these anomalies.
11.3 Data and Concept Operationalization
We rely on two data-sources for our analysis: ParlGov (Döring and Manow Reference Döring and Manow2019) election results and all available waves from the Chapel Hill Expert Survey (CHES) (Bakker et al. Reference Bakker, de Vries, Edwards, Hooghe, Jolly, Marks, Polk, Rovny, Steenbergen and Anna Vachudova2015, Reference Bakker, Hooghe, Jolly, Marks, Polk, Rovny, Steenbergen and Vachudova2020; Polk et al. Reference Polk, Rovny, Bakker, Edwards, Hooghe, Jolly, Koedam, Kostelka, Marks, Schumacher, Steenbergen, Vachudova and Zilovic2017). CHES data are available for years 1999, 2002, 2006, 2010, 2014, 2017, and 2019. We use the mean values of expert assessments as measures of party positions, and we carry forward these values between the survey years, and up to 2020 in some cases. (In a few instances, we also carry them backward.) Thus, we have annual data on party positions from 1999 to 2020. We derived a concordance of ParlGov party codes to CHES party codes and merged the party position data into the election result data.
Our unit of analysis is the country-election-year or party-election-year. To maximize observations in the analyses involving positional data, we also keep years 1999 and 2019, even if they are not election years (because these are the earliest and most recent observations from the CHES data).
We use ParlGov’s mapping of parties into party families, though we adjust that mapping to the common party family list employed in the Beyond Social Democracy project. As is common, we classify as left parties those coded as communist (RL), ecological (GL), or social democratic (SD or ML) parties. We classify as right parties those coded as agrarian/Christian Democratic/conservative and liberal moderate right (MR),Footnote 9 or as radical right (RR). Parties not coded into one of these six party families are dropped from the analysis.Footnote 10
We keep the identity of the main social democratic party in a country constant for 1999–2019. The main party on the left (ML) is the social democratic party with the largest cumulative vote share over 1999–2019. In some of our positional analyses, we are interested in a social democratic party’s “main competitor on the right,” which we define as the closest party in the moderate right party family, conditional on it having at least a 10% vote share.Footnote 11 Most of the time, the closest sizeable party to the right of the social democratic party is a moderate right party and a few times even a radical right party, depending on the issue dimension. But since voter flows to- and from social democratic parties are primarily to MR (and GL) parties – not RR parties – we decided to focus on MR parties in the analysis of close relevant competitors on the right. Finally, in some of the positional analyses, we focus on “main parties.” These are parties that were at least once the largest party in their family during years 1999–2019.Footnote 12 The main party on the left is invariably a party belonging to the social democratic family. On the right, however, the identity of the “main” moderate right party (MR) is more diverse and volatile over time, as some right-wing party fields are quite fragmented and several parties qualify for center-right main standard bearer status at different times. As a consequence, the major moderate right party may not be the most moderate in the field.
We approximate the three policy dimensions by the following CHES survey items:
– G1: LRECON (ideological stance on economic issues), with 0 = extreme left, 5 = center, and 10 = extreme right.
– G2: GALTAN (position of the party in terms of their views on social and cultural values), with 0 = Libertarian/Postmaterialist, 5 = center, and 10 = Traditional/Authoritarian.
– G3: IMMIGRATE_POLICY (position on immigration policy), with 0 = Strongly favors a liberal policy on immigration and 10 = Strongly favors a restrictive policy on immigration.Footnote 13
– G2/3, the average of G2 and G3.
We ran all of our data inquiries on a pooled set of sixteen countries, but also separately on the subgroups of countries with different clusters of political economic institutions and performance variables and party system characteristics. We were particularly concerned about the robustness of findings in the nine Northwest European countries in the dataset, sharing highly advanced knowledge economies, encompassing and moderately redistributive welfare states, as well as fragmented, differentiated party systems with a substantial presence of all the relevant party families. Fewer data points are available for the set of Mediterranean polities which include France because of the genesis of features of the party system, particularly the left’s division between socialists and communists, and the relative weakness of green and left-libertarian parties. For Anglo-Saxon party systems, we really have only Britain and its few datapoints can be checked against the rest of the set whether they provide systematic outliers or confirm general patterns. It turns out that in no case the disaggregation into subgroups makes a substantive difference for our findings.
11.4 Findings
11.4.1 Social Democratic Electoral Success as a Function of Absolute Positioning
As a first step, we explore how parties’ vote shares vary with positions they taken on issue dimensions, using the CHES data and items described earlier. It explores whether proximity to the center of the policy dimensions makes a difference for party performance. Are parties closer to the center region of the scale more successful? Figure 11.1 presents the electoral performance of parties (y-axis) in relation to their strategic positions on different policy dimensions, as measured by CHES scores in a recent twenty-year window (N = 98). The figure also depicts a quadratic fit line that indicates the relationship between party positions and electoral payoffs for the full set of observations.
Parties’ positions relative to mean of the scale and their electoral payoff

Let us start with social democratic parties (ML). Their electoral payoffs are roughly associated with the parties’ distance from the center of the policy scale on two of the three dimensions. The highest scoring parties take positions slightly left of center on economic distribution and GALTAN. On immigration, however, the electoral best performers are directly in the center, or slightly to the right of the scale. At the same time, some social democratic parties perform well with a decidedly cosmopolitan position on immigration. Proximity to the center is an asset, with some minor qualification for the immigration dimension.
In a curvilinear pattern, positions of the moderate right (MR) on economic distribution and GALTAN are electorally most profitable at a modest distance from the center beyond which they tail off. This probably reflects that the median voter in most countries and times empirically tends to be located somewhat to the right of the median economic left–right and GALTAN scale point 5.0. Overall, on these dimensions, most MR parties, therefore, are probably no further from the median voter than their ML competitors.
Another factor comes into play to account for the fact that in the subset of highly fragmented Northwest European party systems (Scandinavia, Low Countries, Austria, Germany, and Switzerland), both ML and MR parties tend to reach their optimal electoral returns a modest distance away from the midpoint of the scale (thus generating a curvilinear fit line of the relationship between strategic appeal and electoral returns of ML and MR parties): With a multitude of more extreme competitor in the ML or MR parties’ own broad left and right fields, the electoral costs of moderate field members moving toward the center may be particularly high, as more extreme parties may attempt to squeeze them and attract some of the moderate parties’ supporters. This is a point further explored in our second and third empirical steps.
The immigration dimension offers a slightly different pattern: MR parties with sharply rightist (exclusionary, xenophobic) positions can expect similar electoral returns as MR parties with more moderate positions. This pattern is likely to reflect a rightward skew or simply a greater dispersion of public opinion on this dimension. Also for Social Democrats, there is no optimal distance on the left of the scale midpoint here: The relatively more restrictive their announced positions are on immigration, the better they perform in elections.
Being close to the scale midpoints electorally pays off for ML and MR parties. For the electoral performance of the peripheral parties of the left and right (RL, GL, and RR), by contrast, proximity to the center does not matter much. Here the effort to occupy positions on their side of the conflict dimensions, whether it is economics (RL), GALTAN (GL), or immigration citizenship (RR), take precedence. On average, and without inspecting the precise interaction between more extreme and more moderate parties in each field, as long as the former stay sufficiently far away from the midpoint of the issue dimension scales, their electoral performance shows relatively little variance contingent upon their precise position.
On the extreme right, RR parties exhibit two (mild) modes of electoral support with somewhat different economic appeals – a moderately and a radically pro-market appeal. But they benefit from adopting the most extreme anti-immigration positions. On the left, radical socialist or formerly communist parties (RL) perform well with rather extreme redistributive positions on the economic dimension, albeit better with somewhat less extreme appeals on GALTAN and immigration. By contrast, green and left-libertarian parties (GL) are electorally most successful by approving distinctively radical libertarian GALTAN societal governance positions as well as cosmopolitan immigration positions.
At least on the economic and the sociopolitical governance dimensions, the results speak directly to the hypothesis that “inbound” political parties closest to the center of the scale should care about capturing densely populated centrist spaces of the popular preference distribution.Footnote 14 While the electoral payoffs of “inbound” moderate left and moderate right parties are quite sensitive to their distance from the scale midpoints, this does not apply to the more “outbound” parties in each bloc capturing voters in the peripheries of the three-dimensional space. Because voters are less densely packed there, small variance in parties’ positions is unlikely to leave a big impact on their respective electoral returns.
These patterns are consistent with Adams et al.’s (2006) findings that only moderate left and moderate right “mainstream” parties follow median voter movements. Extending the argument to electoral outcomes, we observe here that more centrist positions on at least two of the three dimensions also pay off in better electoral results for the centrist ML and MR parties of left and right fields, whereas both appear to thrive on somewhat more rightist immigration positions. By contrast, left and right peripheral parties in the multidimensional space receive lower electoral support, but in low-population density areas of the competitive space also show little elasticity of voter support contingent upon their party positions.
11.4.2 Social Democratic Electoral Success as a Function of Distance to Competitors
Hypothesis 2 states that parties benefit from “eccentricity” (Laver and Sergenti Reference Laver and Sergenti2011), that is, occupying positions that are relatively far removed from those of other competitors. To explore this, Figure 11.2 depicts the electoral return of Social Democrats, on the vertical y-axis, as a function of the distance between Social Democrats and different types of competitors, scored on the horizontal x-axis, together with a quadratic fit line. Once again, we report raw distances based on the parties’ CHES scores on the three dimensions.
Parties’ positions relative to ML (Social Democracy) and ML’s vote share

We find that spatial distance of “neighboring” more extreme parties from Social Democrats within their own field payoffs for Social Democrats’ electoral performance. For peripheral parties in the left field (RL and GL), this applies on all three issue dimensions. Notably, the electoral gains for Social Democrats are most steeply positive when they enjoy greater distance to the green and left-libertarian parties’ positions on sociopolitical governance (GALTAN) and on immigration. Social Democracy also reaps payoffs, the further RL parties are away from the social democratic position on the economic-distributive dimension.
One would expect a more complicated electoral payoff situation from the relationship of ML strategies to the main MR party’s appeals. After all, both ML and MR fight for the dense voter distribution in the centrist multidimensional “yolk.” With regard to economic distribution, great distance of ML from MR or even RR does not pay off electorally, as it probably would indicate in many instances not so much that MR or RR parties are distant from the scale midpoint, but that the Moderate Left creates distance by sacrificing proximity from the densest voter distribution in the “yolk.” With regard to the non-economic GALTAN and immigration dimensions, a curvilinear relationship with best payoffs at intermediate distance emerges: Moderate left parties may want to approach their MR competitors too closely to thrive electorally, but they may also want to avoid too large a distance from these competitors. Besides, ML parties would probably have to achieve such large distances at the expense of locating their appeals close to the rich, dense center “yolk” of voter preferences. The dilemma of proximity to the scale midpoint and benefits of eccentricity – distance from MR and RR parties – comes to the fore.
Probably for reasons of high population density in the center of the economic issue space, the curvilinear slope of the fit line indicating ML parties’ electoral payoffs contingent upon strategy distances to MR parties is much flatter than those observed in the social democratic parties’ relations with peripheral “outbound” families inside their own left field. The same might apply to the ML-MR strategic configuration on the GALTAN dimension, where the relationship between distance of MR parties and social democratic party performance is flat to negative. On both dimensions, in the center of the political space, the great density of the centrist voter “yolk” between the two moderate major parties is too attractive to let eccentricity considerations gain too much weight. The Moderate Left benefits from a modicum of distance from the MR, but only within rather tight limitations.
This pattern is even more pronounced with regard to the immigration dimension. Here the policy distance between ML Social Democrats and RR parties is very substantial even at the observed minimum (5 units). As a consequence, further increasing the distance between ML and RR parties beyond that minimum improves social democratic electoral performance initially in only mild fashion, but then reverses into electoral losses with further increases in distance. Very large distances indicate that Social Democrats have abandoned the center to center-right area of the policy dimension where most voters are located in most elections and instead pursue a strident pro-immigration appeal that is popular only to electoral minorities.
In sum, the data suggest that, for social democratic parties, being close to the center pays electorally, as does taking eccentric positions. If an inbound party (ML or MR) moves toward the center, they increase distance to their field competitors (GL and RL or RR, respectively), but they decrease distance to each other. This poses the interesting question whether centrality or eccentricity is more important for social democratic parties. In preliminary empirical explorations, we find that proximity to the scale centers has a substantively greater influence on electoral payoffs for social democratic parties than eccentricity from other parties.Footnote 15
11.4.3 Social Democratic Electoral Success as a Result of Strategic Interaction between Moderate Left (ML) and Moderate Right (MR) Parties
The analysis has so far ignored the strategic interaction between political parties in the issue space, but simply used other parties’ positions as constraints for a social democratic party’s electoral payoff contingent upon another party’s choice. Next, we explore the electoral payoffs of individual parties and whole left and right partisan fields as a consequence of their joint strategic choices, laid out in the discussion of the theory section surrounding Table 11.1. Which dyads of strategic choices by the dominant moderate left (ML) and moderate right (MR) parties within each left and right field yield the highest payoffs for each of them and for each field? Are there quasi-Nash equilibria strategy dyads, and how often do observable party dyads appear to diverge from them? And if social democratic ML or conservative MR parties choose strategies that are manifestly non-quasi-Nash equilibria, when examining the average electoral payoffs of a strategy dyad, are there systematic factors that may account for this divergence of parties from what appears – on average – to be a party’s best strategic alternative?
This is uncharted territory, as far as we can tell, and our dataset contains only a small number of observations.Footnote 16 We therefore approach these questions in the simplest possible way: we only analyze the two large center parties (ML and MR), and we characterize “strategies” (i.e., their position-taking) in binary terms: “radical” (RAD) versus “moderate” (MOD). A moderate position is within a 3-point range (on the 0–10 CHES scales) of a party system’s mean position on a given dimension.Footnote 17 A radical position lays outside that range. Of course, this is an arbitrary definition – both in terms of how to define the origin around which the moderate range is constructed and in terms of the width of the range of moderate vs. radical positions – and we therefore have explored a variety of alternative definitions, with largely similar results. One advantage of the three-point cutoff is that it generates somewhat evenly populated numbers of observations across cells in 2 × 2-tables with four dyads (RAD/RAD; RAD/MOD; MOD/RAD; MOD/MOD).Footnote 18
Table 11.2 provides the payoffs for each MOD-RAD strategic dyad, where the binary strategies are based on the economic dimension.Footnote 19 The table contains three panels, distinguished by different samples. Each panel shows the 2 × 2 table payoffs twice: on the left side for the main centric parties (ML and MR), and on the right side for the entire left and right field, respectively. Cells report vote shares (for ML/MR in the left table, for Left/Right in the right table), above number of observations in the cell.Footnote 20 Each panel also reports column and row totals in terms of number of observations (N) – these are the same in the payoff table for ML/MR on the left side, and for Left/Right on the right side.
| Panel A: Entire sample | ||||||||||
|---|---|---|---|---|---|---|---|---|---|---|
| MR | Right | |||||||||
| MOD | RAD | MOD | RAD | |||||||
| ML | MOD | 28/30 N = 19 | 31/30 N = 26 | N = 45 | Left | MOD | 44/51 N = 19 | 50/43 N = 26 | N = 45 | |
| RAD | 18/21 N = 35 | 30/29 N = 30 | N = 65 | RAD | 35/59 N = 35 | 46/49 N = 30 | N = 65 | |||
| N = 54 | N = 56 | N = 110 | N = 54 | N = 56 | N = 110 | |||||
| Panel B: Sample with ML > 25 pre-1990s | ||||||||||
|---|---|---|---|---|---|---|---|---|---|---|
| MR | Right | |||||||||
| MOD | RAD | MOD | RAD | |||||||
| ML | MOD | 36/35 N = 11 | 31/30 N = 26 | N = 37 | Left | MOD | 47/50 N = 11 | 50/43 N = 26 | N = 37 | |
| RAD | 26/22 N = 8 | 31/29 N = 27 | N = 35 | RAD | 39/51 N = 8 | 46/49 N = 27 | N = 35 | |||
| N = 19 | N = 53 | N = 72 | N = 19 | N = 53 | N = 72 | |||||
| Panel C: Sample with ML < 25 pre-1990s | ||||||||||
|---|---|---|---|---|---|---|---|---|---|---|
| MR | Right | |||||||||
| MOD | RAD | MOD | RAD | |||||||
| ML | MOD | 17/24 N = 8 | N = 0 | N = 8 | Left | MOD | 40/52 N = 8 | N = 0 | N = 8 | |
| RAD | 16/20 N = 27 | 20/26 N = 3 | N = 30 | RAD | 34/61 N = 27 | 45/51 N = 3 | N = 30 | |||
| N = 35 | N = 3 | N = 38 | N = 35 | N = 3 | N = 38 | |||||
Note: Cell entries are vote percentages for row/column. Left payoffs matrix is for ML vs. MR, right payoff matrix is for entire Left vs. entire Right field. Grayed cells are Nash equilibria.
Panel A in Table 11.2 displays the average vote share for MOD/RAD combinations, calculated for all cases in our sample. In panels B and C, payoffs are averaged across cases with “large” and “small” social democratic parties, respectively (averaging more/less than 25% of vote share in the 1980s; N = 72 and 38, respectively).
Building on the proximity and eccentricity hypotheses, ML (MR) parties should perform best, if they position themselves close to the centrist yolks in voters’ preference distribution, albeit at some distance from their MR (ML) competitors, that is, MOD/RAD is best for ML and RAD/MOD best for MR. But these strategy dyads do not constitute quasi-Nash equilibria. The losers having opted for RAD strategies may invariably have incentives to defect from this dyad and opt themselves for MOD strategies. Once a MOD/MOD dyad is reached, parties cannot improve on their average returns reported in Table 11.2 by unilaterally choosing a different strategy.
Examining the right-hand payoff matrices in panels A through C, which report the sum of the vote share for the entire left and right fields, this logic is uniformly borne out both for ML and MR parties. Left fields win their highest vote shares in MOD/RAD dyads, while the opposite RAD/MOD combination is particularly beneficial for right fields. But the quasi-Nash equilibria are, as expected, invariably MOD/MOD dyads.Footnote 21 If all ML and MR parties cared only about the electoral payoffs of their whole fields and had perfect foresight, and the payoff profiles were not just averages, but applied to each and every election observation, then a vote-seeking ML/MR party would never enter any dyad but MOD/MOD. But, at first brush surprisingly, most of the empirically observable strategy dyads are actually not quasi-Nash equilibria (91 of 110), with the predator/sucker RAD/MOD and MOD/RAD dyads accounting for over half of the total (N = 61). Is there any way for theory to account for this striking anomaly?
There are at least three sources of error that may partially account for this result. These are theoretically uninteresting and may occur simply because of measurement flaws as well as limited information of the strategic actors. But they should not produce a particular clustering of observations in dyad configurations that are no field-level quasi-Nash equilibria. First, empirical determination of radical and moderate strategies involves a high level of measurement error. Second, political players face uncertainty about the distribution of preferences and the choices of competing players and therefore may choose strategies erroneously. Third, there is heterogeneity among the observations, while the cell scores only report averages. Examined one by one, in some instances the strategic dyad may in fact have been the optimal electoral choice in that situation.
The manifest concentration of strategies in the “asymmetrical” RAD/MOD and MOD/RAD strategy dyads, however, requires something more than reliance on ignorance and measurement error. The first of these explanations is consistent with spatial theory spelt out earlier, the second is not. First, as indicated in panel B of Table 11.1, RAD strategies may turn out to be electorally optimal for ML or MR parties, albeit much more rarely for their respective fields. This actually may explain the frequency of MOD/RAD dyads in Table 11.2, panel A. The quasi-Nash equilibrium for ML and MR strategy choice is actually MOD/RAD or RAD/MOD. Even in the face of worse performance of the right field of parties, MR parties perform, on average, as well with RAD strategies as with MOD strategies.
But in panel A, the hypothesis that parties maximize their individual party’s vote, not their field’s vote, does not account at all for the social democratic parties’ frequent choice of radical strategies. If Social Democrats were to maximize their individual party’s vote share, they should most of the time prefer MOD and not RAD strategies, judged by the average payoffs of the different strategy dyads. So it is puzzling that the majority of Social Democrats’ strategy choices is RAD (N = 65) and more than half of those end up in the RAD/MOD strategy dyad cell (N = 35) that appears to be particularly disadvantageous from the point of view of electorally maximizing the Social Democrats’ vote share.
Why do Social Democrats so spectacularly opt for a strategy that most of the time does not yield electoral benefits either for their individual parties or for the whole left field in which they are embedded? Beyond measurement error and decision-making uncertainty, two complementary systematic, strategic considerations come into play both of which presume a different utility function of Social Democrats than just maximizing their electoral share. One has to do with maximizing the Social Democrats’ weight within the left field, the other with the party’s bargaining power over policy and executive office.
First, social democratic parties may be the dominant party within the left field, commanding substantially more than half of its total vote of 35–50% of the electorate, or they may be just the largest of several players, including also green and left-libertarian and radical left parties. Where the latter is the case, Social Democrats may figure that radical strategies may attract almost as many or more voters from their more extreme within-field competitors than moderate strategies might deliver from MR parties, netting out for the votes that Social Democrats then might lose to their more extreme left field GL and RL competitors. So relatively small social democratic parties are more likely to take on the gamble of a radical strategy in the expectation of party electoral gain or at most minor loss. By contrast, large social democratic parties may fear that moderate strategies will make them gain few, but critical votes in the center, but lose a lot of within-field votes to the more extreme GL and RL. The empirical implication of this spatial theoretical consideration is that (1) for the most part smaller social democratic parties should be the ones choosing RAD rather than MOD strategies and ending up in the RAD/MOD predicament. Furthermore, (2) when Social Democrats get into RAD/MOD, the losses compared to MOD/MOD should be substantially larger for the larger parties than the smaller parties.
Second, the utility function of social democratic parties may not simply concern vote maximization but also bargaining power over the capture of executive office (cabinet positions) and policy: office-seeking and policy-seeking benefits. While these benefits are affected by a party’s electoral size, what may be more important is its location and proximity to capturing a large share of the centrist voter “yolk” in a low-dimensional space, thereby making moderate strategy attractive, even if it incurs electoral loss. But these bargaining power benefits will incur to Social Democracy only if the entire left field (ML, GL, and RL) is very large and near capturing a substantial share of the median yolk.Footnote 22 At a minimum, such a powerful left field may have to exceed 40% of the total electoral vote. The empirical implication of this consideration is that Social Democrats are expected to be more willing to embrace radical strategies, when the left field is smaller than 40%. In that case, marginal increases of the field – due to Social Democrats’ moderate strategies – are unlikely to significantly boost the Social Democrats’ bargaining power over office and policy. This effect should occur independent of the size of the social democratic party which may sometimes, albeit not always, be collinear to left field size.
Panels B and C of Table 11.2 test the first of the two strategy considerations Social Democrats may undertake, namely the parties’ relative size compared to other leftist within-field competitors.Footnote 23 As a simple operationalization, here social democratic parties that were smaller or larger than 25% of the average vote in the 1990s are separated. In panel B, including strategy dyads where Social Democrats were clearly dominant parties as late as the 1990s, the incidence of the parties choosing radical strategies and ending up in the dreaded RAD/MOD configuration is quite low. This compares to panel C, with all strategy dyads involving social democratic parties that were already smaller than 25% in the 1990s, by contrast, the incidence of radical strategy choice, and of arriving in the RAD/MOD dyad, is much higher. Moreover, comparing the electoral losses Social Democrats incur on average by moving from MOD strategy to RAD strategy are much greater for large than for small social democratic parties. This differential in losses is actually a multiple of the differential in average electoral votes obtained by the large and the small social democratic parties and therefore not simply a general size effect.
The numbers are quite impressive: Of thirty-eight strategy dyads that involve small social democratic parties, twenty-seven end up in the RAD/MOD cell (71%). The equivalent number for the seventy-two strategy dyads with large social democratic parties is eight RAD/MOD events (11%). Moreover, while for small social democratic parties the average electoral difference in yield of MOD to RAD strategies is only 1% (see left payoff matrix in panel C; from 17% to 16%), the equivalent strategic gap among large social democratic parties (panel B) amounts to a whopping 10% of the vote (from 36% to 26%).Footnote 24
Exploring the hypothesis that Social Democrats take bargaining power, not just electoral payoffs, into account when choosing strategies yields dyad electoral payoff patterns similar to those obtained when splitting the strategy dyads into those with large and small social democratic parties and are therefore not displayed here. Where the left party fields are larger than 40% so that Social Democrats as the most centrist force in that field may gain considerable additional bargaining power over policy and executive cabinet office by winning even small new increments of centrist voters from the MR, few social democratic parties choose RAD strategies. By contrast, where the left fields are small, and therefore marginal changes of the Social Democrats’ electoral payoffs do not much alter their bargaining power, there RAD strategies can be found frequently.Footnote 25
11.5 Conclusion
In terms of spatial theory of party competition, the electoral payoffs of different party strategies – based on proximity to the center, distance to competitors, and the interaction of key strategic players in a multidimensional space – look very much like what the theory would predict. Inconsistent with theory, however, parties often choose (or end up in) strategic locations and strategy dyads that are unfavorable to them. Fortunately, at least some of this variance in the choice of party strategies can be explained in terms of the relative field and party-level electoral payoffs that sometimes makes it more attractive to pursue purely self-regarding party strategies, sometimes more field-regarding strategies. Endogenizing this choice, for smaller moderate left parties – and for smaller fields far below capturing majority support of the electorate – the costs of not pursuing a self-regarding electoral party strategy are relative minor or zero, while the benefits of opting for a field strategy – in terms of office and policy seeking – are marginal or nonexistent. Moreover, there may be other than electoral benefits of a radical strategy that come into focus, when electoral losses are mild. A more radical party strategy may rally party activists, or at least craft a compromise between otherwise centrifugal forces of ideological fundamentalism and technocratic pragmatism among the various activist groups contributing to a political party. These organizational and identity nurturing benefits of strategic radicalism in social democratic parties have not been examined in this chapter.
Of course, our findings rest on a still precarious empirical foundation. The small number of observations gives us little statistical leverage. The measurement errors in observing strategies and comparing strategy scores across observations are large. We do not have matching population surveys for each observed instance of party competition to ascertain the precise distribution of voters that affects where vote-seeking parties may want to position themselves. Furthermore, the analysis is purely comparative-static and has not explored a dynamic format to explore how earlier strategy choices may affect later electoral payoffs, and vice versa. More observations (and more sensitive, precise measures) would be needed to explore lags, or a difference-in-difference set up, exploring whether changes in party strategies from one electoral contest to the next result in changes of electoral payoffs, controlling for relevant confounders.
Maybe the greatest handicap of the small number of available observations is that it is difficult to explore the many contingencies upon which the electoral payoff matrices of strategic dyads may depend. As a rough first cut, we could only explore here the size of strategic parties and configuration of party fields (and some geographical disaggregation in robustness checks not displayed in the main text). But the analysis fails to incorporate the consideration of economic conditions in interaction with government incumbency of different parties that surely make a difference for the electoral payoffs of strategy dyads. And there are likely a host of additional theoretically relevant factors that influence electoral payoffs.
What, then, if any, concrete and practical implications follow for the fortunes of social democratic and other parties from the tentative results of the strategic competition analysis? Our analysis confirms a critical finding running through most of the chapters in Parts I and II of this volume, namely, that the contest for votes in the center of the political space remains critical for Social Democrats. Depending on strategic choice, this is where they are likely to lose or gain significant numbers of voters for themselves and the entire left field. At the same time, and seconding the individual-level voter analysis in Polk and Karreth’s chapter in this section, in many instances it is far from obvious that moderate social democratic strategies are always optimal from the perspective of vote-seeking, self-regarding social democratic parties. Whatever voters Social Democrats may attract from the moderate right with moderate strategies may be compensated by losses to more extreme radical left or green and left-libertarian competitors within the same field, if not simultaneously, then in subsequent elections. But at the same time, it is only moderate strategies that can grow the left field and give Social Democrats additional bargaining powers over government cabinets and authoritative policy choices, at least where the left field of parties is already large relative to the full voter distribution.
The dilemma to choose between field and party regarding electoral strategies is thus particularly cruel for large social democratic parties. They have the most to win – in terms of bargaining power for the left field over office and policy – from opting for moderate strategies, but also the most to lose, in terms of votes hemorrhaging toward more extreme parties within their own fields, when they choose moderate strategies. Examples are the Danish or German Social Democrats in recent elections: By opting for moderate strategies, they won votes only marginally or even lost some, remaining far below their historic long-term averages, while their more extreme competitors, particularly those combining libertarian-cosmopolitan with redistributive preferences, won additional vote shares.
As a further investigation into this topic, one might explore whether erstwhile large social democratic parties of the post–World War II era that begin to shrink progressively and irreversibly from the 1990s on, also begin to become more tempted to pursue radical party strategies, maneuvering them often into the electorally unfavorable RAD/MOD strategy dyad configuration, as their electoral pull wanes and as they decline to the status of mid-sized parties (<25%) for which small or even moderate improvements of vote share make little difference for their bargaining power over government office or policy.
For small social democratic parties in weak left fields, the strategic dilemma is much less stark. A perfect example may be the Swiss Social Democrats. Over the past decade plus, the party has chosen a comparatively radical strategy. This strategy has resulted in some vote loss, but a mild loss compared to what large social democratic parties have sustained, and one that has barely affected the Swiss party’s bargaining power over office and policy, given the small size of the Swiss left field.
The incentives to choose moderate strategies will be smallest for social democratic parties in large left fields in which such parties have shrunk to the status of relatively small parties, when compared to their historical averages. This applies foremost to the Scandinavian Social Democrats, as well as the German and Austrian parties. In all these countries, parties routinely commanded near or above 40 percent of electoral support and often captured the median voter on one or all dimensions. But in all of these instances, these parties have descended to the level of relatively small parties in still large left fields. It will be most interesting and consequential to see how social democratic politicians in these party systems will cope with the stark choices they are facing in a fundamentally altered landscape of party competition.
12.1 Introduction
Large-scale social and economic structural transformations have hurt mainstream center-left parties in advanced economies over the past few decades.Footnote 1 However, social democratic parties are not only passive victims of these structural transformations, but they can craft and re-craft electoral coalitions by shifting strategically in the programmatic space (Abou-Chadi and Wagner Reference Abou-Chadi and Wagner2019). In the last few decades, many social democratic parties attempted to do this. They modernized their ideological offer and attracted a growing share of the expanded middle classes (Kitschelt Reference Kitschelt1994; Gingrich and Häusermann Reference Gingrich and Häusermann2015; Häusermann Reference Häusermann, Manow, Palier and Schwander2018), most famously by shifting toward the center and embarking on the so-called Third Way (Giddens Reference Giddens1998) in the 1990s.
At the time, this was celebrated as a successful strategy to overcome the electoral dilemma of electoral socialism (Przeworski and Sprague Reference Przeworski and Sprague1986), but eventually, the long-term decline of social democracy continued (Benedetto et al. Reference Benedetto, Hix and Mastrorocco2020). This begs the question of whether social democratic parties benefit or lose from centrist strategies. A large literature shows that moderate positions tend to increase a party’s vote share (Erikson et al. Reference Erikson, MacKuen and Stimson2002; Ezrow Reference Ezrow2005; Adams and Somer-Topcu Reference Somer-Topcu2009; Abou-Chadi and Orlowski Reference Abou-Chadi and Orlowski2016). Following a Downsian logic, successful mainstream parties are said to compete for the median voter (Downs Reference Downs1957a). From this perspective, centrist strategies allow the Moderate Left to broaden its electoral appeal. However, centrist strategies are not only associated with a repositioning in the programmatic space of party competition, but when parties win office, they also involve the implementation of a set of (economic) policies, which have substantial distributive effects. Over time, there may thus be feedback effects that influence the electoral performance of parties that implement them (e.g., Pierson 1993; Gingrich and Ansell Reference Gingrich and Ansell2012).
Adding to earlier chapters in this volume, which mostly focus on programmatic competition, this chapter studies the electoral repercussions of policies that parties implement. Following Schattschneider’s (Reference Schattschneider1935) famous insight that “policies create politics,” the chapter assumes that the policies that governments implement have feedback effects. They create the terrain for political struggle and thus influence the electoral prospects of incumbent and opposition parties alike. The chapter, therefore, studies the electoral consequences of implementing centrist strategies for social democratic parties in the last few decades. Building on research that focuses on the economic consequences of the Third Way (Arndt Reference Arndt2013; Karreth et al. Reference Karreth, Polk and Allen2013; Schwander and Manow Reference Schwander and Manow2017), the chapter focuses on the case of fiscal consolidations. It analyzes to what extent social democratic parties lost support after implementing fiscal consolidations by using data from sixteen advanced economies from 1978 to 2014.
The results suggest that implementing fiscal consolidations mostly hurts social democratic parties. On average, their vote share is lower in elections following consolidations that they implemented themselves. However, not all fiscal consolidations are equal: Social democratic parties lose when they implement spending-based consolidations that cut investment spending or public sector wages. Fiscal consolidations centered around tax increases are not associated with losses. Most forms of fiscal consolidations also reduce the overall size of the “left field” and undermine the ability of the Moderate Left to win office. Overall, this suggests that fiscal consolidations are politically risky for social democratic parties and that fiscal consolidations, which hurt key constituencies of social democratic parties, are particularly costly for them. By diluting the brand of social democratic parties and facilitating convergence with the Moderate Right in economic terms, they contributed to the recent electoral crisis of the Moderate Left (also see Bremer Reference Bremer2023).
To make this argument, the remainder of this chapter is structured as follows. It first reviews the arguments why centrist strategies may either benefit or hurt social democratic parties. It argues that it is important to distinguish policies from programs and to test the feedback effects of different types of policies on the ability of parties to win votes. It then examines the association of austerity, and its various subtypes, with the electoral fate of social democratic parties over time. The final section concludes by highlighting both the implications and limitations of the analysis.
12.2 Capturing the Center: A Viable Strategy for Social Democratic Success?
In advanced economies, social democratic parties have been struggling with the threat of decline for decades. As highlighted in the introduction of this volume, large-scale structural changes have reduced the size of the working class and its electoral relevance for the Left (Fox Piven Reference Fox Piven and Piven1991; Pontusson Reference Pontusson1995; Bürgisser and Kurer Reference Bürgisser and Kurer2021). The resulting electoral realignment made it more difficult for social democratic parties to build winning coalitions (Oesch and Rennwald Reference Oesch and Rennwald2018; Rennwald and Pontusson Reference Rennwald and Pontusson2021).
Yet, parties are not simply victims of structural conditions, but they are also agents of their own fate. Parties operate in a strategic environment and can move in the political space to forge (new) electoral coalitions between different electoral constituencies. For example, as the traditional constituency of social democratic parties shrunk, many social democratic parties modernized their programmatic offer toward the end of the twentieth century by moving toward the center, both on the cultural and the economic dimensions of political competition.
Most prominently, social democratic parties embarked on the so-called Third Way (Giddens Reference Giddens1998). After the end of the Cold War, many Social Democrats accepted capitalism as hegemonic. They did not challenge the underlying faith in markets and assumed that markets could be an instrument to achieve social democratic objectives. The Moderate Left, therefore, adopted liberal economic positions (Callaghan Reference Callaghan2000; Glyn Reference Glyn2001; Pierson Reference Pierson and Pierson2001; Lavelle Reference Lavelle2008; Merkel et al. Reference Merkel, Petring, Henkes and Egle2008), embraced a technocratic and managerial approach to politics, and changed their rhetoric (O’Grady Reference O’Grady2019) in line with the liberal Zeitgeist.
Based on the assumption that voters are located in the middle of the ideological spectrum and that they support the party closest to their position, such strategies are thought to be vote maximizing. In fact, Anthony Down’s (1957a) famous median voter theorem already predicted that parties have an incentive to moderate their positive and converge toward the center. Evidence shows that mainstream parties, indeed, follow shifts in the preferences of the median voter rather than their support base (Ezrow et al. Reference Ezrow, de Vries, Steenbergen and Edwards2011) and that such strategic moves are successful (Somer-Topcu Reference Somer-Topcu2015).
However, centrist strategies do not only involve the strategic repositioning vis-à-vis other parties but also the implementation of policies that have feedback effects. Due to the initial success of the Third Way, many moderate left parties temporarily halted their long-term decline in the 1990s and 2000s and stabilized their vote share. In many countries, the center-left won elections, and thus, at the turn of the century, it controlled eleven out of fifteen governments in the EU.Footnote 2 When in government, social democratic parties also followed through on their promises and implemented centrist policies. What were the electoral effects of these policies?
12.3 Fiscal Consolidations and Brand Dilution
To study the effect of centrist policies, this chapter uses the example of fiscal consolidation. Historically, mainstream center-left parties were associated with Keynesian fiscal policies (e.g., Hibbs Reference Hibbs1977; Scharpf Reference Scharpf1991; Hall 1989). They were ready to use government spending to stimulate the economy and usually less concerned about public debt than the Moderate Right. As Social Democrats moved toward the center, however, they often also accepted fiscal orthodox policies, including fiscal consolidation. As part of the Third Way, they attempted to increase their fiscal credibility (Kraft Reference Kraft2017), but they were also inspired by macroeconomic supply-side ideas that became part and parcel of the Left’s economic paradigm (Bremer and McDaniel Reference Bremer and McDaniel2020). Especially in Europe, in the wake of the 2008 financial crisis, many parties of the Moderate Left endorsed austerity (Bremer Reference Bremer2018) and according to some analyses, became even more likely to implement austerity and retrench the welfare state than the Moderate Right (Armingeon et al. Reference Armingeon, Guthmann and Weisstanner2016; Raess Reference Raess2023).
A large literature suggests that voters are fiscal conservatives and support balanced budgets (e.g., Blinder and Holtz-Eakin Reference Blinder and Holtz-Eakin1984; Peltzman Reference Peltzman1992; Stix Reference Stix2013). Although attitudes vary over time (Barnes and Hicks Reference Barnes and Hicks2021), survey research indicates that elite cues and media frames even make austerity popular (Barnes and Hicks Reference Barnes and Hicks2018; Bisgaard and Slothuus Reference Bisgaard and Slothuus2018). Research on the electoral consequences of fiscal consolidations, therefore, claimed that voters support governments’ efforts to reduce public deficits and debts (Alesina et al. Reference Alesina, Perotti, Tavares, Obstfeld and Eichengreen1998, Reference Alesina, Favero and Giavazzi2019; Brender and Drazen Reference Brender and Drazen2008; Giger and Nelson Reference Giger and Nelson2011; Arias and Stasavage Reference Arias and Stasavage2019). Most famously, Alesina et al. (Reference Alesina, Perotti, Tavares, Obstfeld and Eichengreen1998: 198) even argued that there is “no evidence of a systematic electoral penalty or fall in popularity for governments that follow restrained fiscal policies.” Asking why austerity became the dominant fiscal policy in Europe during the Great Recession, Bansak et al. (Reference Bansak, Bechtel and Margalit2021: 488) similarly suggested that “governments adopt austerity because, contra to conventional wisdom, it is actually a popular response to economic crises among the voting public.”
However, a growing literature documents that fiscal consolidations can be politically costly. Governments strategically time fiscal consolidations, as vulnerable governments avoid consolidations toward the end of the term (Hübscher and Sattler Reference Hübscher and Sattler2017; Hübscher et al. Reference Hübscher, Sattler and Wagner2021). Fiscal consolidations usually imply trade-offs and given these trade-offs, reducing government debt is not a priority for the average voter (Bremer and Bürgisser Reference Bremer and Bürgisser2023). In fact, during an electoral term, fiscal consolidations strongly undermine the popularity of governments (Jacques and Haffert Reference Jacques and Haffert2021; Bojar et al. Reference Bojar, Bremer, Kriesi and Wang2022), especially if they are associated with increasing unemployment, large protest mobilization, or the involvement of external creditors (Bojar et al. Reference Bojar, Bremer, Kriesi and Wang2022). Therefore, experimental evidence shows that a government’s re-election chances decrease if it proposes fiscal consolidation (Hübscher et al. Reference Hübscher, Sattler and Wagner2021), while observational studies indicate that European incumbents were punished for implementing austerity measures during the Great Recession (Talving Reference Talving2017).Footnote 3
The political risks of implementing fiscal consolidations may be especially large for social democratic parties. Existing research stresses that centrist social and labor market policies can undermine the support of their traditional constituency, the working class (Arndt Reference Arndt2013; Karreth et al. Reference Karreth, Polk and Allen2013; Schwander and Manow Reference Schwander and Manow2017). Karreth et al. (Reference Karreth, Polk and Allen2013: 792) use individual-level evidence from Germany, Sweden, and the UK to argue that “gains from the policy shift towards the middle in the 1990s were short-lived and came at the expense of electoral success in the subsequent decade.” Schwander and Manow (Reference Schwander and Manow2017) show that in Germany, the “Agenda 2010” created space for a national challenger party on the left (Die Linke). It helped to entrench the party in the German party system because the Third Way undermined the relationship between the working class and social democratic parties (Arndt Reference Arndt2013).
Following this literature, I argue that implementing fiscal consolidations is electorally costly for moderate left parties (Bremer Reference Bremer2023). Parties are often compared to brands (e.g., Aldrich Reference Aldrich1995; Cox Reference Cox1997; Lupu Reference Lupu2016), which are formed based on what parties say and do (Fortunato and Stevenson Reference Fortunato and Stevenson2013). Party brands provide clarity about parties’ intentions and identity (Ezrow et al. 2014) and facilitate voters’ choices by giving them clear options (Dalton et al. Reference Dalton, Farrell and McAllister2011). They provide voters with shortcuts by helping them to distinguish between different parties, but they are constantly in flux, as parties change their positions and voters update their perceptions of parties.
Historically, social democratic parties had a strong brand. They emerged from the labor movement and were central actors in forging a class compromise between capital and labor in the twentieth century. They built the welfare state (Stephens Reference Stephens1979; Korpi Reference Korpi1983), pursued Keynesian macroeconomic policies that tackled unemployment (Hibbs Reference Hibbs1977; Hall Reference Hall1989), and became seen as protectors of the less well-off (Esping-Andersen Reference Esping-Andersen1985). By using the resources of the state to intervene in free markets, they promised their constituents to protect them from the adverse consequences of unfettered free-market capitalism.
Implementing fiscal consolidations dilutes this brand. Austerity has large distributive consequences because it often leads to welfare state retrenchment and undermines the state’s ability to intervene in markets. For social democratic parties, this creates inconsistencies with the parties’ traditional positions. This is harmful for the competition with the Moderate Right over centrist voters, as it hurts the ability of moderate left parties, in particular Social Democrats, to distinguish themselves. Moreover, it undermines the partisan attachment of “core voters,” which also played an important role in the collapse of established left parties in Latin America following the implementation of liberalizing reforms in the 1980s and 1990s (Lupu Reference Lupu2016; Roberts Reference Roberts2017). In most advanced democracies, both the working and middle classes benefit from the welfare state. Although they often prefer different social policies (Häusermann et al. Reference Häusermann, Abou-Chadi, Bürgisser, Enggist, Mitteregger, Mosimann and Zollinger2022), large fiscal consolidations are against the interest of either group. If social democratic parties are responsible for these consolidations, they are likely to lose support. Thus, I formulate the following hypothesis:
Hypothesis 1: The larger the fiscal consolidations that social democratic governments implement when they are in government, the more they lose in the following election.
However, fiscal consolidations can be achieved in different ways. First and foremost, governments can reduce their deficit either by cutting spending (spending-based consolidations) or by increasing revenues from taxes (revenue-based consolidations). These policies likely have different consequences because, as argued earlier, moderate left parties were historically seen as the founders and defenders of the welfare state. Their brand is strongly based on the notion of protecting the weakest members of society and providing insurance for others against adverse economic shocks (unemployment benefits, health insurance) and old age (pension). Most spending cuts undermine this commitment, while tax increases do not necessarily have the same impact. In fact, historically, Social Democrats explicitly argued for higher taxes to finance the welfare state and achieve redistribution (“tax and spend”). Therefore, it is likely that increasing taxes does not have the same electoral consequences for Social Democrats as cutting government spending, as formulated in Hypothesis 2:
Hypothesis 2: Social democratic parties lose more when they implement spending-based consolidations than when they implement revenue-based consolidations.
However, not even all spending-based consolidations necessarily hurt social democratic parties equally, either. Voters are likely to punish social democratic parties for cuts to government spending that they cherish. Given that social democratic parties appeal to a broad cross-class coalition, their supporters may react adversely to the full range of spending cuts. However, as argued earlier, research shows that the social democratic parties have increasingly recruited voters from the expanded middle classes (Kitschelt Reference Kitschelt1994, Gingrich and Häusermann Reference Gingrich and Häusermann2015) and that public sector workers have become a key constituency crucial for their electoral success (Benedetto et al. Reference Benedetto, Hix and Mastrorocco2020). These groups are still strongly supportive of the welfare state, but they often prioritize social investment over social consumption spending (Häusermann et al. Reference Häusermann, Abou-Chadi, Bürgisser, Enggist, Mitteregger, Mosimann and Zollinger2022). Existing research thus shows that social democratic parties are most successful when they combine investment-oriented positions with liberal sociocultural positions (Abou-Chadi and Wagner Reference Abou-Chadi and Wagner2019). Similarly, it is likely that social democratic parties lose more when they cut investment spending or public sector wages than when they cut consumptive expenditures. The former types of cuts immediately hurt the interests of large constituencies, which are well organized and likely to mobilize against their losses (Pierson Reference Pierson1996). They are likely to abandon social democratic parties in favor of other parties – including the New Left or the Moderate Right – if their interests are hurt.
Hypothesis 3: Social democratic parties lose more when they implement spending-based consolidation that cut investment spending and public sector wages than when they spending-based consolidations that cut consumption spending.
12.4 Data and Methods
To test whether fiscal consolidations implemented by social democratic parties are associated with brand dilution, I use a dataset provided by Devries et al. (Reference Devries, Guajardo, Leigh and Pescatori2011) that was updated by Alesina et al. (Reference Alesina, Favero and Giavazzi2019).Footnote 4 To create the data, policy decisions were coded to measure the precise amount of spending cuts and tax increases that governments implemented during episodes of fiscal consolidation. This approach directly captures fiscal policy decisions by governments.
The data is available for sixteen countries from 1978 to 2014.Footnote 5 It allows me to extract several variables that measure whether and how governments implemented fiscal consolidations before elections: First, I create a variable that measures the level of fiscal consolidations in the year before an election; second, I create two variables that distinguish between spending-based consolidations and revenue-based consolidations; third, I create five variables that further distinguish subcategories of both types of consolidations: investment, (social) consumption, salaries, income taxes, and value-added taxes.
To create the subcategories for investment and consumption, I aggregate several types of spending cuts. Specifically, investment refers to cuts in gross fixed capital formation (e.g., infrastructure investment), education spending, family policies, and spending on research and development. Consumption refers to cuts in pension spending, spending on the unemployed, other social security programs, and health-related spending. Table 12.A2 shows the items included and provides further definitions based on the data by Alesina et al. (Reference Alesina, Favero and Giavazzi2019).Footnote 6
I then combine the data on fiscal consolidations with information from the ParlGov database (Döring and Manow Reference Döring and Manow2021) about the vote share of the main social democratic party, which I use as the main dependent variable (“SD party”). To analyze the association between fiscal consolidations and electoral performance, I then use time-series cross-section analysis. The key quantity of interest in my analysis is an interaction effect between the consolidation variables and a dummy variable that records whether social democratic parties were responsible for implementing the consolidation package or not. This variable takes a value of 1 if the prime minister responsible was a Social Democrat and 0 otherwise. In a robustness test shown, I repeat the same analysis for a variable that takes the value of 1 if the social democratic party was in government, irrespective of whether the prime minister was a Social Democrat or not.
Unit root tests show that all variables are stationary, which allows for time series analysis. All models include a lagged dependent variable to account for autocorrelation. Lag selection tests indicate that lags for the independent variables are not statistically significant. Hence, I use linear regression models and estimate the following first-order auto-regressive lag models:
 (12.1)
where the dependent variable Y for country i at time t is modeled as a function of its lagged value and fiscal consolidation in the year before the election Xit-1 in interaction with an incumbency dummy Iit-1.
To account for other variables that may explain the performance of moderate left parties, I control for the level of unemployment and union density. Moreover, all models include country-fixed effects to account for the unobserved country- or party-level differences in the electoral performance of social democratic parties.
12.5 Results
12.5.1 The Average Effect of Fiscal Consolidations
Table 12.1 shows the results from regression models that use three different interaction effects with the incumbency dummy: the overall level of fiscal consolidations as well as the levels of spending- and revenue-based consolidations, respectively. To interpret the interaction effects, it is useful to plot them graphically.
| Model 1 | Model 2 | Model 3 | |
|---|---|---|---|
| SD party (t − 1) | 0.484Footnote ** | 0.478Footnote ** | 0.514Footnote ** |
| (0.147) | (0.157) | (0.134) | |
| SD prime minister (t − 1) | −1.706 | −1.542 | −2.427 |
| (1.694) | (1.789) | (1.482) | |
| Unemployment | −0.364Footnote * | −0.384Footnote * | −0.343Footnote * |
| (0.161) | (0.167) | (0.155) | |
| Union density | 0.038 | 0.043 | 0.035 |
| (0.100) | (0.100) | (0.098) | |
| Consolidation (t − 1) | 0.546 | ||
| (0.458) | |||
| Consolidation (t − 1) × SD prime minister (t − 1) | −1.264 (0.846) | ||
| Spending-based consolidation (t − 1) | 1.199Footnote + | ||
| (0.661) | |||
| Spending-based cons. (t − 1) × SD PM (t − 1) | −2.310Footnote + | ||
| (1.166) | |||
| Revenue-based consolidation (t − 1) | 0.007 | ||
| (0.816) | |||
| Revenue-based cons. (t − 1) × SD PM (t − 1) | −0.817 | ||
| (1.698) | |||
| Num.Obs. | 179 | 179 | 179 |
| R2 | 0.853 | 0.854 | 0.851 |
| R2 Adj. | 0.832 | 0.834 | 0.830 |
| R2 within | 0.240 | 0.247 | 0.231 |
| AIC | 1,139.5 | 1,137.8 | 1,141.6 |
| BIC | 1,212.8 | 1,211.1 | 1,214.9 |
| Log.Lik. | −546.765 | −545.893 | −547.783 |
| Std.Errors | By: country | By: country | By: country |
| FE: country | Yes | Yes | Yes |
+ p < 0.1, *p < 0.05, **p < 0.01, ***p < 0.001.
Figure 12.1 shows the predicted vote share for the level of social democratic parties by the overall level of fiscal consolidation in the year before a given election and the incumbency status, that is, whether social democratic parties implemented the fiscal consolidation or not. The results suggest that there is a weak interaction effect: Social democratic parties tend to lose in elections following fiscal consolidations that they implemented; in contrast, they tend to win in elections following fiscal consolidations that were implemented when they were in opposition. Although the negative effect of implementing consolidations is sizeable, it is not statistically significant. There is thus no strong evidence for Hypothesis 1.
Predicted vote share of social democratic parties by level of fiscal consolidation and incumbency status
Note: This figure shows the predicted effect of fiscal consolidations in the year before an election at time t on the electoral performance of center-left parties in that election depending on whether they were in government at t − 1 or not. Results are based on Model 1 from Table 12.1. For a histogram showing the distribution of the size of fiscal consolidations, see Figure 12.A1.

However, as argued earlier, it could matter what kind of fiscal consolidations parties implement. Governments can consolidate their finances by cutting spending or increasing taxation. Moderate left parties have historically built the welfare state and their brand is strongly built around the notion of protecting the weakest members of society. Spending cuts undermine this commitment, while tax increases do not necessarily have the same impact. To test whether there is a difference between the impact of spending- and revenue-based consolidations, I consider them separately in Models 2 and 3, respectively.
The interaction effects are again shown in Figure 12.2. The left-hand side of the figure suggests that, indeed, Social Democrats are more strongly punished for spending-based consolidations than revenue-based consolidation (Hypothesis 2). Implementing revenue-based consolidations reduces the predicted vote share for social democratic parties much less, as shown on the right-hand side: the effect is smaller and not statistically significant. This indicates that Social Democrats can find ways to escape punishment for revenue-based consolidations but not for spending-based consolidations (also see Hübscher et al. Reference Hübscher, Sattler and Wagner2021). The latter dilute the brand of social democratic parties more strongly, thus negatively impacting their vote share.
Predicted vote share of social democratic parties by level of spending- and revenue-based consolidations and incumbency status
Note: This figure shows the predicted effect of spending- and revenue-based fiscal consolidations in the year before an election at time t on the electoral performance of center-left parties in that election depending on whether they were in government at t − 1 or not. Results are based on Models 2 and 3 from Table 12.1, respectively. For a histogram showing the distribution of the size of spending- and revenue-based consolidations, see Figure 12.A2.

Several robustness tests further lend credibility to these results. First, further analyses show that the effects are weaker but go in the same direction if social democratic parties are in government without leading it. This indicates that moderate left parties are more generally punished for implementing centrist policies, while they benefit electorally if they are in opposition when these policies are implemented. Second, neither adding year-fixed effects nor a lag of the consolidation variable changes the results. The results also hold if only elections after 1990 are considered and they replicate across regions. Due to the small number of observations, however, the results do not reach statistical significance in some regions (e.g., in Northwestern Europe, which only includes Germany, Austria, and Belgium).
12.5.2 The Effect of Specific Spending Cuts and Tax Increases
Governments still have a variety of different policies available to them when pursuing spending- and revenue-based consolidations. We can thus go one step further and consider the effect of different forms of fiscal consolidations in a more granular way. Specifically, I distinguish between three types of spending-based consolidations (investment, consumption, and salaries) and three types of revenue-based consolidations (income taxes, property taxes, and value-added taxes), as outlined earlier.
The results are shown in Table 12.2 and illustrated in Figure 12.3. First, Figure 12.3(a)−(c) confirm that spending-based consolidations are more detrimental to the electoral performance of social democratic parties than revenue-based consolidations. Figure 12.3(d)−(f)highlight that consolidations achieved by different types of tax increases in the year prior to an election are essentially unrelated to the predicted vote share of social democratic parties. This is further evidence that is in line with Hypothesis 2.
Second, with regard to spending-based consolidations, not all types of consolidations are equal, as outlined in Hypothesis 3. Social democratic parties tend to lose most strongly when they cut a variety of different forms of investment spending. Most importantly, this category includes education spending, which is one of the most popular forms of welfare state spending and probably drives the results. It is in line with arguments that emphasize the changing nature of social democratic voters (e.g., Kitschelt Reference Kitschelt1994; Gingrich and Häusermann Reference Gingrich and Häusermann2015; Abou-Chadi and Wagner Reference Abou-Chadi and Wagner2019).
| Model 1 | Model 2 | Model 3 | Model 4 | Model 5 | Model 6 | |
|---|---|---|---|---|---|---|
| SD party (t − 1) | 0.509Footnote ** | 0.482Footnote * | 0.479Footnote ** | 0.522Footnote ** | 0.519Footnote ** | 0.514Footnote ** |
| (0.161) | (0.172) | (0.163) | (0.131) | (0.152) | (0.130) | |
| SD prime minister (t − 1) | −2.126 | −1.986 | −1.598 | −2.400 | −2.656 | −2.514Footnote + |
| (1.769) | (1.746) | (1.729) | (1.553) | (1.622) | (1.391) | |
| Unemployment | −0.381Footnote * | −0.337Footnote + | −0.354Footnote * | −0.410Footnote * | −0.336Footnote + | −0.349Footnote + |
| (0.170) | (0.166) | (0.158) | (0.160) | (0.164) | (0.167) | |
| Union density | 0.052 | 0.048 | 0.041 | 0.039 | 0.038 | 0.039 |
| (0.096) | (0.100) | (0.099) | (0.093) | (0.095) | (0.095) | |
| Consumption (t − 1) | 12.199Footnote *** | |||||
| (2.864) | ||||||
| Consumption (t − 1) × SD PM (t − 1) | −13.491Footnote * | |||||
| (5.155) | ||||||
| Investment (t − 1) | 3.467Footnote * | |||||
| (1.483) | ||||||
| Investment (t − 1) × SD PM (t − 1) | −30.773Footnote *** | |||||
| (6.016) | ||||||
| Salaries (t − 1) | 11.609Footnote *** | |||||
| (2.657) | ||||||
| Salaries (t − 1) × SD PM (t − 1) | −35.423Footnote *** | |||||
| (3.635) | ||||||
| Income taxes (t − 1) | 5.471Footnote + | |||||
| (2.898) | ||||||
| Income taxes (t − 1) × SD PM (t − 1) | −4.323 | |||||
| (3.202) | ||||||
| Property taxes (t − 1) | −5.300Footnote + | |||||
| (2.919) | ||||||
| Property taxes (t − 1) × SD PM (t − 1) | 0.602 | |||||
| (5.409) | ||||||
| Consumption taxes (t − 1) | −0.529 | |||||
| (5.785) | ||||||
| Consumption taxes (t − 1) × SD PM (t − 1) | −0.549 | |||||
| (10.055) | ||||||
| Num.Obs. | 179 | 179 | 179 | 179 | 179 | 179 |
| R2 | 0.855 | 0.861 | 0.869 | 0.853 | 0.852 | 0.851 |
| R2 Adj. | 0.834 | 0.841 | 0.851 | 0.832 | 0.831 | 0.830 |
| R2 within | 0.250 | 0.281 | 0.324 | 0.239 | 0.235 | 0.230 |
| AIC | 1,137.2 | 1,129.7 | 1,118.5 | 1,139.7 | 1,140.7 | 1,141.8 |
| BIC | 1,210.5 | 1,203.0 | 1,191.8 | 1,213.0 | 1,214.0 | 1,215.1 |
| Log.Lik. | −545.617 | −541.834 | −536.257 | −546.857 | −547.369 | −547.890 |
| Std.Errors | By: country | By: country | By: country | By: country | By: country | By: country |
| FE: country | Yes | Yes | Yes | Yes | Yes | Yes |
+ p < 0.1, *p < 0.05, **p < 0.01, ***p < 0.001.
Predicted vote share of social democratic parties by level of consolidation in different areas and incumbency status
Note: This figure shows the predicted effect of spending cuts or tax increases in different areas in the year before an election at time t on the electoral performance of center-left parties in that election depending on whether they were in government at t − 1 or not. Results are based on Models 1 and 6 from Table 12.2, respectively. For a histogram showing the distribution of the size of different types of fiscal consolidations, see Figure 12.A3.

Similarly, the Moderate Left loses when it cuts public sector salaries. Public employees are often a well-organized constituency that has become a central element of the social democratic support coalition. When Social Democrats act against the interests of this constituency, Figure 12.3 suggests that their vote share drops.
Finally, somewhat surprisingly, there is no discernible negative effect of cutting consumption spending for moderate left parties. There is still a significant interaction effect according to Table 12.2, but this effect is solely driven by a positive effect of such spending cuts when Social Democrats are in opposition. In fact, Social Democrats win most when other governing parties cut consumption spending compared to other forms of spending cuts. It is possible that social democratic governments are less likely to cut consumption spending than other governments in the first place, which could explain the results and calls for further analyses about the (political) determinants of different types of fiscal consolidations. Overall, Figures 12.2 and 12.3 present important variation in the electoral consequences that different types of fiscal consolidations have for social democratic parties.
12.5.3 The Effect of Spending Cuts on the Overall Left Field and the Electability of Social Democratic Parties
What is the effect of fiscal consolidation on the overall left field and the electability of social democratic parties? To answer this question, I create three additional dependent variables based on the ParlGov database. I consider the vote share of all other left-wing parties, including green/left-libertarian and radical left parties (“Small Left”) as well as the vote share of the entire left bloc (“Left Field”). Beyond vote share, I also consider whether social democratic parties can win elections and thus appoint the prime minister (“PM post”) after a given election. I then repeat the analysis from above with these alternative dependent variables. Given the results from above, the analyses focus on spending-based consolidations (overall) as well as different forms of spending cuts (consumption, investment, public salaries).
The results are shown in Table 12.3. Models 1 to 4 use the vote share of small left parties as the dependent variable. The results suggest that these parties also lose when social democratic parties implement cuts to consumption spending but that they tend to win when social democratic parties cut investment spending or public sector salaries. The latter effect is particularly strong and statistically significant for cuts to investment spending, which further supports the interpretation of the results in Table 12.2: When social democratic parties cut spending that middle class voters prioritize, they are likely to vote for other small left parties, instead. It remains an open question why the non-social democratic Left loses when the Moderate Left cuts social consumption spending, as there are several different mechanisms that could be a play. These parties could support the government (in a coalition or otherwise), giving their supporters a reason to walk away. Yet, there could also be an indirect mechanism: retrenchment could increase the salience of economic distributive conflicts on which (some) green and left-libertarian parties do not take strong stances. Leftist voters who would otherwise vote on second-dimension non-economic policies for the Small Left could turn to social democratic parties, compensating for the losses that social democratic parties sustain to other parties (e.g., the Moderate Right).
| Model 1 | Model 2 | Model 3 | Model 4 | Model 5 | Model 6 | Model 7 | Model 8 | Model 9 | Model 10 | Model 11 | Model 12 | |
|---|---|---|---|---|---|---|---|---|---|---|---|---|
| DV: Small left (M1-4) | DV: Left field (M5-8) | DV: PM post (M9-12) | ||||||||||
| Small left (t − 1) | 0.872Footnote *** | 0.875Footnote *** | 0.849Footnote *** | 0.859Footnote *** | ||||||||
| (0.043) | (0.043) | (0.046) | (0.043) | |||||||||
| Left field (t − 1) | 0.647Footnote *** | 0.642Footnote *** | 0.655Footnote *** | 0.630Footnote *** | ||||||||
| (0.128) | (0.130) | (0.131) | (0.132) | |||||||||
| SD prime minister (t − 1) | 0.133 | 0.102 | −0.135 | −0.057 | −1.990Footnote + | −2.171Footnote * | −2.480Footnote * | −1.886Footnote + | 0.176Footnote + | 0.154 | 0.146 | 0.173Footnote + |
| (0.269) | (0.279) | (0.372) | (0.365) | (0.988) | (1.020) | (0.995) | (1.044) | (0.087) | (0.091) | (0.088) | (0.088) | |
| Unemployment | −0.054 | −0.045 | −0.072 | −0.068 | −0.265Footnote * | −0.219 | −0.204 | −0.236Footnote + | −0.002 | 0.003 | 0.004 | 0.005 |
| (0.101) | (0.091) | (0.118) | (0.115) | (0.122) | (0.132) | (0.128) | (0.121) | (0.012) | (0.013) | (0.013) | (0.011) | |
| Union density | 0.002 | 0.004 | −0.002 | 0.002 | 0.053 | 0.062 | 0.047 | 0.049 | −0.002 | −0.002 | −0.002 | −0.002 |
| (0.028) | (0.028) | (0.029) | (0.029) | (0.058) | (0.054) | (0.064) | (0.056) | (0.005) | (0.005) | (0.005) | (0.005) | |
| Spending-based consolidation (t − 1) | 0.255 | 1.498 | 0.097 | |||||||||
| (0.206) | (0.931) | (0.058) | ||||||||||
| Spending-based (t − 1) × SD PM (t − 1) | −0.431 | −1.610 | −0.076 | |||||||||
| (0.397) | (1.360) | (0.109) | ||||||||||
| Consumption (t − 1) | 1.429Footnote + | 14.276Footnote ** | 0.289 | |||||||||
| (0.808) | (4.443) | (0.492) | ||||||||||
| Consumption (t − 1) × SD PM (t − 1) | −4.041Footnote ** | −14.130Footnote ** | −0.298 | |||||||||
| (1.023) | (4.591) | (0.596) | ||||||||||
| Investment (t − 1) | 1.634 | 4.808Footnote * | −0.032 | |||||||||
| (0.993) | (1.746) | (0.095) | ||||||||||
| Investment (t − 1) × SD PM (t − 1) | 8.913Footnote * | −12.809Footnote + | −0.091 | |||||||||
| (3.522) | (6.306) | (0.644) | ||||||||||
| Salaries (t − 1) | 1.051 | 13.732Footnote ** | 0.418 | |||||||||
| (0.742) | (3.816) | (0.407) | ||||||||||
| Salaries (t − 1) × SD PM (t − 1) | 3.673 | −26.094Footnote *** | −1.389Footnote ** | |||||||||
| (3.909) | (4.200) | (0.435) | ||||||||||
| Num.Obs. | 169 | 169 | 169 | 169 | 179 | 179 | 179 | 179 | 179 | 179 | 179 | 179 |
| R2 | 0.843 | 0.843 | 0.849 | 0.845 | 0.857 | 0.859 | 0.855 | 0.866 | 0.278 | 0.267 | 0.266 | 0.288 |
| R2 Adj. | 0.820 | 0.821 | 0.827 | 0.822 | 0.837 | 0.839 | 0.834 | 0.847 | 0.181 | 0.169 | 0.168 | 0.193 |
| R2 within | 0.718 | 0.719 | 0.729 | 0.722 | 0.364 | 0.372 | 0.353 | 0.403 | 0.038 | 0.024 | 0.023 | 0.052 |
| AIC | 839.9 | 839.0 | 833.2 | 837.8 | 1,083.0 | 1,080.7 | 1,086.1 | 1,071.6 | 231.7 | 234.2 | 234.5 | 229.1 |
| BIC | 908.8 | 907.9 | 902.1 | 906.6 | 1,156.3 | 1,154.0 | 1,159.4 | 1,144.9 | 301.8 | 304.3 | 304.7 | 299.2 |
| Log.Lik. | −397.963 | −397.521 | −394.599 | −396.881 | −518.487 | −517.342 | −520.062 | −512.820 | −93.843 | −95.096 | −95.272 | −92.531 |
| Std.Errors | By: country | By: country | By: country | By: country | By: country | By: country | By: country | By: country | By: country | By: country | By: country | By: country |
| FE: country | Yes | Yes | Yes | Yes | Yes | Yes | Yes | Yes | Yes | Yes | Yes | Yes |
+ p < 0.1, *p < 0.05, **p < 0.01, ***p < 0.001.
Models 5 to 8 then use the combined vote share of the overall left field as the dependent variable. Following on from Models 1 to 4, the results generally suggest that the Left Field is hurt by spending-based consolidations in general. This is particularly true when social democratic parties cut public sector salaries, but there is also a negative interaction effect for the other spending categories. The negative effect of consolidations that cut investment is weaker than the effect on the vote share on the Moderate Left alone, given that other small left parties benefit from these kinds of consolidations. Still, spending cuts are not a viable strategy to maximize the size of the bloc, given that the interaction effect shown in all four models is clearly negative.
Finally, Models 9 to 12 indicate that fiscal consolidations cannot be considered successful office-seeking strategies, either. Given the previous results, it is not surprising that the sign on the interaction effect is again negative. However, the interaction is only statistically significant in one instance: following cuts to public sector wages, the likelihood that social democratic parties can appoint the prime minister decrease is much lower than otherwise. This is in line with evidence from Benedetto et al. (Reference Benedetto, Hix and Mastrorocco2020), highlighting the importance of public sector workers as a constituency for social democratic parties.
12.5.4 Further Analyses
The results shown earlier may not only hold for social democratic parties. To test whether fiscal consolidations are also associated with electoral losses for the Moderate Right, I replicated the analysis. The results show that moderate right parties also lose in elections after they implemented fiscal consolidation. However, this effect is smaller than it is for social democratic parties, and it is not statistically significant. More importantly, the Moderate Right is punished for different forms of fiscal consolidation: On average, their vote share is hardly affected by any form of spending-based consolidations. Instead, the Moderate Right loses after implementing revenue-based consolidations. This is in line with my theoretical expectations postulating that fiscal consolidations which are against the interests of a party’s key constituencies are more likely to be associated with electoral losses.
Also in light of this evidence, it is puzzling that the Moderate Left retrenches the welfare state in times of fiscal consolidation (Armingeon et al. Reference Armingeon, Guthmann and Weisstanner2016) and does not rely more on revenue-based consolidations, given that rational vote-seeking politicians should be able to anticipate the electoral consequences of the policies that they implement. Yet, the analyses shown above are not driven by a specific set of cases. Table 12.A1 shows a list of the largest fiscal consolidation packages that the Moderate Left passed before election years in the countries included here. The list includes cases from different periods (e.g., the 1990s, the eurozone crisis) as well as different regions. Governments are somewhat more likely to implement consolidations during hard economic times, but there is no strong correlation between the main macroeconomic context factors and (the type of) consolidations that governments social democratic politicians pursue. Macroeconomic circumstances may force social democratic parties to pursue spending-based consolidations when there is a large public sector deficit, the country already has comparatively high taxes, and the country spends a large amount on social policies. Although those instances are rare, the conditions under which social democratic parties pursue different (types of) consolidations should be investigated further.
12.6 Conclusion
In many advanced economies, centrist strategies were hailed as a magic formula to increase the electoral popularity of left-wing parties toward the end of the twentieth century. Although centrist programs may have increased the support for the Moderate Left in the short run, the same cannot be said about the centrist policies. Once social democratic parties won office and implemented these policies, they had feedback effects with adverse electoral consequences (Arndt Reference Arndt2013; Karreth et al. Reference Karreth, Polk and Allen2013; Schwander and Manow Reference Schwander and Manow2017).
Using the case of fiscal consolidations as a proxy for centrist policies, this chapter shows that social democratic parties, on average, lose after implementing such consolidations. The negative association between consolidations and the electoral performance of social democratic parties is mostly driven by spending-based consolidations. Revenue-based consolidations are not associated with lower vote shares and this is true for both direct (income, property) and indirect (VAT) tax increases.
In particular, social democratic parties tend to lose support after cutting investment spending and public sector wages. Surprisingly, there is no clear negative association between cuts to consumption spending and their electoral performance. This implies that not all types of fiscal consolidation are politically risky for social democratic parties. Rather, fiscal consolidations that hurt their key constituencies which have outside options and could vote for other voters – the middle classes and public sector employees – are particularly harmful. These forms of consolidations also tend to shrink the size of the overall left field and undermine the ability of Social Democrats to be reelected after implementing them.
What can be learned from these results? The results indicate that social democratic parties get punished for the policies that they implement. For several decades, social democratic parties supported fiscal orthodox policies as part of a centrist economic strategy. However, fiscal consolidation is not a viable strategy to secure the long-term success of Social Democracy. A party’s ability to distinguish itself from other parties is clearly important for its electoral success. Social democratic parties, therefore, need to retain their own brand while moving strategically in the political space vis-à-vis their electoral competitors. In the short run, centrist programs were successful in the 1990s – especially as an office-seeking strategy and in majoritarian electoral systems – but centrist policies have undermined the social democratic party’s brand. As many voters are asking what these parties still stand for, centrism is unlikely to help Social Democrats escape from their current electoral malaise.
Still, the results have to be interpreted with caution because they are mostly driven by patterns that existed when party systems were more stable, less volatile, and less fragmented than they are today. The extent to which we can apply history to learn about the present may thus be limited. As we shorten the time frame and compare the payoffs of different strategies over relatively short periods, we reach the limits of quantitative analyses. In this case, results are strongly influenced by measurement error and may just be “white noise” generated by small variances. It would thus be useful to supplement quantitative analyses with qualitative analysis to learn about the payoffs of different electoral strategies in the last few years.
13.1 Introduction
When Martin Schulz was elected as the leader of the Social Democratic Party (SPD) of Germany in March 2017, the media and the public were in awe of him. In the first weeks of the campaign, Schulz helped the battered and beaten SPD regain confidence, members, and support in the polls. Initial gains in the polls of over ten percentage points let The Guardian ask if, after three devastating election defeats, “Germany’s Social Democrats [have] found a winner in Martin Schulz?” (Connolly Reference Connolly2017). Others even called the nomination of Schulz as the chancellor candidate and party leader “a tectonic shift” and predicted that “Angela Merkel must prepare for a real fight” (Bartsch et al. Reference Bartsch, Böll, Feldenkirchen, Höhne, Knaup and Neukirch2017). Der Spiegel described Schulz as radiating confidence and having a hunger for power, while his predecessor Sigmar Gabriel was characterized as a politician who struggles and dithers (Bartsch et al. Reference Bartsch, Böll, Feldenkirchen, Höhne, Knaup and Neukirch2017). It was a change that BBC classified as “an attempt to improve the party’s chances” in the upcoming election (“Germany election,” BBC 2017). In March 2017, the scene seemed to be set for an exciting and close election with the party that finally found its stride and was ready to challenge the chancellor, Angela Merkel.
Alas, the excitement lasted only a few months, and on the election day in September 2017, the SPD suffered further election losses. The party’s crash-landing at the ballot box led Schulz to resign from his position less than a year after his historic unanimous appointment. Even a leader as exciting as Schulz was not enough for SPD’s recovery. For the party this was yet another example of a failed leader with a very short tenure in office, a pattern that many pundits blame for the SPD’s decline in recent years. Between Gerhard Schröder’s resignation in 2004 and Sigmar Gabriel’s appointment in 2009, SPD had four additional leaders, each of whom, on average, lasted only about one and a half years in office. During that period, the SPD was in free fall. Its seats in the Bundestag declined from 251 seats (out of 603, 41.6%) in 2002 to 146 seats (out of 622, 23.5%) in 2009. At the same time, their official vote total shrunk from almost 18.48 m votes (38.5%) to 9.99 m (23%).
Even in the 2021 election in Germany, when the SPD emerged as the largest party in the parliament, the SPD received only 11.95 m (25.7%) votes. This is significantly less than the over 20 m votes they received the last time they were the strongest party, the 1998 election in which Gerhard Schröder became chancellor.Footnote 1 Does the electoral diminishment of the SPD during the 2000s and 2010s teach us an important lesson about the significance of party leaders and leader turnover for party performance? Do quick leader turnovers and downturns in electoral performance go hand in hand? Do parties perform better with stable leadership? Or, is there a social democratic exception (or even an SPD exception) at work? Have party leaders and leadership churns contributed to the decline of social democratic parties we witness across Europe?
In this chapter, we use a novel dataset that covers ten advanced democracies between the early 1990s and 2019 to test whether the decline of social democratic parties can be attributed to party leadership changes and especially to the frequency of party leadership changes by answering three questions:
1. What determines the duration of leadership tenure across different party families?
2. Is party leader tenure shorter in social democratic parties? and
3. How does leader turnover (and especially the frequency of leadership turnover) affect party performance both in the short term (for opinion polls) and in the long term (for election results)?
Our findings suggest interesting patterns. First, analyzing the duration of party leaders in office, we see that electoral performance indicators as well as the procedures and results of leader selection have significant effects on party leader duration with some variation across different regions/electoral systems. However, these variables do not vary in their effect on leader duration across party families. Given these results and the prevalence of some of these features for social democratic parties, we then check whether social democratic parties have different leadership turnover rates compared to other party families. The data suggest no, with an important exception for the German SPD. Finally, we analyze the short-term and long-term performance effects of leadership changes and see that while leadership changes and the frequency of leadership changes have some minor impact on short-term polling results, they do not influence election results. These results are consistent across party families and do not suggest a social democratic exceptionalism, although social democratic parties appear to be awarded more in the short term if they change their leaders while in opposition.
Below, we first elaborate on our theoretical expectations for the three research questions we listed earlier. We then describe the novel data that is the foundation of our analysis in more detail, show the results for the duration models testing the factors that explain leader tenure, and discuss the SPD as an extreme case with frequent leadership changes (Seawright and Gerring Reference Seawright and Gerring2008). Afterwards we turn to the analyses of leadership changes’ performance consequences. We conclude this chapter by discussing these results and potential theoretical expectations we derive for future work.
13.2 Theoretical Expectations
Leaders are increasingly crucial for political parties, even in parliamentary systems. Over the past few decades, scholars have noted that politics has become more candidate-centric (Wattenberg Reference Wattenberg2014) and “presidentialized” (Poguntke and Webb Reference Poguntke and Webb2005). As party membership numbers continue to decrease across Europe, leaders have acquired more power and influence: They are now identified as the central actors in running parties’ election campaigns and attracting voters to their parties (Scarrow et al. Reference Scarrow, Webb, Farrell, Dalton and Wattenberg2000).Footnote 2
A growing literature also shows how leaders, their campaigns, personal characteristics, and traits affect vote choice (Butler and Stokes Reference Butler and Stokes1974; LeDuc Reference LeDuc2001; McAllister Reference McAllister, Dalton and Klingemann2007; Bittner Reference Bittner2011; Aarts et al. Reference Aarts, Blais and Schmitt2013). Given the heightened importance of leaders in electoral politics, political parties should be more careful in selecting the best leader and not shy away from replacing them when necessary. But do we see any evidence for these expectations? Do parties replace their leaders when needed? What explains party leadership change? And, are parties successful in boosting their performance following a leadership change? Most important for this chapter, what explains social democratic party leaders’ duration in office, and how do leadership changes affect social democratic parties’ performances?
13.2.1 Understanding Leader Duration in Office
If leadership replacements are strategic affairs and parties are more likely to replace their leaders when voters demand change, then we should see that parties change their leaders following an election defeat, government loss, or because of poor polling performance. Andrews and Jackman (Reference Andrews and Jackman2008) and Ennser-Jedenastik and Müller (Reference Ennser-Jedenastik and Müller2015), focusing on Westminster systems and Austria, respectively, have shown that electoral performance is the most crucial factor affecting leader duration in office. Expanding the sample to other advanced democracies, we argue that parties that lost votes in the recent elections are more likely to replace their leaders. Another retrospective performance indicator for political parties is losing/winning governing status. Following the findings in the literature, we expect a leader who cost a party its government participation to be more likely to be replaced (Bille Reference Bille1997; Ennser-Jedenastik and Schumacher Reference Ennser-Jedenastik, Schumacher, Cross and Pilet2015). Finally, recent polls inform political parties more immediately than past election results about their expected electoral performance. We expect that, as parties rack up continuous losses in public support and as expected losses on election day become more likely, leaders are more likely to resign or be replaced. This latter argument about the opinion poll effects has not been tested in the literature. Still, given the increasing importance of opinion polls for party strategies (Jennings and Wlezien Reference Jennings and Wlezien2016), we believe that polls should affect leader duration in office.
In addition to electoral performance and government status, another performance indicator is about how leaders get elected to the party’s top office. We argue that leaders should last longer in office if they were elected with unanimous support or by acclamation given the wide support they have. Less than unanimous support suggests less enthusiasm about the leader, which should reduce their time in office. Regarding the effects of the leader selection method, we argue that membership inclusion for selection should help leaders last longer in office, given that these elections result in higher legitimacy and competence evaluations for the newly elected leader (Cozza and Somer-Topcu Reference Cozza and Somer-Topcu2021).
The more crucial empirical question we like to answer about leader tenure, however, is whether Social Democrats are more likely to replace their leaders when needed. This is an important question because a party likely suffers further in polls and elections if it is not responsive to voter demands. Given the importance of party leaders across Europe, one such responsiveness indicator would be replacing the party leader when performance is low. Have Social Democrats replaced their leaders when they were asked to? How do different parties react to the performance variables discussed earlier in their decisions to strategically replace their leaders, and do the same variables affect social democratic leaders’ durations in office?
13.2.2 The Effects of Leader Changes on Party Performance
Earlier, we have argued that leadership changes are strategic affairs, and when done right and at the right time, parties would be seen being responsive to changing voter demands. This suggests that leadership changes should help parties electorally. Hence, our first performance hypothesis is that parties polling and electoral performance should improve when they change their leader. There is further evidence in the literature that suggests that leadership changes are beneficial for party performance. A new leader is more likely to attract airtime and newspaper coverage to advocate her leadership and party policies. As the media coverage about the new leader and the party increases, we expect voters to get more exposure to the party and learn more about its policies (Pedersen and Schumacher Reference Pedersen, Schumacher, Cross and Pilet2015). Somer-Topcu (Reference Somer-Topcu2017) and Fernandez-Vazquez and Somer-Topcu (Reference Fernandez-Vazquez and Somer-Topcu2019) show that voters develop more accurate perceptions of party policy positions and agree more on party positions following a recent leadership change. As a result, one may expect a leadership change to bring new dynamism and attention to the party and is more likely to positively influence a party’s electoral performance.
Yet, despite all the intended positive effects of leadership changes, any change is a destabilizing event for party organizations. Leadership changes are especially risky (Harmel et al. Reference Harmel, Heo, Tan and Janda1995), particularly if they are frequent. Frequent leadership changes likely destabilize party organizations, as they are occasions “to rethink the commitment to the present agenda, to reflect on roads not taken in the past, and to review future choices” (Gilmore Reference Gilmore1988: 14). Grusky (Reference Grusky1960), writing in the management literature, argues that leader successions in businesses are disruptive. With leadership changes, the relationships among organization members change, traditional practices are overhauled, and new policies are introduced. Similar studies of the English soccer leagues (Audas et al. Reference Audas, Dobson and Goddard1997, Reference Audas, Dobson and Goddard2002) and the National Hockey League (Rowe et al. Reference Rowe, Cannella, Rankin and Gorman2005) show that within-season coach or general manager changes often result in declined team performance. Add to that the public perception of frequent leadership changes, the party that replaces its leaders often over short periods of time is likely seen as unsuccessful, disorganized, and divided, all of which have negative consequences for party performance (Greene and Haber Reference Greene and Haber2015). Hence, we hypothesize that frequent leadership changes harm parties’ polling and electoral performance.
Only a handful of studies examined how party leadership changes affect party performance, and no work to our knowledge focused on the effects of the frequency of leadership changes on performance. Pedersen and Schumacher (Reference Pedersen, Schumacher, Cross and Pilet2015) was the first comparative work on the question of how leader changes (but not the frequency) affect performance. Using data from four European countries, they showed that leadership changes have minor positive effects on short-term polling rates and no long-term effects on election outcomes. They also present empirical evidence that the short-term polling effects are stronger for those parties with a contested leadership election and those that allow members to vote for party leadership. Cozza and Somer-Topcu (Reference Cozza and Somer-Topcu2021) expanded on these results in a recent paper using data from eleven countries. They confirm that inclusive selectorates have positive effects on short-term party performance but no long-term electoral effects. Using a survey experiment from Australia, they then unpack the mechanisms behind these short-term positive effects and present evidence that leaders that get elected by party membership have higher legitimacy and are evaluated as more competent. Following this work, we test both the short-term polling and long-term electoral effects of leadership changes in this chapter and also examine, for the first time, how frequency of changes affect parties.
Like the duration analyses, what we are especially interested in in this chapter is exploring whether leadership changes and particularly frequent leadership changes affect social democratic parties’ performance. Hence, below we first test our models for all parties and then test how Social Democrats benefit from or hurt because of leadership changes.
13.3 Party Leaders Data and Research Design
Our examination of party leader changes builds on a novel dataset we collected using Keesing’s World Archives, secondary literature, and online newspaper archives and captures information about leadership changes in fifty political parties across ten advanced parliamentary democracies between the early 1990s and 2019. The countries in the dataset include Australia, Canada, Denmark, Germany, Ireland, the Netherlands, New Zealand, Norway, Sweden, and the United Kingdom, which ensures that the analysis is built on a sufficient number of political parties from Westminster as well as European PR systems.Footnote 3
All political parties that received at least 5% of the vote in two consecutive elections between the first election in the 1990s and 2019 and those that did not have shared/dual leadership were coded. The 5% threshold limits the parties to those we consider electorally relevant. A clear definition of who is a political party leader is not straightforward and depends on the time, country, and even the political party under study. The decision on who we coded as the leader of each party was taken based on an extensive reading of the literature and in consultation with country experts.
Comparing the number of leadership replacements of social democratic parties and their main rivals for the chancellor/PM position, moderate right parties (Christian democratic and conservative), we see in Figure 13.1 that there is little difference in the general trajectory of leadership changes in most countries. While the timing of replacement differs from country to country and from party to party, most social democratic parties are within two cumulative leadership changes of their primary opponents by 2020. Except for Australia, where Labour at some point trailed by three cumulative leadership changes before they caught up and started to move in lockstep, this also holds more generally for the entire time since 1979. Most social democratic parties and their main rivals move somewhat in tandem when it comes to replacing their leaders – except for the German Social Democrats.
Leader changes in social democratic and conservative/Christian democratic parties
Note: Figure shows the number of leadership changes in social democratic (dotted) and moderate right (solid) parties since 1980. Shaded area indicates years in which social democratic parties held the office of the chancellor/prime minister. Interim leaders are not included in the calculation of the totals. Canada’s Conservative party experienced a merger in 2003.

As we detail below, the SPD had nine leadership changes more than their main rival, the CDU and only the Australian parties come even close to – but still trail – the total number of changes the SPD had. Truly remarkable for the SPD is the difference compared to its main rival. The CDU’s three leadership changes in about thirty years (between 1990 and 2019) make for quite a different trajectory than the SPD’s twelve during the same period. There are other political parties in the data set that show diverging patterns in leader replacement compared to their main competitors. For instance, the Norwegian Conservative Party has consistently had three more cumulative leader changes than the Norwegian Labour and Christian Democratic parties. But no other party has more leadership changes and is different from its main competitor than the German SPD.
More generally, the pattern for social democratic and other parties appears to be that the leaders tend to stay in office during times of incumbency, at least the frequency of changes goes down, but that leaders are more readily replaced when the party is not holding the office of, for example, chancellor/prime minister. As shown in Figure 13.1, losing control over the government is usually associated with an immediate leader replacement.
Now that we have seen that SPD has been an exception, we would like to discuss the party in more detail. We started this chapter with the Icarian example of Martin Schulz. Initially celebrated as the savior of the SPD, he flew to new heights in the polls, only to have all the gains in public support melt away just before the election day. The party’s downward tumble also spelled the end for Schulz’s time in office as the SPD leader, adding him to the long list of short-lived postwar leaders of the party. The frequent leadership turnover is not something that has been gone unnoticed in public. “One number sums up the misery of the SPD, sums up its crash: 12. That’s how many former leaders the party has.” This is how the online platform of the largest local newspaper in North Rhine-Westphalia, historically a stronghold of the SPD, commented on the resignation of then-party leader Andrea Nahles in 2019 after being in office for only 407 days (“SPD versinkt im Chaos,” der Westen 2019). Shortly before Nahles’ resignation, her deputy leader Malu Dreyer explicitly warned the party against forcing Nahles out of office: “If we have one lesson behind us, it is that permanent changes in the leadership do not get us any further” (Greive and Stratmann Reference Greive and Stratmann2018). This call from within the SPD to end leadership fights, unite the party, and focus on substantive discussions was not new. It was issued only 406 days earlier when Nahles initially took office. Manuela Schwesig, deputy leader and head of the SPD-led government in Mecklenburg-Vorpommern, called on the party to unite and “to get these days of chaos behind us” (“SPD-Vorsitz,” Merkur 2018).
These calls for unity, continuity, and stability come with reasons. The SPD itself identified frequent changes in its leadership (leader, general secretary, and deputy leaders) as a key weakness in its appeal to voters and its ability to organize effective electoral campaigns (Faus et al. Reference Faus, Knaup, Rüter, Schroth and Stauss2018). This sentiment has been echoed in basically every statement of leading SPD politicians when an old leader throws in the towel and a new one steps up. When Martin Schulz resigned, Ralf Stegner, deputy leader of the SPD, called for the end of debates about party office: “Each of us is well advised to put the interests of the party and the country above our ambitions.” Thorsten Schäfer-Gümbel, deputy leader of the SPD, said that it is a top priority of the party to reestablish its ability to act and demanded that the “unsorted nature at the federal level” must be remedied (“Widerstand gegen Nahles,” die ZEIT 2018). Michael Müller, heading the government of the SPD in Berlin, put it more bluntly and called for the party to stop appointing leaders on an annual basis (as quoted in the same article).
The data in Table 13.1 show that the SPD indeed is a party of many leadership changes. Since 1945, the SPD has had seventeen leaders and six acting leaders. To make matters worse, while the initial leadership tenure was long (the first three leaders were in power for over 6, 11, and 23 years, respectively), leaders have been replaced in rather rapid succession afterward. Since Willy Brandt’s resignation in 1987, only two leaders remained in office for more than five years, while two leaders didn’t even last an entire year. The average tenure of an SPD leader following Brandt has been slightly above 2.5 years, resulting in, on average, two new leaders per electoral cycle.
| Name | Appointment | Resignation | Duration | ||
|---|---|---|---|---|---|
| 1 | Kurt Schumacher | 1946-05-11 | 1952-08-20 | 6 years | 103 days |
| 2 | Erich Ollenhauer | 1952-09-27 | 1963-12-14 | 11 years | 80 days |
| 3 | Willy Brandt | 1964-02-15 | 1987-06-14 | 23 years | 125 days |
| 4 | Hans-Jochen Vogel | 1987-06-14 | 1991-05-29 | 3 years | 350 days |
| 5 | Björn Engholm | 1991-05-29 | 1993-05-05 | 1 year | 342 days |
| 6 | Rudolf Scharping | 1993-06-25 | 1995-11-16 | 2 years | 144 days |
| 7 | Oskar Lafontaine | 1995-11-16 | 1999-03-12 | 3 years | 117 days |
| 8 | Gerhard Schröder | 1999-04-12 | 2004-02-06 | 4 years | 301 days |
| 9 | Franz Müntefering | 2004-03-21 | 2005-10-31 | 1 year | 224 days |
| 10 | Matthias Platzeck | 2005-11-15 | 2006-04-10 | 146 days | |
| 11 | Kurt Beck | 2006-05-14 | 2008-09-07 | 2 years | 117 days |
| 12 | Franz Müntefering | 2008-10-18 | 2009-11-13 | 1 year | 26 days |
| 13 | Sigmar Gabriel | 2009-11-13 | 2017-03-19 | 7 years | 128 days |
| 14 | Martin Schulz | 2017-03-19 | 2018-02-13 | 331 days | |
| 15 | Andrea Nahles | 2018-04-22 | 2019-06-03 | 1 year | 42 days |
| 16 | Saskia EskenNorbert Walter-Borjans | 2019-12-06 | 2021-12-11 | 2 years | 5 days |
| 17 | Saskia EskenLars Klingbeil | 2021-12-11 | Current | ||
Note: This table omits the five interim leaders who were in office for periods ranging from 51 to 186 days between 1993 and 2019. Included in the analysis are only leaders that started their tenure before the 1990s, hence SPD leaders before Björn Engholm are excluded. The tenure of Esken and Walter-Borjans as well as Esken and Klingenbeil is outside of the temporal scope of our analysis. However, since these were dual leaderships they would not be coded in our data anyways.
The replacement of leaders has happened for several reasons and mostly not with the strategic goal of maximizing electoral support in the short or long term. A series of changes were unrelated to the performance of the political party. Some of the resignations happened because the leader conflicted with other key party personnel over the party’s direction or office allocation. Oskar Lafontaine left the party leadership in 1999 following a power conflict with then-chancellor Gerhard Schröder. Kurt Beck resigned claiming that he had been wronged in a power struggle with Sigmar Gabriel and Frank-Walter Steinmeier. Franz Müntefering’s first stint as SPD leader was cut short when he failed to place an ally as secretary-general. Sigmar Gabriel resigned leading up to an election because the SPD chancellor candidate Martin Schulz wanted to unite the chancellorship candidacy and party leadership. Matthias Platzeck resigned due to illness after just five months in office.
Another set of leader resignations were performance related, focusing on lost elections on the federal or state level (or the expectation of those losses). Gerhard Schröder resigned due to internal party criticism about the direction of the political agenda and poor polling performance leading into a year with fourteen local, state, and federal elections (“Schröder,” Manager Magazin 2004). Müntefering’s second resignation and the resignations of Nahles and Schulz were related to poor electoral performance in recent elections. However, the immediate polling performance of the party appears to have rarely played a role in the resignations. The SPD explicitly states that. Maximilian Janetzki, SPD member and coauthor of a thorough internal report analyzing the election failures of the SPD in 2017, commented on the expectations that the party has in Andrea Nahles: “I think [she] knows that what counts isn’t the polls taken between elections but she has to make sure that the SPD also shows what it can do during this government. It’s in her own interest to take back control over the discussion” (Chase Reference Chase2018).
Conversely, while the immediate polling performance appears not to be central for the resignation, the new appointments also do not have performance effects. The SPD’s attempt to have a party-wide election of their next leader did not affect the party’s performance (Pergande Reference Pergande2019). The appointment of a new leader, even if done in a very public and with a (what is designed to appear like) highly democratic and participatory selection procedure, does also not necessarily yield immediate electoral gains. Is it maybe the frequency of these leader changes that limit the positive effects of these leader changes? And, are there any systematic factors that affect the leaders’ time in office? We now turn to the cross-national analyses of leader duration and their consequences for party performance.
13.4 Leadership Duration Analyses
As we descriptively showed in Section 13.3, apart from the German SPD, the various parties and party families in our sample appear more similar than different when it comes to party leader replacement. But what we do not know is whether political parties change their leaders when they need to, that is, when their performance is low and when they are expected to be responsive to public preferences. Also, are Social Democrats more or less responsive to public demands compared to other party families?
The dependent variable to answer these questions and run the duration models is the time (in months) a leader is in office. We measure a leader’s tenure from the month of her official appointment to the month of her resignation announcement. We use Cox duration models with a robust variance estimator to examine the factors that determine leader durations.Footnote 4 Proper selection of the underlying hazard rate is still debated in the literature (Warwick Reference Warwick1992; Alt and King Reference Alt and King1994). We use the Cox proportional hazard model because it does not require a specification of an underlying hazard rate shape, as parametric models do. We censor all months for the leaders that are still in the office as of the end of 2019, all leaders who were appointed before the start of our data period (the first leadership appointment in the 1990s), and the two leaders in our data who died in office (John Smith of the UK Labour Party and Jack Layton of the Canadian New Democracy).
Following our theoretical discussions earlier, we first include several performance indicators in our models. We operationalize electoral performance as the change in parties’ electoral performance between the two most recent elections (∆Vote Share). The election results data come from the ParlGov dataset (Döring and Manow Reference Döring and Manow2019). To assess the effects of polling on leader duration in office, we calculated the cumulative changes in the polling performance of a political party over the previous six-month period (∆Polling6 Months, cum.). The monthly polling results data for this calculation come from Jennings and Wlezien (Reference Jennings and Wlezien2016) and are updated using polling data from each of our countries. We focus on the cumulative performance change over six months because we expect that monthly opinion poll changes do not immediately make or break a leader’s chances of survival. Their time in office is more closely tied to the long-term development of the party’s expected electoral performance under their rule. Below we run our models by including and excluding the polling variable because there are large gaps in polling results in several countries.
As a third performance indicator, we include a dummy variable at the party level that is coded 1 if the leader lost the governing party status (Lost Government). The variable is coded 1 starting in the month when the leader’s party is no longer in government and stays 1 until the following leadership change or until the party joins the government again with the same leader. If the leader’s party was never in government during that leader’s tenure, the variable is coded 0 for all the months for that leader. We used the ParlGov data (Döring and Manow Reference Döring and Manow2019) to code the government status.Footnote 5
To test how leadership elections affect leader duration, we add two variables: whether the vote for the party leader was unanimous or whether the appointment was made by acclamation (as opposed to a divided or competitive election) (Unanimous/Acclamation), and whether party members elected the leader as opposed to any other selectorate (such as delegates, parliamentary members of the party, and party elite) (Member Vote). Finally, we also control for leader age (Leader Age) in the models because we expect older leaders to be more likely to be replaced (Andrews and Jackman Reference Andrews and Jackman2008; Cross and Blais Reference Cross and Blais2012) given that they are closer to retirement and often parties go after young blood to energize the party base. We note that the incumbent leaders do not necessarily resign in the same month as the new leader’s appointment.
Therefore, it is crucial that we use the old leader’s resignation date and not the new leader’s appointment date to mark the end of a leader’s tenure. As part of our coding procedure, we not only coded when the new leader was appointed (the information used in the performance analyses below) but also coded the date of the resignation and used this date as the end of a leader’s term. This is an important contribution to the literature as the existing literature mainly uses the appointment date in estimating leaders’ duration in office (see, e.g., Andrews and Jackman Reference Andrews and Jackman2008), which potentially conflates the effects of leader resignation and leader appointment.
Table 13.2 presents the Cox proportional hazard model coefficients where the coefficients of this model represent the risk of experiencing a leadership replacement event. Hence, a negative coefficient would indicate a decrease in the risk of a leader replacement, while a positive coefficient would mean that the covariate is associated with a higher risk of a leader replacement. Columns 1 and 2 pool all countries together. We see that three of our variables have statistically significant effects on leader duration in column 1. Parties are more likely to replace older leaders, leaders who lose votes in elections, and those who have lost government participation. Column 2 adds the polling variable and shows that six-month cumulative polling change also affects leader duration. Leaders who are losing in the polls are more likely to be replaced. The other coefficients stay robust. The remaining columns show the same models separately for the European PR systems of Denmark, Germany, the Netherlands, Norway, and Sweden in columns 3 and 4 and the Westminster systems of Australia, Canada, Ireland, New Zealand, and the UK in columns 5 and 6. So (2018) shows that different institutional features related to opposition party influence in policy-making differently affect opposition party leaders’ duration across the Westminster systems and other advanced democracies. In addition, the argument that politics is more personalized, with party leaders and individual candidates holding more personal political power in elections applies more strongly to the Westminster systems with their plurality/non-PR electoral systems (Poguntke and Webb Reference Poguntke and Webb2005). Finally, there are some critical, descriptive differences across these two regions for some of our independent variables. As widely known, coalition governments are more common in the European PR systems compared to the more frequent single-party governments in the Westminster systems. Hence, losing the government status likely has stronger negative effects on political parties in the Westminster systems than those of the European PR systems. While eleven of the fourteen Westminster system political parties in our dataset have adopted either membership vote or some form of electoral college method with party members having some say in the final leadership election, only seven of the twenty-six parties from the European PR systems have given the right to elect the leader to their party members (two out of six parties in Denmark, one out of three parties in Germany, four out of five parties in the Netherlands, and zero parties in Norway and Sweden). To sum up, it is more appropriate to test the duration models separately for European PR and Westminster systems.
| Variables | All countries | European PR systems | Westminster systems | |||
|---|---|---|---|---|---|---|
| (1) | (2) | (3) | (4) | (5) | (6) | |
| No polling | Polling | No polling | Polling | No polling | Polling | |
| ΔVote share | −0.0621Footnote *** | −0.0366Footnote ** | −0.0928Footnote *** | −0.0722 | −0.0447Footnote * | −0.0183 |
| (0.0175) | (0.0177) | (0.0342) | (0.0445) | (0.0234) | (0.0210) | |
| ΔPolling6 Months, cum. | −0.0392Footnote *** | −0.0223 | −0.0412Footnote *** | |||
| (0.0152) | (0.0340) | (0.0149) | ||||
| Lost government | 1.176Footnote *** | 1.336Footnote *** | 0.771Footnote *** | 0.901Footnote ** | 1.538Footnote *** | 1.460Footnote *** |
| (0.218) | (0.298) | (0.279) | (0.430) | (0.308) | (0.354) | |
| Leader age | 0.0777Footnote *** | 0.0722Footnote *** | 0.0961Footnote *** | 0.0894Footnote *** | 0.0681Footnote *** | 0.0711Footnote *** |
| (0.0124) | (0.0147) | (0.0170) | (0.0223) | (0.0193) | (0.0193) | |
| Member vote | 0.242 | 0.385 | 1.007Footnote *** | 1.574Footnote *** | −0.0809 | −0.181 |
| (0.273) | (0.269) | (0.312) | (0.372) | (0.351) | (0.340) | |
| Unanimous/Acclam. | 0.0498 | −0.150 | −0.158 | −0.559 | 0.207 | 0.0132 |
| (0.186) | (0.249) | (0.242) | (0.363) | (0.330) | (0.331) | |
| Log-likelihood | −455.97 | −292.12 | −233.91 | −113.75 | −126.20 | −104.06 |
| Observations | 9,559 | 6,289 | 5,746 | 3,182 | 3,263 | 2,601 |
Note: Robust standard errors in parentheses.
* p < 0.1, **p < 0.05, ***p < 0.01.
The results from column 3 show robust and statistically significant effects for vote losses, government loss, and age on leader replacements in the European PR systems. However, column 4 shows that when we control for polling changes, the effects of performance indicators on leadership replacement are no longer statistically significant (although still have negative coefficients). In addition, membership election, which is less common in these countries, have a negative effect on leader tenure. Leaders elected through membership vote are likely to be replaced sooner, compared to other leaders. Columns 5 and 6 focus on the Westminster systems and show that, like the European PR systems, vote losses, government loss, and age are detrimental to leader tenure. When we include the polling effects, we see that vote losses no longer affect tenure, but the polling results have significant negative effects on replacement risk. As we expected, government loss has significant and stronger effects on leader tenure in Westminster systems. Selection procedures or selection competitiveness do not affect leader tenure in Westminster systems.
These results explain the determinants of leader replacement. However, the more important question we are interested in is whether social democratic parties have different reasons to replace their leaders. We tested this question by running the duration models for all countries in Table 13.2 (columns 1 and 2) while interacting each variable with a dummy variable for social democratic parties.Footnote 6 Table 13.3 summarizes the results for the conditional effects of social democratic parties.
| All countries | ||
|---|---|---|
| (1) | (2) | |
| Variables | No polling | Polling |
| Social Democrats | −1.837 | −2.360 |
| (1.396) | (1.747) | |
| ΔVote share | −0.0775Footnote *** | −0.0492Footnote * |
| (0.0247) | (0.0269) | |
| ΔVote share × SocDem | 0.0476 | 0.0435 |
| (0.0312) | (0.0353) | |
| ΔPolling6 Months, cum. | −0.0288Footnote * | |
| (0.0161) | ||
| ΔPolling6 Months, cum. × Soc Dem | −0.0412 | |
| (0.0416) | ||
| Lost government | 1.134Footnote *** | 1.195Footnote *** |
| (0.237) | (0.361) | |
| Lost Gov. × Soc Dem | 0.243 | 0.638 |
| (0.468) | (0.625) | |
| Leader age | 0.0663Footnote *** | 0.0533Footnote ** |
| (0.0154) | (0.0209) | |
| Leader age × Soc Dem | 0.0404 | 0.0505Footnote * |
| (0.0247) | (0.0304) | |
| Member vote | 0.279 | 0.594 |
| (0.397) | (0.421) | |
| Member vote × Soc Dem | −0.115 | −0.535 |
| (0.477) | (0.523) | |
| Unanimous/acclamation | 0.112 | −0.0726 |
| (0.216) | (0.345) | |
| Unan./Acc. × Soc Dem | −0.283 | −0.158 |
| (0.415) | (0.501) | |
| Log-likelihood | −453.67 | −288.89 |
| Observations | 9,559 | 6,289 |
Note: Robust standard errors in parentheses. Cox regression, Breslow method for ties.
* p < 0.1, **p < 0.05, ***p < 0.01.
Overall, we see that none of the interaction variables are statistically significant, except some weak effects of leader age in the smaller sample with the polling variable. Column 2 results suggest that older leaders are more likely to be replaced in social democratic parties compared to other parties. However, the effect is significant only at 0.1 level and substantively small. The lack of statistically significant results from Table 13.3 suggests that the same variables affect the tenures of both social democratic and other party families’ leaders and that Social Democrats are not more or less likely to respond to performance indicators as they decide when they should replace their leaders. To sum up the findings from this section, we see that different variables explain leader durations across two regions. However, pretty much the same variables explain leader durations across different party families. Are there any differences in how leadership changes affect party performances? This is the question we turn to now.
| All parties | Social Democrats | Other parties | |
|---|---|---|---|
| Government | −0.30Footnote *** | −0.40Footnote * | −0.26Footnote ** |
| (0.11) | (0.23) | (0.11) | |
| Leader change | −0.04 | 0.85Footnote *** | −0.58 |
| (0.51) | (0.33) | (0.78) | |
| In betw. Elect. changes | −0.16Footnote *** | −0.25Footnote *** | −0.12Footnote ** |
| (0.06) | (0.09) | (0.06) | |
| 10 year cum. | 0.04Footnote ** | 0.01 | 0.07Footnote *** |
| (0.02) | (0.04) | (0.03) | |
| Government × leader change | 0.52 | −1.62Footnote * | 1.60Footnote * |
| (0.65) | (0.86) | (0.88) | |
| Government × in between elections | 0.16 | 0.40Footnote * | 0.05 |
| (0.11) | (0.24) | (0.13) | |
| Government × 10-year cum. | −0.02 | −0.01 | −0.05 |
| (0.04) | (0.07) | (0.04) | |
| ΔPoll | −0.13Footnote ** | −0.12Footnote * | −0.13Footnote * |
| (0.06) | (0.06) | (0.07) | |
| ΔPollt − 1 | −0.13Footnote *** | −0.07Footnote ** | −0.15Footnote ** |
| (0.51) | (0.33) | (0.78) | |
| ΔVotet − 1 | −0.01 | 0.00 | −0.01Footnote * |
| (0.00) | (0.01) | (0.00) | |
| Member vote | −0.05 | −0.05 | −0.02 |
| (0.07) | (0.09) | (0.09) | |
| Unanimous/Acclamation | −0.00 | 0.09 | −0.03 |
| (0.05) | (0.11) | (0.06) | |
| (Intercept) | 0.07 | 0.18 | 0.00 |
| (0.07) | (0.18) | (0.08) | |
| Adj. R2 | 0.02 | 0.01 | 0.02 |
| Num. obs. | 9,149 | 2,869 | 6,280 |
Note: Robust standard errors in parentheses.
* p < 0.1, **p < 0.05, ***p < 0.01.
13.5 What Are the Consequences of (Frequent) Leadership Changes?
Following the existing research on performance outcomes of leadership changes (Pedersen and Schumacher Reference Pedersen, Schumacher, Cross and Pilet2015; Cozza and Somer-Topcu Reference Cozza and Somer-Topcu2021), we test both the short-term polling and long-term electoral effects of leadership changes and frequent leadership changes. The polling data come from Jennings and Wlezien (Reference Jennings and Wlezien2016) and are updated to 2019 using polling data from each of our countries. We use the monthly aggregated polling results and calculate our dependent variable as the change in the monthly polling performance of the party between the current month and two months later (∆Poll). We use the two-month difference in calculating our dependent variable because we believe that leadership changes and other important events likely impact opinion polls with a short lag. In addition, given that opinion polls are not necessarily done based on calendar months, using two-month lags ensures that the field dates of polls do not overlap. We also replicated our results using the monthly polling difference as the dependent variable. The results are weaker (as expected) but in the same direction.
We have three main independent variables in the short-term effects models. First is a dummy variable, coded 1 if a new leader took office that month (Leader Appointment). Given previous work, we expect a positive coefficient for this dummy variable, indicating that political parties gain in the polls from a new leader’s appointment (Pedersen and Schumacher Reference Pedersen, Schumacher, Cross and Pilet2015). The second and third variables are measures of the frequency of leadership changes. The second independent variable is a short-term measure of turnover frequency. It codes the cumulative number of leadership changes between the last election up until the current month (In Between Elections Changes). The variable ranges from 0 to 3, where 0 means that there was no leadership change between the last election and that month, and 3 means that there were three leadership elections between the last election and the current month. The majority of months in our dataset did not have leadership change since the last election (5,235 months out of 8,238 months in our dataset, which is about 64% of the months). There are only seventeen cases with three leadership changes since the previous election. Eleven of these seventeen months were coded for the German Social Democrats between November 2008 and September 2009. The others come from Canada and Australia (and are not social democratic parties).
The third independent variable measures long-term turnover frequency. It codes the number of cumulative leadership changes for the last ten years for each month in our dataset (10 Year Changes). The variable ranges from 0 to 8. There were twenty-five months in the data for which there were eight leadership changes within ten-year period. Nine of these cases were coded for the German Social Democrats between July 2013 and March 2014, and sixteen of them were coded for the New Zealand Labour Party between August 2017 and October 2018. We expect negative performance effects for both of these frequency variables.
We also control for the lagged change in polling performance (change in polling results between months m − 1 and m), ∆Pollm-1; as well as the change in polling outcomes between months m − 2 and m − 1, ∆Pollm-2; the difference in the party’s electoral performance (between elections t − 1 and t), ∆Vote; a dummy variable for whether the party was in government in that month (Government); a dummy variable for whether the leader was elected by party members (Member Vote); and a dummy variable for whether the leader was elected with unanimous support or by acclamation (Unanimous/Acclamation). We expect parties that lost in the recent election (compared to the previous election) to recover more in the polls but lose if they are in government. We add the lagged polling changes to control for serial correlation in the polling data. Following Pedersen and Schumacher (Reference Pedersen, Schumacher, Cross and Pilet2015) and Cozza and Somer-Topcu (Reference Cozza and Somer-Topcu2021), we expect the inclusive leader selection method to affect party performance positively. Finally, we also expect unanimous leader elections to increase party performance by showcasing party unity.
Figure 13.2 shows the short-term effects of party leadership changes and the frequency of party leadership changes for all parties and separately for (1) all countries, (2) European PR systems, and (3) Westminster systems. Once we control for the frequency of leadership changes, the leadership change dummy variable does not affect polling results. Regarding the frequency of changes, between-elections changes negatively affect opinion polls in the European PR systems, but the ten-year cumulative number of changes does not affect performance. None of the frequency variables are statistically significant in the Westminster systems.
The polling effects of leadership changes and the frequency of leadership changes.
Note: Figure shows coefficients and robust standard errors (with 90% confidence interval) of models testing the effect of leader replacement on short-term performance for three different samples. Models are fully specified, but the additional coefficients are not presented for space-saving purposes.
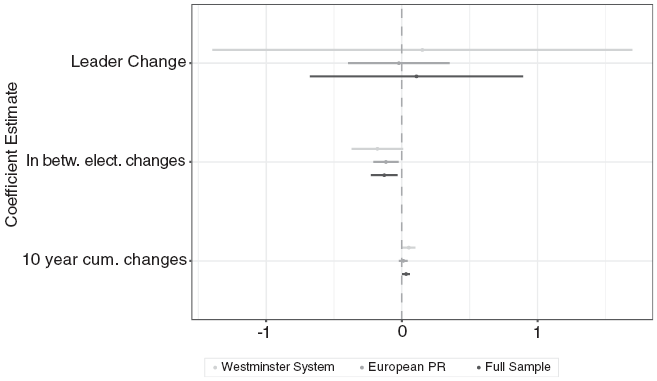
How are these results different for social democratic parties? Once again, we tested this question by running our model from Figure 13.2 by including the interaction variables between the key variables and the social democratic dummy variable. Like the duration models, given the lack of variation in different regions, we tested the results only for all countries together. The results show that the leadership change dummy variable does not have a statistically significant interaction effect with the SPD variable. That is, social democratic parties and other parties’ short-term polling performance do not differ statistically following a leadership change (see Figure 13.3(a)). The cumulative leadership changes in a moving ten-year window, however, demonstrate differences between Social Democratic and other parties (see Figure 13.3(b)). The 10 Year Changes variable is statistically significant and positive (with a 0.08 coefficient), showing that the higher the number of leadership changes within a ten-year period is, the better all other party families (other than Social Democrats) perform in the polls (although the effect is substantively small: If a non-SPD had five leadership changes within ten years, they should expect to increase their polling standing by 0.4%). The interaction variable between the 10 Year Changes variable and the social democratic dummy variable is negative and statistically significant (with a coefficient of −0.10) that suggest that the positive polling effect nullifies for the social democratic parties.
Polling effects of leader changes across party families
Note: Figure shows the statistically significant interaction effect of the social democratic party dummy with the leadership change dummy variable on the left and with the 10-year cumulative leadership changes variables. Models are fully specified, standard errors are clustered, and 95% confidence intervals are used.
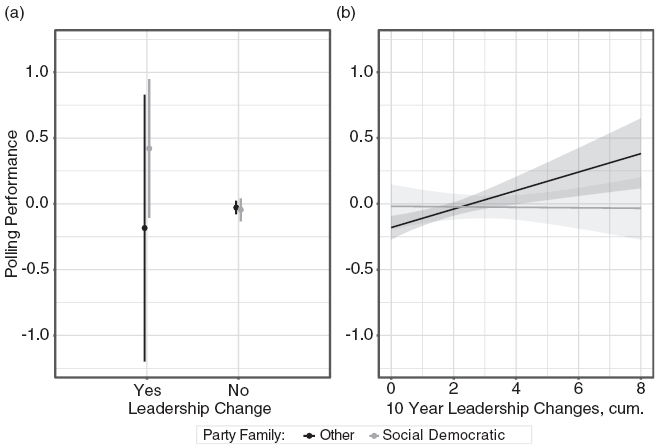
To examine the long-term electoral effects of leadership changes, we use the election results in the parliamentary elections following a leadership change, coded using the ParlGov data (Döring and Manow Reference Döring and Manow2019). We are, once again, interested in how the party’s performance changes after the leadership change. However, the often-used change in vote share variable – measuring the change in electoral performance as the difference between the current election result (t) and the result in the previous election (t − 1) – would not be appropriate to test the electoral effect of a leadership change in the interelection period. This is because a decline in vote share compared to the previous election may mean either that the new leader hurt the party’s electoral performance or that the positive impact of the leadership change was simply not (yet) enough to offset earlier losses in public support during the interelection period. Given that we cannot answer which of these scenarios reflects the reality with an electoral performance change variable measured, we use a new measure to test the electoral effects and focus only on those elections before which there was a leadership change.Footnote 7
The dependent variable in these models is the difference between the current vote share of the party in the parliamentary election at time t and the monthly polling result of the party (i.e., the party’s expected vote share) in the month before the leadership change. Using this dependent variable, we can tell whether the leadership change affected the party’s electoral performance by comparing the polling results for the party right before the leadership change to the election outcome following the leadership change.
Our independent variables are (1) the number of leadership changes that happened between the last election and the current election (In Between Elections Changes) and (2) the number of leadership changes for the last ten years before the current election (10 Year cum, changes). Because we only focus on cases where there was a leadership change in these analyses, we cannot include the leadership change dummy or its interaction with the social democratic dummy. Like the polling results models, we control for several factors. Namely, we have the previous change in the party’s electoral performance (between elections t − 2 and t − 1), ∆Votet-1; a dummy variable for whether the party was ever in government in the interelection period between elections t − 1 and t (Government); a dummy variable for whether the leader was elected by party members (Member Vote); and a dummy variable for whether the leader was elected with unanimous support or by acclamation (Unanimous/Acclamation). We also control for two additional variables here. First, we consider the number of months a new leader has been in office and count the months between the leadership change and election day (Time In Office).
We expect that, as the time passes, the potential positive effects of a leadership change might weaken and disappear, since the new leader uses her novelty, and hence media and voters might pay less attention to her. Second, we also control for the time between the announcement of the previous leader’s resignation and the appointment of the new leader (Time In Between Leaders), with the expectation that as the period in between two leaders gets longer, that would signal a divided party and may hurt the party’s electoral performance. Figure 13.4 shows the results for all countries, European PR systems, and Westminster systems. We see that there are no longer-term electoral effects of leadership changes in any of the models.
The electoral effects of leadership changes and the frequency of leadership change
Note: Figure shows coefficients and robust standard errors (with 95% confidence interval) of models testing the effect of leader replacement on electoral performance for three different samples. Models are fully specified but the additional coefficients are not presented for space-saving purposes.
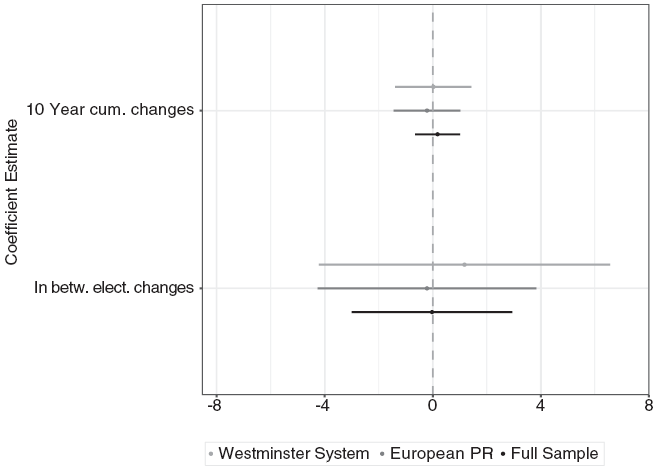
Figure 13.5 shows the conditional long-term electoral effects of the leadership change variables for Social Democrats and other parties by interacting the two leadership changes variables with the social democratic dummy variable. The results show that neither of the frequency of leadership change variables have statistically different effects for Social Democrats and other parties (i.e., the interaction variables are not statistically significant).
The electoral effects of leadership changes and the frequency of leadership changes conditional on party family
Note: Figure shows coefficients and robust standard errors (with 95% confidence interval) of models testing the effect of leader replacement on electoral performance for three different samples while focusing only on social democratic parties. Models are fully specified, but the additional coefficients are not presented for space-saving purposes.
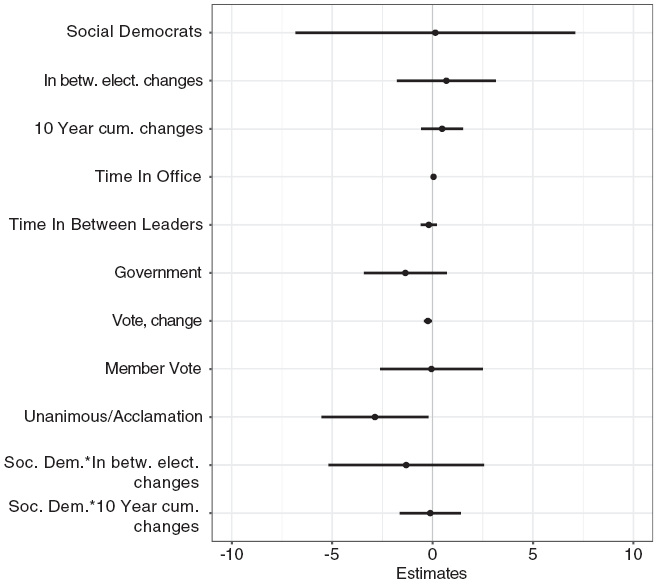
To sum up the performance results, there are no long-term election effects of leadership changes or frequency of leadership changes. This result is consistent with the existing work by Pedersen and Schumacher (Reference Pedersen, Schumacher, Cross and Pilet2015) and Cozza and Somer-Topcu (Reference Cozza and Somer-Topcu2021), which showed no electoral effects of leadership changes. Short-term polling effects exist, and there are a few interesting conditional effects for different party families (the frequency of leadership changes appears to help other party families more than Social Democrats, for instance). Still, the magnitudes of the effects are quite small. Therefore, we cannot confidently conclude that leadership changes matter for party performance or that leadership changes are especially consequential for the Social Democrats.
In additional models, we also tested whether being in government or opposition has any moderating effects on the relationship between leadership changes/frequency of leadership changes and performance. One may argue that governing parties may get punished for changing their leaders, given the leaders’ roles in government. Leadership changes among opposition parties may, however, be seen as responsiveness to bad performance.Footnote 8
Table 13.4 presents the short-term polling effects. Column 1 shows the government interaction effects for all parties, and Columns 2 and 3 show the same results separately for Social Democrats and other parties. We see in Column 1 that government status overall does not condition the effect of leadership changes on performance. However, the separate analyses for Social Democrats (Column 2) and others (Column 3) show that leadership changes have different effects for party families. The results from Column 2 suggest that social democratic parties in opposition (when in government variable = 0) gain in the polls (about 1%, on average) for a leadership change, but they get punished for having too many leadership changes since the last election (for each leadership change since the last election they lose about 0.3% in the polls). Hence, the positive effect of a leadership change disappears if the party has more than three leadership changes since the last election (but note that there are no cases with more than three leadership changes). In addition, the positive effect of a leadership change when in opposition nullifies and even becomes negative for governing social democratic parties (−1.6 interaction effect). The results in the last column for the other party families show that leadership change, on its own, does not help or hurt other party families’ polling standing when they are in opposition (the coefficient for Leader Change is not statistically significant) but a leadership change while in government significantly helps them in the polls (the coefficient for the interaction variable is positive and statistically significant). The frequency of leadership changes do not have any statistically significant differences for other party families’ government status. These results suggest that social democratic parties should be careful not to replace their leaders while in office or replace their leaders too frequently, while there is no such scrutiny for other parties.Footnote 9
13.6 Discussion and Conclusion
Do leaders of social democratic parties last shorter in office? How does their duration in office and frequency of leadership changes affect their performance? Have these party leadership changes played any role in the decline of social democratic parties in advanced democracies? This chapter empirically analyzed these questions using a novel dataset on party leadership changes across ten advanced democracies. Our results show that there are no party family differences, and we do not find evidence of a social democratic exceptionalism. The German SPD notwithstanding, party leaders across party families have stayed in office for similar periods; similar variables explain leader duration in office across different party families; party leadership changes and the frequencies of leadership changes do not have different substantive effects on parties’ short-term polling performance or longer-term electoral performance.
Our results have important implications and contributions. First, our finding of no social democratic exceptionalism suggests that party leadership changes or the frequency of those changes are not the culprits for the social democratic decline. To understand the social democratic decline, we should look into other factors than the turnover in party leadership, as the many exemplary contributions to this edited volume suggest. Second, our leader duration models show that many of the variables that have been shown to affect leader duration in office continue to be important. However, for the first time, we established that there are a few regional differences about which variables determine a leaders’ time in office. While opinion poll performances matter more in Westminster/plurality systems, membership vote is detrimental to party leaders’ continued tenure in the European PR systems.
Third, the results of the minimal effects of leader changes and the frequency of leader changes on performance are similar to the small number of studies on the question (Pedersen and Schumacher Reference Pedersen, Schumacher, Cross and Pilet2015; Cozza and Somer-Topcu Reference Cozza and Somer-Topcu2021). As the growing literature shows, leaders, their campaigns, personal characteristics, and traits affect people’s perceptions and vote choice (Butler and Stokes Reference Butler and Stokes1974; LeDuc Reference LeDuc2001; McAllister Reference McAllister, Dalton and Klingemann2007; Bittner Reference Bittner2011; Aarts et al. Reference Aarts, Blais and Schmitt2013). Nevertheless, our results also question the presidentialization thesis to some extent (Poguntke and Webb Reference Poguntke and Webb2005). According to the thesis, party leaders across parliamentary systems have become more autonomous of their parties and dominate politics (Webb, Poguntke and Kolodny Reference Webb, Poguntke, Kolodny and Helms2012). One implication of this argument is that we should see more consistent and considerable effects of leadership changes on party performance across all our cases. Based on the null results, we propose that information processing about political parties and reactions to party behavior are not overwhelmed by party leaders and are likely affected by messages produced by various party voices. Party leaders might become increasingly central and even extend their control over the organization like a “part-time autocrat” (as Kister (Reference Kister2018) described Sigmar Gabriel’s grip over the SPD), but public perception and short- as well as the long-term performance of political parties appears to depend on more than just the leader. We suggest that the party’s public image, its representation in the media, and the voters’ minds might be more complex than currently theorized.
Future research, therefore, should potentially move beyond the influence of party leadership on party performance, possibly more toward the political composition of party organizations and the changes in the numbers and compositions of party members and activists who set the tone and shape the agenda inside parties. Given that most social democratic parties have increasingly included party members and activists into party decision-making, whether it is about leadership election, candidate selection, or decisions on manifesto content (Cozza and Somer-Topcu Reference Cozza and Somer-Topcu2021), one question that still needs to be answered is whether party organizational inclusiveness has any consequences for social democratic parties. We leave this interesting question to future research.
There are other interesting questions about party leadership changes and their consequences we could not answer with our limited dataset and leave for future research. First, party leadership changes may have different effects if they signal a programmatic shift or continuity. Would Social Democrats benefit more from a leadership change or get hurt if they combine leadership changes with programmatic changes? Second, we control for leadership election results and whether the outcome was unanimous or not. One may argue, however, that the number of candidates or the level of competition for leadership election may also matter for how leadership changes affect party performance. Finally, increasingly more parties are adopting a shared leadership model with two or more leaders with different potential target clienteles at the top of the party. One such example that appears to have resulted in an electoral boost for the party is the German Social Democratic leadership structure since 2019. In the future, as these co-leadership structures become more common, it would be interesting to explore how they affect party performance.
One other future direction may be shifting the focus away from actual polling or election performance to the competence evaluations of political parties/leaders or trust in political parties that have recently changed their leaders or have had frequent leadership changes in the near past. What might matter to voters may not be whether a specific person was recently appointed leader of a party, but whether a party’s cumulative frequency of leader replacement over the entire period instills trust in a party’s competence and reliability of programmatic commitments or makes voters discount this. Given the lack of cross-national survey data exploring trust in or competence evaluations of political parties across our cases, we cannot address these interesting outcome variables but leave it to other scholars to explore these dynamics.
14.1 Introduction
Our conclusion serves several purposes. Let us first provide a brief summary of the main findings reported in the multiple complementary investigations on which this book reports. But consider it only a warm-up to address some issues beyond this study and hopefully inspiring, but surely requiring, future research. Up to this point, the book has largely avoided to take up and engage rival perspectives on the change in party systems of Western knowledge capitalism, and particularly of the varying fortunes of mainstream center-left social democratic parties. Hence the second task of the conclusion to this volume is to address influential alternative accounts that have attracted considerable scholarly attention and to discuss them considering the cumulative empirical evidence we have presented throughout this book. On the one hand, rival accounts challenge that there is any durable structure of voter-party alignments left in contemporary party systems and democratic polities have entered a world of fluidity, in which the tactical moves of – (social) media enabled – political entrepreneurs are what really counts when tracking parties’ rapidly changing electoral fortunes. On the other hand, a different tier of rival accounts – and one resonating quite strongly beyond scholarly debates, also within the deliberations among leftist political activists – sees not partisan dealignment and the fluidity of media democracy as the problem of traditional left-wing parties, but the failure of social democratic parties to act on the disempowerment of wage earners by capitalist business interests whose leverage has been magnified through globalization of the movement of goods, services, people, and capital.
This second section of our conclusion thereby addresses current debates about arguments and claims that are, in principle, tractable with empirical evidence. But in the very brief third and final section of this book, we move on to a more speculative discussion that may inspire future investigations, albeit only once the time may come for such speculations to play out in observable politics. We posit that the partisan realignments of the past generation on which we report in this volume may not generate a durable equilibrium of party competition, comparable to the stability of “frozen” party systems diagnosed by Lipset and Rokkan’s (Reference Lipset, Rokkan, Lipset and Rokkan1967) for much of the second and third quarters of the twentieth century in many West European countries. In the twenty-first century, party politicians may be able to map still a subset of novel upcoming emerging policy issues on the existing dimensions of partisan alignment. But there may be profound political challenges in the offing that could disorganize existing party systems fundamentally and put in question even how to conceive of programmatic fields identifiable by familiar dimensions of competition.
14.2 Summary of Findings: Why Social Democratic Voters Turned Away and What the Strategic Options for Social Democratic Parties Are
In summarizing the key findings of the analyses presented in the chapters of this book, we will refrain from going through them sequentially but rather propose a transversal and integrated reading of the insights they deliver. From all the analyses presented and discussed in much more detail in this book, we want to derive what we have learnt in terms of responses to the two key questions that drive scholarly and political debates about the fate of social democratic parties: First, why did voters turn away from social democratic parties over the past decades? And second, what are their strategic options in the current context?
The next few pages recount the “narrative” of what happened to social democratic parties in the left field based on these empirical findings. The upshot is that the sociostructural, the attitudinal, and the partisan space of left-wing electoral competition have become fragmented and differentiated to an extent that it has become virtually impossible for social democratic parties to hold together a large electoral coalition of 40% or more percentage of voters under one and the same umbrella program, especially in the countries of Northern and Continental Europe characterized by large and differentiated middle classes, mature welfare states, and PR multiparty competition. Hence, the electoral decline of social democratic parties clearly appears as the result of transformative and irreversible structural changes, rather than of short-term choices or “mistakes” by party leaders. Stabilizing current vote shares, limiting further losses, and trying to mobilize new cohorts of progressive voters among younger generational cohorts are the best-case scenario in terms of electoral strengths of social democratic parties in a left-progressive political field that overall remains strong and large, also among younger generations of voters. According to our findings, programmatic strategies that combine progressive left-wing positions on sociocultural issues with left-wing or moderate positions on economic issues seem the most promising strategy to approximate such a best-case scenario, depending on the configuration of party competition: In systems where social democratic parties compete for the median voter, pairing progressive sociocultural positions with left-of center but moderate economic positions seems most promising, while parties have incentives to take more radical positions on both economic and sociocultural issues in more fragmented and centrifugal party systems. However, adopting culturally conservative-authoritarian appeals appears as the most risky electoral strategy for social democratic parties, irrespective of the economic appeals they pair these positions with.
Let us go through the findings in somewhat more detail, starting with the first question: Why have all social democratic parties lost smaller or larger shares of their electoral vote shares over the past decades? More specifically, we ask: why have voters turned away from social democratic parties? To answer this question, we focus on empirical analyses of voter behavior, voter flows, and attitudinal motivations. The contributions to this volume have approached the question based on individual micro-level, as well as regional data. We have studied data on reported voting behavior and vote switching, panel data on intragenerational electoral shifts over time, as well as intergenerational electoral shifts across parents and children, and individual-level data on reported attitudes and motivations for electoral choice. The analyses combine into a strikingly consistent and robust set of insights on both voter in- and out-flows, as well as gains and retention.
In terms of losses, the empirical analyses demonstrate that social democratic parties lost voters in all ideological directions, but most strongly and most consistently towards alternative radical left or green and left-libertarian parties on the one hand and towards centrist parties on the other hand (see in particular the chapters by Abou-Chadi and Wagner, Bischof and Kurer, as well as Kitschelt and Rehm in the first two parts of this volume). More detailed analyses in the chapter by Abou-Chadi and Wagner show that losses were strongest among voters with middle and upper education levels. Besides losing voters to rival political parties, social democratic parties have also lost voters over time due to mortality (Bischof and Kurer) and to intergenerational shifts with children of social democratic parents over-proportionally voting for alternative green and radical left parties. Importantly, these findings disconfirm the widespread claim of social democratic parties having lost vote shares first and foremost because working-class voters allegedly shifted towards national-conservative parties. Several chapters in this volume provide evidence against this claim both on the basis of vote switching and voting propensity data (the chapters by Abou-Chadi and Wagner, by Häusermann and by Kitschelt and Rehm), as well as on the basis of panel data (Bischof and Kurer, as well as Ares and van Ditmars). Shifts of (working class) voters from social democratic towards right-wing nationalist parties have remained absolutely marginal. They do not represent a substantive share of voter flows, neither directly nor via spells of voting abstention, as shown with panel data by Bischof and Kurer.
These findings imply that social democratic parties cannot grow by “winning back” working-class voters from the radical right, as they were never left-wing voters in the first place. They also imply that social democratic parties need to face the challenge of losing voters – especially younger and more highly skilled voters – to other left-wing and to centrist parties. Analyzing these shifts and the attitudes of vote switchers confirms that the losses social democratic parties have faced are the result of different motivations, with losses to green and left-libertarian parties coinciding with more culturally progressive attitudes and losses to centrist parties with more moderate attitudes on both economic and cultural issues (Abou-Chadi and Wagner, Kitschelt and Rehm). Overall, there is little evidence that social democratic parties could have retained vote shares with decidedly and exclusively left-wing economic positions: While it is true that out-switchers to radical left parties on average had more left-wing attitudes on economic distribution than voters who continue to vote social democratic (Kitschelt and Rehm), losses to the radical left represent only a very minor share of the voter outflows social democratic parties experienced. Also, out-switchers on average do not have more economically left-wing attitudes than loyal voters (Kitschelt and Rehm, Häusermann). Rather, the losses in different directions seem to relate most clearly and most significantly to the changing saliency of competitive dimensions in different contexts, in particular with the emergence and strengthening of green parties in more urban contexts (Gingrich).
So who are the voters of left-wing parties in general and social democratic parties in particular today? Why do they support social democratic parties? The overall left-wing electoral potential remains quite stable, strong, and high, around 40–45% across Western European countries (Häusermann). Despite deindustrialization, this potential remains rather stable, because progressive parties mobilize large shares of middle-class voters. This also applies to social democratic parties across Western Europe. The intergenerational panel data analyses by Ares and van Ditmars, for example, show that social democratic parties have a clear and loyal stronghold among the middle-class children of working-class parents. Similarly, even trade unions today mobilize clearly more strongly within the middle than the working classes (see the chapter by Häusermann, Kitschelt, Mosimann, and Rehm). When studying the attitudinal profile of these contemporary core social democratic voters, it appears clearly that they defend left-of center positions on both economic-distributive and sociocultural issues, that is, they support generous welfare policies with regard to both consumption and investment, as well as culturally liberal positions on gender, immigration and minority rights. Several observations confirm this attitudinal profile and motivation: Very large shares – up to 70% – of social democratic voters can equally well imagine voting for green or left-libertarian parties than for the Social Democrats (Häusermann); the children of middle-class social democratic voters may not necessarily continue to vote social democratic but are consistently more likely to remain within the left-progressive field and to vote for radical left or green parties (Ares and van Ditmars); finally, even trade union members – irrespective of whether they vote for Social Democrats, green or radical left parties – are decidedly progressive on sociocultural issues, even more progressive than social democratic voters who are not union members. All these observations underline the fact that on balance, progressive positions on both economic and sociocultural issues and left-of-center positions on economic distribution have stabilized and strengthened social democratic electoral vote shares – by appealing to new segments of progressive voters via progressive sociocultural positions – rather than weakening them. However, since alternative left-progressive parties have emerged and established in most contexts, with green and left-libertarian parties acting as the spearheads of socioculturally progressive positions, of course, social democratic parties have lost parts of the left electorate. And with the attitudinal space differentiating – along two dimensions – and polarizing, they are increasingly unable to address all potential voter segments with a unified yet clearly profiled programmatic orientation.
The patterns summarized above in terms of voter shifts and attitudinal profiles are strikingly consistent across even highly different countries. The only very marginal shifts from social democratic to radical right parties, for instance, hold across institutionally and structurally very different contexts in Anglo-Saxon, Nordic, and Continental and Southern Europe (Bischof and Kurer, Häusermann). However, the patterns we identify, in particular with regard to the differentiation of the voting patterns in the left field, are most clear and most consistent in the countries of Northern and Continental Western Europe. Intergenerational shifts are strongest (Ares and van Ditmars) and so is the competitive pressure on social democratic parties, because high and increasing shares of their voters also sympathize with other left-wing parties while the “inward overlaps” are consistently smaller (Häusermann). The patterns are very similar, but more mitigated in the countries of Southern Europe, where both the party systems and the social structure are relatively less fragmented and differentiated in programmatic terms.
Having established the multifaceted challenges that social democratic parties face in terms of attitudinal differentiation and party competition, what have we learnt about their strategic options in the current context? To discuss the relative expected payoffs of different potential programmatic strategies – we distinguish left-national, centrist, old left, and new left programmatic appeals in this volume – it is important to first highlight the segmentation of electoral spaces that emerges from several of the contributions in this book, confirming recent accounts of emerging cleavage formation in Western Europe (e.g., Hooghe and Marks Reference Hooghe and Marks2018; Bornschier et al. Reference Bornschier, Häusermann, Zollinger and Colombo2021a; Hall et al. Reference Hall, Evans and In Kim2022). Indeed it appears from several analyses that – despite the persistence of a numerically important share of voters in the center of the ideological spectrum – electorates in Western European countries also exhibit sharply contoured segments of voters on the Left and on the Right, with important implications for the strategic potential of left-national appeals. We see this segmentation, for example, in the fact that there are hardly any “transitions” of voters across the ideological spectrum from any left-wing parties to the radical right, not even over an observation period of several decades, admitting for spells of abstention in between (Bischof and Kurer). Another indication of segmented electorates is that we see massive overlaps between party electorates (high shared voting propensities) within the left field, but absolutely marginal overlaps only with parties at the opposite end of the ideological spectrum, in particular with the radical right (Häusermann). Finally, Abou-Chadi, Häusermann, Mitteregger, Mosimann, and Wagner show that voters who position themselves clearly on the right are unlikely to support a social democratic party program, even if this social democratic program appeals directly to them through left national appeals. The chapter by Gingrich highlights how this segmentation of electoral blocs or fields has been amplified and exacerbated over the past decades by the emergence of the knowledge economy and social sorting along the urban–rural divide. The upshot of these observations is that there is a considerable share of voters at the nationalist and conservative-authoritarian ends of the partisan-electoral spectrum who are “out of reach” for social democratic parties. Consistent with this evidence, the vignette survey analyses by Abou-Chadi, Häusermann, Mitteregger, Mosimann, and Wagner find very little resonance of left-national programmatic appeals among centrist and left-of-center voters. On the basis of both voter transitions, attitudinal profiles, as well as the survey experimental data, it appears that a left-national programmatic strategy would be very risky for social democratic parties, as it is unlikely to attract substantial voter flows from the right and very likely to deter large segments of their current electorate.
The discussion is more complex when it comes to centrist programmatic appeals, because there are large numbers of voters in the center, and because the individual-level analyses show extensive volatility and switching between moderate left and moderate right parties, which means that even small strategic modifications may make substantive differences in absolute vote shares. The chapters by Polk and Karreth, and by Kitschelt and Rehm (Chapters 10 and 11 in Part III) relate centrist programmatic profiles to electoral outcomes, and the study by Bremer analyzes the consequences of economically centrist policies when social democratic parties are in office. All three chapters’ findings suggest that centrist strategies, from the vantage point of social democratic parties alone, without considering the left field in its entirety, may be successful in the short run, but entail massive risks in the longer run. Indeed, programmatic (economic) moderation seems to have led to short-term electoral success in terms of office-winning in the 1990s, most likely via mechanisms of competence/valence voting, leadership, and other contingent factors (Kitschelt and Rehm). However, Polk and Karreth show that voters at the left margin of the social democratic parties started sanctioning moderation in the second election after their parties moved to the center on economic issues, notably by switching to alternative left-wing parties. Kitschelt and Rehm equally highlight the risk of longer-term costs in terms of losses at the left end of the electoral constituency that seem to be the prize social democratic parties pay for short-term gains in the center. Bremer’s findings are consistent with these observations, as he shows that austerity policies by social democratic parties in power correlate with voter losses, especially after spending cuts and public sector wage cuts. In sum, it seems that centrist economic policies can indeed generate short-term electoral gains to the social democratic parties, but as voters in the center are rather volatile and voters at the left margin of the party may sanction economic centrism, the risk of aggregate longer-term losses for social democratic parties appears high.
However, the conclusions regarding the payoff of a centrist social democratic program are further complicated by the fact that we need to distinguish between the payoff for the party itself and the payoff for the electoral field of left parties overall, and between different competitive configurations. As Polk and Karreth show, social democratic parties may lose voters to green, left-libertarian, or radical left parties in the wake of economic moderation, but given the volatility of voters in the center, the net effect on the overall vote share of the left field may still be positive, especially in systems where the social democratic parties compete with an equally large moderate right competitor for the median voter. Indeed, Kitschelt and Rehm (Chapter 11) most explicitly study the vote shares of social democratic parties on the one hand and the left field on the other hand, which are associated with different competitive configurations. They show that in countries where social democratic parties historically were large mainstream parties (think of the Nordic countries, the UK or Germany), more moderate economic positions closer to the center align with higher aggregate vote shares for the left partisan field than if the social democratic parties take more radical economic positions, and they even result in roughly similar vote shares for the party itself. It is only in countries where the social democratic parties have historically been smaller (think of the Netherlands, Switzerland, France, Italy, or Belgium) that more pronouncedly left-wing positions of social democratic parties are on average associated with higher vote shares of social democratic parties. But even there, a trade-off between maximizing the party and the field vote share remains, because the configuration of a radical social democratic party and a moderate center right party results in an overall reduced left field.
Economic centrism, however, involves walking a fine line for social democratic parties. While refraining from radical “old left” stances in terms of regulation, state ownership or investment control can be interpreted as economic moderation and even be rewarded by centrist voters, actual austerity, and retrenchment policies seem highly risky for social democratic parties. Bremer shows that spending cuts in social consumption and cutting public sector wages in particular correlate not only with lower vote shares for social democratic parties, but even with lower aggregate vote shares for the left field overall.
While the economic positioning of social democratic parties is associated with difficult trade-offs and certain ambiguities, the analyses in this volume point to the fact that progressive programmatic appeals on sociocultural and economic-distributive issues (new left strategies with an emphasis on sociocultural progressivity and old-left strategies with an emphasis on economic-distributive progressivity regarding welfare policies and taxation) appear as the most promising in terms of voter reactions. This question is studied most explicitly at the level of individual voter reactions in the chapter by Abou-Chadi, Häusermann, Mitteregger, Mosimann, and Wagner, which presents voters in six countries with vignettes of stylized party programs. Within the social democratic electoral potential, old and new left strategies clearly receive the strongest support. Importantly, the findings show hardly any evidence of an economic-cultural trade-off, as new left programmatic appeals are strongly supported also by left-wing voters with lower education or income levels, as well as by voters with strong redistributive attitudes. Equally, old left programmatic appeals for generous social policies and progressive taxation receive clear support also from voters who emphasize strongly progressive sociocultural positions. These experimental findings are consistent with the observational evidence on extremely large overlaps between voting propensities for social democratic, green, and radical left parties, as well as the findings on equally culturally and economically progressive attitudes among trade union members and left voters (see the chapters by Häusermann, by Kitschelt and Rehm [Chapter 7], and by Häusermann, Kitschelt, Mosimann, and Rehm).
However, the evidence that new left and old left programmatic appeals resonate in the large and strong broader left-wing electoral potential does not imply that social democratic parties can easily realize such electoral gains. In the PR electoral systems of Northern and Continental Europe, alternative green, left-libertarian, and radical left parties with more targeted and narrower profiles have firmly established as organizations and brands credibly providing these programmatic alternatives. Among younger voters, they have oftentimes become the “core vote” over several elections. Hence, it is unlikely that very large segments of green and radical left voters would flock towards social democratic parties only on the basis of old and now left programmatic orientations. Nevertheless, such orientations can stabilize social democratic parties as viable alternatives for these voters. In majoritarian systems, where electoral laws “cage” politicians and voters across the left field into the same party label through plurality single-member district electoral systems that impose heavy penalties of nonrepresentation on small upstart parties – such as in Australia, Britain, Canada, the UK, and the United States – Social Democracy experiences tremendous internal factionalization that often undermines the parties’ competitiveness, when radical “progressive” or socialist currents capture the entire party.
Again, our findings on electoral consequences of programmatic shifts and appeals are strikingly consistent across different country contexts, suggesting structural roots to the observed shifts. Adding evidence to such a structuralist interpretation, Somer-Topcu and Weitzel show that leadership changes do not correlate with electoral outcomes of social democratic parties, neither positively nor negatively, neither in the short nor in the long run.
On the basis of all this evidence, it appears clearly that there seems to be hardly any way back to the heydays of 40% and more vote share for social democratic parties. The best scenario in the long run is to try to stabilize vote shares through old or new left programmatic strategies, in order to remain a viable electoral alternative for progressive (younger) voters. Providing an “umbrella program” that would simultaneously appeal to the entire left and centrist spectrum seems unlikely, especially in the countries of Northern and Continental Europe, where the middle classes are large and internally differentiated, where programmatic debates are multidimensional and party systems fragmented. Given the relatively smaller size and differentiation of middle classes in Southern Europe, the relative underdevelopment of their welfare states, as well as the less programmatically differentiated and segmented partisan supply, we see somewhat larger chances for an encompassing, broad, economically oriented left-wing party in the countries of Southern Europe. However, at the same time, the lower level of economic development of the knowledge economy and the welfare state impose structural limits on the potential size of such an encompassing coalition.
14.3 Rival Accounts of the Fortunes of the Left in Knowledge Capitalism
We are taking up two different accounts of the predicament of the twenty-first century Left. One of them emphasizes the increasing fluidity of political alignments and voting behavior, with a more moderate version focusing on the increasing role of political entrepreneur in an environment of social and mass communication media that induces voters’ attention and preferences to evolve in a continuous state of change, and a more radical version challenging the capacity of the overwhelming share of voters to process any political information that could create meaningful links between voters’ preferences and politicians’ policy commitments, deliberations, and performances. The other account of the left claims that existing left parties have not understood how globalization of all factors of production has undermined the policy achievements of the Left in the post–World War II era, as well the very organizational base of leftist political mobilization for a more egalitarian and just socioeconomic order that can be created only on the foundations of national rather than international political-economic orders. It is impossible to construct meaningful relationships of democratic political accountability beyond the level of nation states. The decline of the Left, then, is that it has not reckoned with the new challenges and thereby has disappointed and abandoned many voters who experience new grievances in the emerging globalized political-economic environment. The Left has given up its intellectual moorings and unconditionally conceded the validity of market-liberal thinking.
14.3.1 Decrease of Mainstream Left Parties as a Process of Dealignment, Volatility, and Agency-Driven Destructuration
A large part of the research on party system fragmentation, party competition, and political polarization has come to focus on the weakening or even loss of social structuration of electoral behavior. Starting from the observation of weakening class and religious voting (Dalton Reference Dalton2004), many studies argued that party politics in advanced democracies was undergoing a process of individualization, dealignment, and increasing volatility of electoral behavior. Accordingly, social groups – structural sociodemographic groups in particular – were argued to be ever less relevant to explain electoral preferences and electoral choice, at the benefit of more short-term, fluid and issue-based voting (Dalton, Flanagan and Beck 1984; Franklin, Mackie and Valen Reference Franklin, Mackie and Valen1992; Thomassen Reference Thomassen2005). Building on this early literature on issues and dealignment, many recent studies have emphasized the agency that political actors and policy entrepreneurs have in strategically politicizing issues, raising or mitigating issue saliency and even shaping attitudinal patterns among increasingly volatile voters (e.g., Green-Pedersen Reference Green-Pedersen2019; De Vries and Hobolt Reference De Vries and Hobolt2020). This strand of research identifies the decline of center left parties as a result of the inability of traditional party elites – constrained and captured by organizational, issue-based, and historic legacies – to adapt to changing competitive challenges, and the fragmentation of party systems as an outcome of increasingly individualistic, short-term considerations of voters who respond to a proliferating set of appeals by opportunistic issue entrepreneurs.
We can distinguish two versions of this theoretical “destructuration” argument, a stronger one and a weaker one. The stronger version argues that there are basically no structurally patterned and/or stable party or policy preferences of voters left, at all. Political preferences are almost entirely malleable to the strategies of political elites. Voter attitudes are seen as endogenous in political (group) identities (rather than policy preferences or rational-material, spatial considerations), which – in turn – are created and fostered by political elites, or brought into focus by short-term political events (Achen and Bartels Reference Achen and Bartels2016; Mason Reference Mason2018; Hobolt et al. Reference Hobolt, Leeper and Tilley2021). Achen and Bartel’s “Democracy for Realists” (2016) is probably the most resolute account of cognitively myopic and overwhelmed voters whose policy preferences are entirely endogenous in the political identities elites envelop them in.
The more mitigated version of this supply-side and agency-driven account of party-voter destructuration emphasizes – loosely based on Riker’s theory of heresthetics (1980s) – the role of political entrepreneurs who actively, rationally, and opportunistically form and exploit the issue space. Political parties are (more or less savvy, but always rational and opportunistic) political entrepreneurs who strategically politicize issues to attract votes and divide their opponents’ constituencies. Such strategies require fragmented electoral spaces and dealigned voters with no stable party attachment, willing to switch between ideological programs based on short-term issue saliency (De Vries and Hobolt Reference De Vries and Hobolt2020). In this perspective, mainstream centrist parties’ attachment to particular constituencies and topics has become a burden, rather than an asset, impeding them from flexibly seizing novel opportunities in terms of issue saliency and issue framing, while challenger party elites have more entrepreneurial leeway and opportunity.
Our theoretical framework in this book does share quite some common ground with the more moderate version of agency-driven electoral change, as we equally emphasize the relevance of agency in terms of supply-side programmatic strategies and their effects. We also argue that political choice is important, and that parties are rational actors, seeking to emphasize programmatic positions and issues strategically. However, while entrepreneurship is indispensable in politics, it is ubiquitous and mostly electorally unsuccessful. The presence of entrepreneurs is thus not informative to predict party system change. The outliers of successful entrepreneurship, then, cannot be explained without an understanding of the sociostructural realignments that have created opportunities and constraints for a particular subset of entrepreneurs and their strategies. Over the last several decades, it is no coincidence that those who did not fail – green, left-libertarian, and radical right parties in particular – have been thriving on highly similar, consistent appeals to clearly identifiable sociostructural electoral potentials. Entrepreneurs launch appeals, but these appeals need a fertile sociostructural soil to resonate. This sociostructural terrain has become more fragmented, making it harder – or even impossible – for even the most able and well-informed political entrepreneur to appeal to 40% or more of the electorate at the same time. In DeSio and Weber’s terms (2014), sociostructural fragmentation has made “bridge issues” rarer and politicians are stuck in situations in which the “issue yield” of repositioning themselves is nowhere as large as in their heyday. In other words, we do not contest the prevalence and relevance of political entrepreneurs, but social structure constrains their leeway and conditions their success. Hence, the heavy explanatory lifting of party success in our perspective is in the strongly constrained demand-side, rather than in the abundant, versatile, and diverse supply side. This is our main theoretical counterargument against an overtly supply-side–driven perspective on challenger parties as political entrepreneurs.
However, our book also provides manifold specific empirical insights that contradict the answers the issue entrepreneur perspective would give to our two key questions. To the question of which voters center left parties lost, to whom and why, these studies would reply that challenger party elites attracted former mainstream party voters by opportunistically raising “wedge issues” centrist parties were ill disposed to address properly (De Vries and Hobolt Reference De Vries and Hobolt2020). The implication is that we would expect to see losses from mainstream left parties to all challenger parties, both on the Left and on the Right, and to different extents across countries, as party leaders are unlikely to be equally able at strategically devising new issues. We would also expect to see considerable variation in the substantive content of the challenger party agendas, depending on the national opportunity structure and context. However, our findings are at odds with these observable implications: What we indeed see throughout the analyses in this book is that voter flows remain overwhelmingly and narrowly contained within the ideological left field, and both flows and stability concentrate in consistent, identifiable sociodemographic groups of occupational class, education, and age in particular. When voter flows leave the left field, they over-proportionally go to mainstream right parties, rather than to new challenger parties on the right (for the evidence on structured voter flows, see the chapters by Abou-Chadi and Wagner, by Häusermann, Bischof and Kurer, and by Ares and van Ditmars). We also see that voters who switch parties do so in spatially very consistent ways, along encompassing ideological dimensions: We indeed observe robust relationships between the programmatic preferences of these voters along broad ideological dimensions, and the directions in which they switch across countries and over time (see Chapter 7 by Kitschelt and Rehm). Moreover, we see striking similarities between countries, which are incompatible with the contingent and context-specific perspective on opportunistic issue entrepreneurs: In particular, we see cross-national consistency in the directions and extents of voter flows, in the programmatic preferences of left voters over policies and consistent policy bundles (Abou-Chadi, Häusermann, Mitteregger, Mosimann and Wagner), and even in the programmatic supply of (challenger) parties across countries. In short, we see structure and order where the issue-entrepreneur perspective expects volatility and variance, and we see voter flows and voter preferences rooted in sociostructural categories, where purely supply-driven accounts of political transformation would expect heterogeneity and dealignment. Our observations are also in line with the by now massive body of empirical evidence demonstrating realignment along programmatic dimensions (e.g., Kriesi et al. Reference Kriesi, Grande, Lachat, Dolezal, Bornschier and Frey2008; Häusermann and Kriesi Reference Häusermann, Kriesi, Beramendi, Häusermann, Kitschelt and Kriesi2015; Kitschelt and Rehm Reference Kitschelt, Rehm, Beramendi, Häusermann, Kitschelt and Kriesi2015; Dalton Reference Dalton2018; Oesch and Rennwald Reference Oesch and Rennwald2018; Hagevi et al. Reference Hagevi, Blombäck, Demker, Hinnfors and Loxbo2022; Hall et al. Reference Hall, Evans and In Kim2022).
The more radical version of the dealignment argument would contest the strong role we ascribe to sociostructural groups and their preferences as constraining actor strategies by arguing that group belonging and policy preferences are endogenous in elite appeals. Hence, the assumption here is that political parties at least potentially have the ability to form idiosyncratic group identities, to raise the saliency of particular issues and then propose programmatic options along these issues. Endogenizing demand-side attitudes and preferences obviously theoretically expands the scope for strategic agency for all parties. For social democratic parties, in particular, this would mostly likely imply that they could in principle by themselves revive the saliency of economic class conflict above new(er) sociocultural issues, by appealing to vertical class conflict and by emphasizing traditional interests and policies associated with this class conflict.
However, as we have shown in this volume, there is ample evidence that the overall saliency of issues and issue dimensions, as well as the programmatic preferences of voter groups and the importance they attach to particular questions are to a large extent beyond the control of parties – and even more so beyond the control of individual parties. If attitudes and saliency were so dependent on supply-side strategies and appeals, we would witness much more variance in voter attitudes and dimension saliency across time and space. However, the left-wing electoral potential today holds consistently progressive attitudes on both economic-distributive and sociocultural issues, irrespective of the fact that electoral realignment and the rise of challenger parties has emerged in different configurations and at different levels of speed across countries. Furthermore, the changing substance and relevance of politicized group identities, the development of broad attitudinal patterns among these social groups and electoral constituencies, as well as the development of programmatic party profiles have developed in strikingly similar ways across countries (e.g., Kriesi et al. Reference Kriesi, Grande, Lachat, Dolezal, Bornschier and Frey2008, Reference Kriesi, Grande, Dolezal, Helbling, Höglinger, Hutter and Wüest2012; Kitschelt and Rehm Reference Kitschelt, Rehm, Beramendi, Häusermann, Kitschelt and Kriesi2015; Bornschier et al. Reference Bornschier, Häusermann, Zollinger and Colombo2021a; Hall et al. Reference Hall, Evans and In Kim2022). All green parties equally advocate cultural liberalism and liberal immigration policies; all right-wing nationalist parties share not only restrictive immigration stances but also more authoritarian, punitive views of law and order and civil liberties. Also, we have not yet seen the successful uptake of a relevant left-authoritarian political party or movement in any West European country over the past years, even though purely opportunistic models of party competition would predict the emergence of parties with such appeals. The high degree of structuration and consistency of these changes conveys the insight that the voter preferences underlying programmatic politics are rooted in people’s social experiences and that spatial party competition reflects inherent links across ideological-programmatic policy claims, which do not resonate if opportunistically combined. Beyond these consistent attitudinal patterns that contradict an overtly supply-side–driven and constructivist perspective on voter behavior, the continued and consistent structural sorting of voters into different parties – by socioeconomic background and by sociocultural markers of milieus and habits – contradicts a radical dealignment argument. Using outdated categories of structuration (such as old class schemes or income) may obscure how strong the structuration of voting behavior has actually remained, but once we use categories that allow us to adequately capture voters’ economic and social circumstances in the knowledge economy, we understand that despite the “sea of variance and randomness,” which naturally constitutes social reality, party system change reflects a limited set of clearly identifiable sociostructural shifts and central tendencies. This observation does not imply an overly rationalistic understanding of programmatic spatial voting. It is entirely consistent with the idea that voters identify with social and political groups, that these groups are politicized and perpetuated through the interplay of elites and voters, that voters form preferences based not only on material interests but also on identities and group belonging (an idea central to the literature on structural social cleavages and party systems), and that parties can appeal to groups via both policy claims and cues, heuristics and symbols (e.g., Mendelberg Reference Mendelberg2018). Acknowledging the relevance of social groups does not imply subscribing to a purely supply-side–driven understanding of preferences and policy demand, as group identities are rooted in social structure.
14.3.2 Decline of Social Democracy as a Failure to Choose Electorally Superior Party Strategies: The Class-Analytical Framework to Study Social Democratic Decline
This book’s investigation explains the predicaments of Social Democrats’ strategic choices in the context of the changing educational and occupational structures, technological innovation, demographics, and family/gender relations that shape people’s preference distributions on the demand side and the different configurations of party competitors within different institutional settings on the supply side. Capitalism prevails, but social class and the traditional class conflict – understood as the politicized divide between capital owners and wage earners – is not dominant in patterning the competitive partisan dynamics. There is, however, a powerful counter-perspective in the political science literature that challenges our analysis of the left field and provides a rival explanatory account. Politically, this rival perspective has politically energized and enchanted countless radical activists within social democratic parties and the left field. Let us call it the “industrial capitalism” class-centered analysis identifying economic globalization as the main culprit causing social democratic electoral decline when party strategists promote rather than fight it with a muscular agenda of national control and economic redistribution in favor of wage earners.
In examining this alternative explanatory account, we start by stating the positive, empirically testable claims of the class analytical perspective, before appraisal how the empirical findings presented in this book for the most part contradict them. We will then briefly work back to a critical appraisal of the theoretical assumptions about party competition and the underlying political economic framework in which the class analytical perspective is grounded. Let us present the key claims of the class analytical perspective in four propositions.
First proposition, the globalization hypothesis: In light of increasing economic globalization of the flow of all factors of production – and especially capital – labor in affluent capitalist democracies has lost leverage over capital to accept lower profit rates and redistribution necessary to sustain comprehensive welfare states. Capital may invest abroad and reduce domestic employment (offshoring of labor), import goods and services from abroad where it has invested, and shift cheap labor into an economy to depress wages and residual union bargaining power. Globalization threatens to abolish the foundations of the post–World War II democratic class compromise by weakening union power. Globalization also decreases the domestic political “room to maneuver” in macroeconomic fiscal policy that national domestic governments may have enjoyed in a previous era, a claim indeed empirically corroborated by a number of studies (cf. Boix Reference Boix1998; Garrett Reference Garrett1998; Hellwig Reference Hellwig2015; Jahn Reference Jahn2006).
Second proposition, the social democratic acquiescence hypothesis: On the political field, Social Democrats have caved in to the demands of capital, accepted (or even promoted) liberalized trade and capital markets, and stood by idly when the share of GDP accruing to profits rather than wages went up, and cut back welfare state social programs benefiting the working class (e.g., Berman and Snegovaya Reference Berman and Snegovaya2019; Blyth and Katz Reference Blyth and Katz2005; Haupt Reference Haupt2010; Hopkin and Blyth 2019). Social Democrats have moved away from leftist socioeconomic policies of social protection and income redistribution and become engines of economically right-wing “Third Way” politics that systematically ignores the demands of lower wage earners for redistribution and economic security in favor of market mechanisms of allocation and emphasis on individual incentives and competition. This trajectory has been assisted and reinforced by the organizational assimilation of economic ideas originating among liberal pro-market professional economists and seeping inside social democratic parties. These ideas prime economic efficiency and macroeconomic stability of growth (Mudge Reference Mudge2018), while sidelining working-class claims for a dignified social existence with a modicum of economic equality and social recognition of all.
Third proposition, the party system cartelization hypothesis: In order to defend their own political survival and bargaining leverage, social democratic center-left parties have closed ranks with center-right mainstream parties. In light of the external constraints of globalization, they agree on broad lines of economic and social policy and engage merely in valence competition about which party most competently enacts such policies. In order to prevent new political entrepreneurs from attracting dissenters from the status quo in general elections, all of the mainstream parties agree on arrangements – particularly through public party finance benefiting the existing parties or access to mass media – to raise the thresholds of expenses and effort new partisan challengers must overcome to appeal to voters effectively. Mainstream parties constitute “cartels” that close off competition, but thereby exacerbating popular dissent and dissatisfaction with the “mainstream” political alternatives (Katz and Mair Reference Katz and Mair1995, Reference Katz and Mair2009, Reference Katz and Mair2018; Blyth and Katz Reference Blyth and Katz2005; Mair Reference Mair2013).
Fourth proposition, social democratic parties’ acquiescence to a capitalist liberal market status quo has alienated a disaffected working class: Disappointment with the centrist strategy of the organized political Left buying into the market liberalization of capitalist economies has led core working-class constituencies either to abstain massively, or to support radical leftist competitors to Social Democracy (Arndt Reference Arndt2013). Alternatively, the alienated working-class voters even abandoned the Left altogether, switching toward anti-immigrant, xenophobic, and nationalist populist parties of the extreme Right. The social democratic Left reneging on its traditional promises has thereby opened the door to a fundamental right-wing populist threat to democracy in general (Berman and Snegovaya Reference Berman and Snegovaya2019). High electoral volatility, decline of electoral participation, and collapsing party membership, especially among the younger age cohorts, are seen as signals of a widespread disaffection with current democratic politics.
We can now evaluate these hypotheses in light of the evidence our volume has examined by working backwards, starting with the behavioral implications regarding voter behavior and voter flows. Over the course of the past generation, if the class theoretic perspective were correct, the voter flow out of social democratic party constituencies should have overwhelmingly benefited radical leftist parties, particularly among workers and especially when these social democratic parties adopted moderate strategies. Social Democrats should perform electorally better by reasserting their leftist stance, and the leftist field would have had more leverage to influence the political economy with such a leftist stance.
With regard to voter flows, however, the chapters of the first part of our study document that Social Democrats have lost voters in all directions of programmatic-ideological alternatives. First, a great deal of vote switching took place among old-fashioned mainstream parties, with voters switching to moderate right parties, which is entirely at odds with the fourth proposition of the class-analytical framework. Second, the numerically most severe losses Social Democrats suffered went to green and left-libertarian parties that compete less on redistributive economic and social politics, where they sometimes tend to take more moderate stances than even centrist Social Democracy. Instead, these parties emphasize second dimension issue positions on libertarian political and social governance (civil liberties, participation, and gender relations) and multiculturalism (immigration, affirmative action, and cultural representation). Also, it is only a small share of social democratic electoral losses that benefit the electoral fortunes of far left competitors. Moreover, the losses of social democratic parties did by no means concentrate predominantly among working-class voters. Rather losses occurred most strongly among more highly educated strata of voters. Some working-class voters indeed defect to radical left parties, but even those parties attract stronger influx from sociocultural professionals. The class-theoretical perspective has nothing to say about the rise of these green left parties that have eaten into social democratic support.
Finally, few voters of the Left, including working-class voters, abandon Social Democracy in favor of radical right parties. Radical right voters are mostly recruited from center-right parties and from the pool of nonvoters. This also includes mostly workers who have never voted for parties of the Left in the first place. Radical right parties do attract greater proportions of working class and other lower income, less educated voters, when compared to the proportion of educated and more affluent voters within their electorates. But this does not imply that these working-class and lower-income voters originated from or ever were available to left parties. Many are low-income, less educated voters who never got a chance to obtain working-class jobs, particularly among the younger cohorts, and more specifically here among men who constitute an increasing share of low-education adults.
The main problem of Social Democracy with working-class voters, then, is different from what the class analytic narrative asserts. For one thing, the proportion of working-class voters – or more generally voters with low education and low income – is numerically and proportionally shrinking, particularly so among younger voters. In a very long-run structural perspective, there is only a subdued electoral future, therefore, in a Social Democracy primarily pinning its hopes on such voters. For another thing, many of these younger poorer voters have never been socialized into “typical” working-class occupations. They contribute to the new and – depending on political economic institutions – numerically substantial category of outsiders on the periphery of labor markets, often only intermittently employed mostly in low-skill personal service sector jobs (Emmenegger et al. Reference Emmenegger, Häusermann, Palier and Seeleib-Kaiser2012). They are an electorally under-represented category of citizens (if they have voting rights at all), and they reveal the increasing economic inequality characteristic of many advanced knowledge societies, but they are hard to mobilize with conventional social democratic templates, as their needs and demands are not shared by broad social strata, and as new issues have come to dominate the political agendas. In short, there is not a vast mass of precarious, “poor” citizens out there to which Social Democrats could appeal. There is a highly stratified and segmented occupational structure in which the poorest groups are a minority. There is a broad group of middle-income, intermediate-skill citizens in society, working in private enterprise or in nonprofit institutions and civil service administrations, who are captured neither by categorization as the declining working class nor by that of academically higher-grade certified professionals. In terms of the Oesch occupational class scheme (2006), they would qualify as members of the strongly expanding classes of sociocultural semiprofessionals, associate managers, or technicians. They overall share the preference profile of the professional/managerial classes, but somewhat more moderately: They support social protection and economic redistribution, as well as moderate dosages of many of the objectives left green parties advocate. But they cannot be persuaded by politicians who appeal to outlier groups and activists. As the analysis of several chapters has shown, an appeal to these groups will not make Social Democracy spectacularly successful in electoral terms again. But these voters most likely cannot be wooed to join a radical left or radical green left strategy either.
Based on the observable voter flows surrounding Social Democracy, it is not surprising that a radical left strategy has paid off not particularly well for social democratic parties, although movements to the left have not always electorally hurt them, particularly if social democratic parties are comparatively small already in the 1980s and can successfully contain the rise of parties of the Green Left and Radical Left by drawing close to these competitors’ positions. It is also unsurprising that distinctive radical left parties, competing with reformist, centrist Third Way Social Democrats, have not rallied a great deal of electoral support, and certainly not among the working class, particularly in the most advanced knowledge societies of Northwestern Europe with formerly powerful social democratic parties. Let us briefly review that record.
In electoral systems of proportional representation, where new party entry is associated with rather low costs and thresholds of legislative representation, radical left parties have achieved respectable rates of electoral success in Scandinavia (running under labels such as Left Socialists, Socialist People’s, Left, or Left Alliance parties since the early 1960s), the Netherlands (Socialist Party), and Germany (The Left). They and their likes have sometimes benefited from Social Democrats’ turn to the center, but they have never managed to exceed a modest ceiling of electoral support well under one-sixth of the total vote. In other countries, such as Austria, Belgium, and Switzerland, radical left parties could never even evolve beyond the status of small splinter parties. So, while there is a substantial hard leftist constituency for a more radical socialist economic agenda, it clearly resonates with only a limited, specialized audience unlikely to dominate the entire left political field. And even then, starting already in the 1970s, most of these radical left parties “modernized” their appeal by emphasizing libertarian positions on second dimension issues of political and cultural governance and social identities, clearly going beyond their staple economic leftism and eventually appealing mostly to nonworking-class constituencies, particularly voters of the educated middle class in middle- or high-skilled cognitive and interpersonal nonroutine jobs.
If the class theoretic argument were correct, radical left parties should substantially gain votes by denouncing Social Democrats’ centrism, particularly after left coalition governments from which the far left parties then walked away in protest against social democratic neoliberal moderation. But there seems to be no single empirical observation to confirm that pattern. In Denmark, for example, the Socialist People’s Party lost heavily in 2011, after denouncing the centrism of its previous social democratic partner. And in Sweden, in the 1998 election, the Left Party won votes from its then centrist social democratic coalition partner, but while sticking to the alliance and thereby tacitly tolerating the coalition’s centrism.Footnote 1 In Greece, finally, it was a new radical leftist party government, Syriza, elected in 2015 that eventually caved in to Northern European demands to solve Greece’s economic crisis through financial austerity policies. But the effort to field a new leftist alternative to displace Syriza in the 2019 legislative election, spearheaded by the party’s former Finance Minister Yanis Varoufakis, got electorally nowhere (3.4% of the vote), and Syriza actually lot most support to its moderate right-wing competitor.Footnote 2
Next, let us consider how radical leftism plays out in party systems operating within first-past-the-post single-member district systems with plurality ballot. Here left activists face extremely unfavorable odds in overcoming thresholds of representation for a new party. Given low probabilities of new party success, radical activists can hope to impact left strategy by working through the organization of the hegemonic moderate left party, such as the British Labour Party. Radicals constitute distinctive intraparty factions in order to capture their entire party eventually and impose a radical socialist strategy. This is what the left socialist factions inside the British Labour Party successfully practiced in the early 1980s, making Michael Foote their party leader and prime ministerial candidate (1980–83), and again in the 2010s catapulting Jeremy Corbyn (2015–20) into the leadership position. In both instances, in national legislative elections, the radical strategy and leadership ultimately yielded defeats in which actually both working-class and nonworking-class voters abandoned the party, albeit at differential rates.Footnote 3
Finally, there is France with an electoral system that induces mixed incentives for radical left-party differentiation or pooling of left voters under a single-party umbrella. On the one hand, its single-member electoral districts encourage consolidation around single parties in a left and a right camp. On the other, its two-round run-off majoritarian electoral formula facilitates party system fragmentation in the first round and loose coalitions of parties in the run-off round. Here mainstream Socialists can afford to make more radical appeals in the first round, while simultaneously more radical left and more centrist parties within the left field advance their own distinctive pitches. Until 2012, this configuration of electoral system enabled Socialists to furnish one of two candidates in the second-round run-off presidential elections, except in the 2002 election, or the run-offs in individual districts in legislative elections. Since then, however, the postindustrial societal differentiation of political preferences within both left and right partisan fields has enabled new political entrepreneurs to change the electoral game such that that the conventionally dominant two center-left and center-right mainstream parties have been displaced by a much more complicated and polarized landscape of competitors. But this does not imply that a powerful radical Left would substitute for an exhausted, fragmented, and demobilized center Left. In the legislative election of 2022, the coalition of radical left and green left parties, augmented by fragments of the old socialist party, NUPES (Nouvelle Union Populaire Écologique et Sociale), garnered a touch over 25% of the vote in the first electoral round. Public commentators perceived this as a great success of the French Left, but the electoral alliance’s performance produced only a minor improvement over the combined electoral tally of its constituent parties in the preceding 2017 election. More importantly, it delivered worse results than the old mainstream Socialist Party and its left field allies achieved in every single legislative election between 1981 and 2012.
To summarize, the empirical implications of the industrial capitalism class-centered theory for social democratic electoral success in the twenty-first century, stated earlier in postulate 4, namely, a strategy of left radicalism appealing to a working class – or generically poor, less educated – vote constituency, are not borne out by data on voter movements and relative party strengths. As indicated in this volume, green and left-libertarian or moderate strategies appear to be electorally more promising. Social democratic strategy has to recognize the complexity of socioeconomic challenges in knowledge society and consequently the divisions among voter groups broadly sympathetic to the social democratic idea. Moreover, electoral success depends on the configuration of competitors within and beyond the social democratic field. Social democratic strategies that may be best for the individual parties’ electoral success do not always turn out also to advance the social democratic field, when there is a differentiation of the partisan options with the field.
If the class analytical approach fails to characterize the landscape of political competition in knowledge society, this generates the suspicion that there may be flaws in the empirical validity of the underlying fundamental propositions that generate the factually inaccurate claims about voter movements in and out of social democracy and conditions of social democratic electoral success. These underlying political-economic and institutional arguments are not the direct object of investigation in our volume. But let us briefly identify where we suspect some problems are buried with the class-centered framework.
The class-theoretic perspective suggests that social democratic parties have joined a “cartel” of the mainstream parties (proposition 3) in order to ensure electoral support, despite abandoning the interests of their working-class core constituencies (proposition 2). As discussed a generation ago (Koole Reference Koole1996; Kitschelt Reference Kitschelt2000), there is no theory of how such cartel could provide incentives for politicians not to defect and no evidence of a cartel among parties, understood in the technical sense of preventing entry of competition, regulation of supply, and price fixing. The mechanism is supposed to be public party financing, rendering entry of new parties more difficult. In practice, however, public party financing has encouraged entry in the countries with most generous funding. Realizing the proliferation of electorally attractive new “challenger” parties in systems said to be cartelized by public party finance, cartel theorists (Katz and Mair Reference Katz and Mair2009, Reference Katz and Mair2018; Mair Reference Mair2013) then argued that it was precisely such cartels that incited enough voter outrage to promote the electoral fortunes of radical left and right-wing populist alternatives. But the theory cannot have it both ways. Either it predicts that cartels restrict competition, and that politicians achieve it with cartelization. Or the theory predicts that cartelization produces more fragmentation, but why didn’t politicians in mainstream parties then stay away from it or quickly corrected their error? The cartel theory appears to assume an extreme myopia among mainstream politicians that is hard to fathom.
Discrepancies between salient voter preferences on an issue and available party positions can be explained more consistently and straightforwardly than by cartel party theory. To adopt a new position, parties need to calculate their electoral trade-offs and issue yields (DeSio and Weber 2014). Established parties might find that responding to an issue position may boost their short-run support, but with negative longer-run electoral consequences. Or parties may find that serving a new issue position will yield a negative electoral issue yield, as the party’s attractiveness to new voters embracing that position will be more than offset by internal divisions among existing supporters and defection of previous loyalists. Both considerations can lead to apparent gaps in responsiveness but do not require any reference to a cartelization claim.
Beyond the theoretical difficulties of the cartel theory, the existing empirical evidence quite consistently shows that whichever direction party competition has taken, the programmatic appeals of political parties are still broadly congruent with those of their voters. If anything, it is the radical parties of the Left and Right whose appeals appear to diverge from their more moderate electoral followings (see Hagevi et al. Reference Hagevi, Blombäck, Demker, Hinnfors and Loxbo2022: 146). Likewise, it is not true that mainstream politicians can conjure up this programmatic congruence of preferences simply because public opinion is endogenous to elite appeals. There is a complex intertemporal back and forth between elite position taking and mass public opinion change (Hagevi et al. Reference Hagevi, Blombäck, Demker, Hinnfors and Loxbo2022: 151–8) and there is considerable evidence that often public opinion is in the lead of party appeals (Barbera et al. 2019). It is not, as suggested by Achen and Bartels (Reference Achen and Bartels2016), that parties announce their programmatic position, and voters, then, simply adopt whatever their elites tell them to do, blindly following their affective partisan identification. At least on salient issues voters may consciously abandon a party, when it announces certain positions that diverge from voters’ preferences (Carsey and Layman Reference Carsey and Layman2006; Goren and Chapp Reference Goren and Chapp2017; Evans and Neundorf Reference Evans and Neundorf2020).
These dynamic accountability mechanisms are also in full display in evidence reported in this volume. Voters switch in substantively consistent ways to parties that are close to their personal preference schedules. Social Democrats have difficulties keeping their voters, as they depart in different ideological-programmatic directions: Pleasing one group of dissatisfied supporters may only further antagonize another.
Empirical evidence also defies the claim that social democratic parties have simply converged with the moderate right, thereby abandoning their electoral constituency’s preferences (proposition 2). In some countries, on some dimensions, a modicum of convergence has taken place. In others, on some policy dimensions, greater divergence, if not polarization, has prevailed in the configuration of parties (see most recently: Hagevi et al. Reference Hagevi, Blombäck, Demker, Hinnfors and Loxbo2022: chapters 4–7). Even if, by some measures (cf. Boix Reference Boix2019: 145), Social Democrats on average shifted slightly toward the center in social and economic policies in the 1990s and 2000s, the appearance of convergence often resulted from a shift of both center-left and center-right mainstream party camps toward that center, not simply just Social Democrats moving (Boix Reference Boix2019; Gingrich and Häusermann Reference Gingrich and Häusermann2015). Hence, the observation of a mild right-shift of social democratic parties in the 1990s needs to be complemented by the observation of a relative left-shift of center-right parties, rather than an overall neoliberal reversal on both sides.
Finally, there is little evidence that governing parties, and particularly Social Democrats, abandon their programmatic pledges, once in office and thereby ignore their voters’ preferences. Parties actually do realize many, and often most, of their preelection pledges.Footnote 4 The best placed pledges are those catering to preferences of large blocks of voters in the middle of the electoral preference distributions whose support is needed to capture the median voter area and enable parties to sustain government majorities. As a consequence, a “middle class” will always be better represented and exercise greater leverage over policy than extremely poor voters (Elkjaer and Iversen Reference Elkjaer and Iversen2020, Reference Elkjaer and Iversen2023).
To provide a stark example of Social Democracy’s electoral responsiveness to lower and middle strata voters, let us take the posterchild of the class analytical critique, the British Labour Party under Tony Blair charting a “Third Way” political strategy. Ironically, that party and that leader did more to expand the British welfare state than any other UK government since World War II. In real inflation-adjusted terms, upon ascent to office in 1997, this party increased public budget expenditure on pensions, health care, and education from about 280 billion GBP in 1997–98 to more than 480 billion GBP in the last fiscal year of the Labour administration 2010–11 (UK Government. HM Treasury 2022). This expansion amounts to an annual real increase of more than 4% in each and every year of Labour in office, a faster expansion than in any previous Labour governing spell in Britain, including the 1946–51 period, and a record rarely matched by social democratic governments anywhere in the Golden Era of postwar economic growth. This does not mean, however, that the Labour Party served Britain’s poorest and most marginalized constituents, as demonstrated by its workfare policy, its aversion to increasing unemployment benefits, means-tested income support and income tax progressivity, as well as its resistance to undoing many of the preceding Conservative governments’ benefits reductions. The party also liberalized the public sector by infusing elements of competition into government services and by contracting out tasks to private business. Thus, Labour’s Third Way strategy can also be accounted for by a blunt calculus of electoral accountability, catering to the vast mass from lower to upper middle-income voters much more so than to the very poor, as objectionable as this strategy might appear from a perspective of radical social equalization.
To explain why social democratic parties’ agenda of social and economic policies have changed over time, we also need to focus on the entirely new twenty-first century knowledge capitalism challenges that interact and conflict with one another and compete for resources and attention among political constituencies broadly sympathetic to the basic social democratic idea. We have repeatedly shown throughout this study how different old and new socioeconomic groups populate the broadly social democratic field. They are heterogeneous in terms of age, gender, ethnicity, education, income, skill type, and employment sector (public or private, export-oriented or domestic) to mention only the most important ones, and they react differently to the challenges of skill-biased technological progress, the demographic transition, the changing role of family units, and the exigencies of ecology and climate threats. These groups have different needs and different relative priorities when it comes to public pensions, health care, family support, education and professional training, gender equality, equalization and recognition of ethnocultural claims, and environmental protection. That is a key reason why the social democratic field yields a proliferation of multiple parties, whenever electoral institutions permit it, and the complexity of these programmatic trade-offs for the left cannot be reduced to Social Democrats acquiescing to the globalization of capital markets and letting the democratic class compromise of the post–World War II era fall by the wayside. Social Democrats never walked away from that compromise, but the compromise has been tested and rendered incomplete and insufficient by these new challenges. Welfare states have not meaningfully shrunk anywhere in advanced capitalist economies. The reality of the situation is that in most countries, social expenditures are hovering near historically high ceilings, but that demand is expanding and differentiating – for pensions, health care, education, family support, eldercare, or retraining.Footnote 5 Even when party governments, including Social Democratic governments, have cut back individual entitlements, gross expenditures – particularly for pensions and health care – have continued to increase. In this context, social democratic parties are coping to deal with new challenges and old commitments, and there are different agendas within the social democratic field.
In sum, the class-theoretic perspective largely ignores the multidimensional and complex societal challenges that are experienced by the vast mass of twenty-first century inhabitants of knowledge capitalist society, and which cannot be captured by simple wage earner/business class divisions alone or even primarily. In the welfare state literature, the emergence of new dimensions of social risk and demand, which deviate from the traditional redistributive logic, have been theorized under the label of “new social risks” (e.g., Bonoli Reference Bonoli2005; Bonoli and Natali Reference Bonoli and Natali2012; see related Rehm Reference Rehm2016; Iversen and Rehm Reference Iversen and Rehm2022). Building on and expanding this idea, the new risks and challenges that weigh on citizens in the early twenty-first century are multifaceted and multidimensional in ways that transcend the realm of social policy. Relevant issues for wide shares of the society – well beyond the lower income strata – encompass questions such as: Can I afford to enable my children to acquire the skills that will ensure them to earn a decent living throughout their adulthood? Will I myself continue to have skills that provide me with predictable market income? What does addressing these challenges mean for my social and my family life, my gender, and intergenerational relations? Will I be able to afford to retire with a decent pension when I will approach old age, despite spells of atypical employment or employment interruptions for care or education? Beyond social welfare, people ask: Will I be able to extend my life expectancy by relying on all the critical improvements in health care that are becoming technologically available but that are extremely costly because of high labor and capital inputs? Will I and my children be safe and accepted socially despite deviating from majority social norms? Will my quality of life deteriorate due to global warming and the loss of biodiversity under way, and what sacrifices are in order to prevent these consequences?
These are all questions that generate high levels of anxiety and stress across much of the electorate in knowledge societies. Political parties and politicians – social democratic parties and all others – are grappling with responses to these novel questions, and they come up with different answers, contingent upon the constituencies they are dealing with, or have not found any answers at all. This situation contributes to a fragmentation and reconfiguration of the partisan electorate not satisfactorily captured by the class theoretic perspective.
14.4 Outlook: The Future Will Be Different Than the Recent Past Analyzed in This Study
Going back over fifty years, when Lipset and Rokkan (Reference Lipset, Rokkan, Lipset and Rokkan1967) were postulating that party system cleavages had been frozen in Western Europe since the advent of World War I, they did not assert that this state of affairs would continue over the subsequent fifty-plus years. But many contemporary readers interpreted their marginal comment about frozenness at the end of a long comparative historical introduction to party cleavages in an important volume in such fashion. Subsequently, a whole cottage industry of scholarship sprung up that explored the frozenness of party divides and/or their thawing under new conditions, thereby claiming to prove Lipset and Rokkan wrong. But Lipset and Rokkan never implied that history ended in the 1920s. Their own deep historical knowledge spoke against expecting a stasis that would be impossible to upset and they never made predictions about the ensuing development of party systems. Likewise, the analysis presented in our volume, completed in 2023, captures developments over the past twenty to fifty years. There is no pretense that the coming fifty years will be just a continuation of trends seen in the past and arguments examined in this volume.
In fact, there are reasons to believe that the coming fifty years may involve political issues and divides that will pose new challenges to politicians across all programmatic fields, which may alter the policy content of the fields, as well as the electoral constituency groups that gravitate toward these fields, but beyond that may even challenge or redefine the basic coordinates of what constitutes these fields, namely, contentions about the distribution of material economic resources and the discretion of individual human agents over their social and cultural exploration of preferred ways of life.
Part of the normal process of democratic innovation and reconfiguration will be the mapping of new issues on the underlying foundational divisions of political principles. It is already in the offing that questions of global warming and ecological depletion are no longer political problems that can be addressed with benevolent regulations that create mostly winners but few losers. Instead, these issues will pose harsh distributive conflicts, as the imperative to cut back on the generation of greenhouse cases and the extermination of genetic variety in plant and animal life become more intense, visible, and critical for the survival of the human species. It is unclear how parties in the left and right fields will handle these issues, as diverging positions run directly through these partisan fields, internally dividing them.
For this reason, it would be wrong to conclude from this study that given the relative stability of the left field in terms of aggregate vote shares, all is well for the electoral future and political leverage of “the Left,” that is, the set of political organizations broadly subscribing to the social democratic idea. The future for the coherence and leverage of the left field is uncertain. On the one hand, the ongoing polarization along the universalist-particularist cleavage sustains the formation and demarcation of the “left field” in opposition to the particularist right (Bornschier et al. Reference Bornschier, Haffert, Häusermann, Steenbergen and Zollinger2024). On the other hand, however, as illustrated by our itemization in Table 1.1, there are indeed severe and lasting divisions within the left political field, which may even become intensified by the infusion of newly salient policy issues and the configuration of distinct socioeconomic groups around opposing views on how to address those policy challenges. In certain contexts, these divisions may hamper or even paralyze leftist coalitions spanning the entire field, and – if deepening – also lead voters to abandon the field eventually and look for new alternatives. An observation to suggest such a potential for an unravelling process on the Left may have been delivered by France with the rise of Emmanuel Macron’s novel centrist party formation. In France, admittedly, this happened against the backdrop of an ideologically deeply fissured Left, and hastened by strictures of the electoral system that require a higher level of cooperation than in run-of-the-mill parliamentary systems with proportional representation in the legislature. However, the risk of deep divides and even a breaking up of the left field overall appears also in other countries.
Future societal change may upset what we now define as the left field in even more profound ways than our itemization of internal divisions in the introduction suggests, and there are sources of change that may disorganize the “right” field as well. Such more existential challenges of contemporary established coordinates of left and right ideological fields will involve decisions concerning the governance of technologies that redefine the very essence of the human species itself. Artificial intelligence, genetic engineering, and broadly the spread of information technology facilitating an increasing “legibility” and manipulability of humans’ actions, thoughts, and expectations by political rulers and corporate business may well disorganize and reshuffle the entire map of political preference formation and partisan mobilization, if not put in question the continuing feasibility of electoral partisan democracy as a viable form of binding collective decision-making. Political divisions and competitive configurations within early to mid-twenty-first century Western democracies mapped in this book therefore reflect historical episodes that may constitute preludes to much deeper conflicts and seismic shifts in social and political organization we cannot fathom at this time. Investigations concerning political divides and partisan camps written from the vantage point of 2050 may therefore report a greater change from the state of affairs in 2020 than our study registered when comparing the 1990s to the 2010s or 2020s.


 Open access