Many new dating technologies and methods have been used recently to constrain accurately the temporal frame of the stratigraphic sequences, thereby promoting excellent progress in tectonics, geomorphology, palaeoclimatology and palaeo-ecology research. In many cases, however, progress is still hindered by the unsuccessful applications of chronological dating. Although palaeontology may provide a rough age framework, and palaeomagnetism can provide specific details, these approaches do not yield accurate stratigraphic ages; debated ages with large uncertainties of up to tens of millions of years are obtained instead (Liu et al., Reference Liu, Zhao, Wang, Liu and Yi2003; Lu & Xiong, Reference Lu and Xiong2009; Sun et al., Reference Sun, Zhang and Zhang2009; Zheng et al., Reference Zheng, Wei, Tada, Clift, Wang, Jourdan, Wang and He2015a; Wang et al., Reference Wang, Zheng, Zhang, Li, Kirby, Yuan, Zheng, Liu, Wang, Zhang and Pang2017; Jin et al., Reference Jin, Liu, Liang, Roberts, Sun, Hu, Zhao, Su, Jiang, Liu, Duan, Yang and Yuan2018). This is mainly due to the absence of absolute age controls in the stratigraphy. To resolve this issue, volcanic tuffs, which develop isochronous marker layers that provide numerical ages by isotope dating (Shane, Reference Shane2000; Lowe et al., Reference Lowe2011), can be used to interpret palaeontological and palaeomagnetic stratigraphic ages. The accurate age of the Global Stratotype Section and Point (GSSP) in the Permian, based on the radioactive dating of zircons from the tuff layers, provides an example of such an application (Ramezani et al., Reference Ramezani, Schmitz, Davydov, Bowring, Snyder and Northrup2007; Shen et al., Reference Shen, Crowley, Wang, Bowring, Erwin, Sadler, Cao, Rothman, Henderson, Remezani, Zhang, Shen, Wang, Wang, Mu, Li, Tang, Liu, Liu, Zeng, Jiang and Jin2011; Reference Shen, Zhang, Zhang, Yuan, Chen, He, Mu, Lin, Wang, Chen, Wu, Cao, Wang and Wang2019; Schmitz & Davydo, Reference Schmitz and Davydov2012). However, the identification of tuffs in stratigraphic sections is challenging. Recognition based on marked lithological contrasts with the surrounding sediments may be hindered because of a fine grain size, selective weathering, and intense diagenetic modifications (Andreozzi et al., Reference Andreozzi, Dinelli and Tateo1997). In many cases, conclusions are disputable due to the inaccurate recognition of tuff layers. For example, the tuff layer that constrains the age of formation of the Taklamakan Desert (Sun et al., Reference Sun, Alloway, Fang and Windley2015; Zheng et al., Reference Zheng, Wei, Tada, Clift, Wang, Jourdan, Wang and He2015b) and the tuffite layer that determines the age of the Liuqu conglomerate (Leary et al., Reference Leary, Quade and DeCelles2018; Xu et al., Reference Xu, Spicer and Ding2018) are equivocal, which leads to controversial ages based on the tuffaceous layers and further disputes about interpretations of the evolution of the paleoclimate of the Asian interior, the history of palaeo-elevation and the geodynamic evolution of the Himalayas. Developing geochemical methods that can be used to identify, quickly and effectively, various tuffs in the stratigraphy is the key, therefore, to determining accurate stratigraphic ages and addressing the geological issues listed above.
The Lunpola Basin, which is located in the central Tibetan Plateau, is an important site for studying the dynamics and processes of the uplift of the Tibetan Plateau and its environmental impact (Rowley and Currie, Reference Rowley and Currie2006; Wang et al., Reference Wang, Zhao, Liu, Lippert, Graham, Coe, Yi, Zhu, Liu and Li2008; Sun et al., Reference Sun, Xu, Liu, Zhang, Xue and Zhao2014; Jia et al., Reference Jia, Bai, Ma, Sun and Peng2015; Deng et al., Reference Deng, Wang, Wu, Wang, Li, Wang and Hou2019; Su et al., Reference Su, Farnsworth, Spicer, Huang, Wu, Liu, Li, Xing, Huang, Deng, Tang, Xu, Zhao, Srivastava, Valdes, Deng and Zhou2019). The age of the strata sequence based on fossil and pollen evidence has been long disputed and remains unclear, however (Wang et al., Reference Wang, Yang, Li and Li1975; Xia, Reference Xia1982; Deng et al., Reference Deng, Wang, Xie, Li, Hou and Sun2012; He et al., Reference He, Sun, Li and Zhu2012), especially for the Dingqinghu Formation, which represents the upper part of the whole Cenozoic sequence of the basin. The pollen records indicated that the age of the Dingqinghu Formation ranged from Miocene to Pliocene (Wang et al., Reference Wang, Yang, Li and Li1975), whereas fossil charophyte and ostracod suggested an older age of Oligocene (Xia, Reference Xia1982). Recently, fossil mammal, paleomagnetic, and U-Pb zircon dating from altered tuff layers indicate an age from the Late Oligocene to the Early Miocene (Deng et al., Reference Deng, Wang, Xie, Li, Hou and Sun2012; He et al., Reference He, Sun, Li and Zhu2012; Sun et al., Reference Sun, Xu, Liu, Zhang, Xue and Zhao2014). In addition, the age of the Cenozoic strata sequence ending deposition in Lunpola Basin is also controversial. Thus, fossil mammal and paleomagnetic evidence from bentonite beds suggests an Early Miocene age (Deng et al., Reference Deng, Wang, Xie, Li, Hou and Sun2012; Sun et al., Reference Sun, Xu, Liu, Zhang, Xue and Zhao2014), tuff layers indicate Middle Miocene (Mao et al., Reference Mao, Meng, Fang, Zhang, Wu, Yang, Zhang, Zan and Tan2019), and tuffite zircon ages suggest a Late Miocene age (Han et al., Reference Han, Sinclair, Li, Wang, Tao, Qian, Ning, Zhang, Wen, Lin, Zhang, Xu, Dai, Zhou, Liang and Cao2019). Given the debated age constraints, the evolution of the palaeoclimate, palaeo-altitude and palaeo-ecology of the region is still controversial (Rowley and Currie, Reference Rowley and Currie2006; Sun et al., Reference Sun, Xu, Liu, Zhang, Xue and Zhao2014; Jia et al., Reference Jia, Bai, Ma, Sun and Peng2015; Deng et al., Reference Deng, Wang, Wu, Wang, Li, Wang and Hou2019; Su et al., Reference Su, Farnsworth, Spicer, Huang, Wu, Liu, Li, Xing, Huang, Deng, Tang, Xu, Zhao, Srivastava, Valdes, Deng and Zhou2019). The Cenozoic sequence in the Lunpola Basin contains a variety of volcanic tuffs, however (Xia, Reference Xia1983; He et al., Reference He, Sun, Li and Zhu2012; Han et al., Reference Han, Sinclair, Li, Wang, Tao, Qian, Ning, Zhang, Wen, Lin, Zhang, Xu, Dai, Zhou, Liang and Cao2019; Mao et al., Reference Mao, Meng, Fang, Zhang, Wu, Yang, Zhang, Zan and Tan2019), which may be used to propose new methods to distinguish the tuffs from the remaining stratigraphic units and further promote age dating by tephrochronology in the central Tibetan Plateau.
In this study, analcime, an authigenic zeolite, was shown to originate from alteration of pyroclastic rocks in the basin stratigraphic section by applying a series of petrographic and mineralogical methods to possible volcanic tuff layers, which were initially recognized in the field, and to ‘typical sedimentary’ layers. The discrepancies between the major elements and the rare earth elements (REEs) of the altered pyroclastic (analcime-bearing) rocks, analcime-poor samples, and volcanic rocks of the late Oligocene to Miocene on the Tibetan Plateau were analysed. The geochemical discrimination plot may be used to distinguish effectively between analcime-related pyroclastic rocks and the remaining basin sedimentary sequences.
Geological setting
The Lunpola Basin, located north of the Lhasa Terrane and south of the Bangong-Nujiang suture in the central Tibetan Plateau (Fig. 1a,b), is a Cenozoic rift basin covering an area of 15–20 km × 200 km area, with an average altitude of >4500 m. With the continuous collision of the Indian and Asian continents during the Cenozoic, the pull-apart basin formed under the dextral slip of the Bangong-Nujiang Suture zone which deformed into the north thrust fold belt, the central depressed zone and the south thrust belt and is bounded by the Dayushan thrust fault and the Changshan thrust fault (Lei et al., Reference Lei, Fu and Lu1996; Ai et al., Reference Ai, Lan, Zhu, Zhang and Zeng1998; Mao et al., Reference Mao, Meng, Fang, Zhang, Wu, Yang, Zhang, Zan and Tan2019) (Fig. 1c).
(a) Geomorphological map of the Tibetan Plateau (Google Earth) showing the location of the Lunpola Basin. (b) Schematic tectonic map of the Tibetan Plateau and the main volcanic events in the late Oligocene to Miocene (according to Miller et al., Reference Miller, Schuster, Klötzli, Frank and Purtscheller1999; Williams et al., Reference Williams, Turner, Pearce, Kelley and Harris2004; Zhao et al., Reference Zhao, Mo, Dilek, Niu, DePaolo, Robinson, Zhu, Sun, Dong, Zhou, Luo and Hou2009; Guo & Wilson, Reference Guo and Wilson2019). (c) Geological map of the Lunpola Basin illustrating the distribution of the Cenozoic stratigraphy and the locations of the studied sections (Mao et al., Reference Mao, Meng, Fang, Zhang, Wu, Yang, Zhang, Zan and Tan2019).

The collision and subduction caused by N–S regional trending extensional faults and grabens and E–W trending extensional faults, triggered intense volcanic activity on the Tibetan Plateau (Miller et al., Reference Miller, Schuster, Klötzli, Frank and Purtscheller1999; Williams et al., Reference Williams, Turner, Pearce, Kelley and Harris2004; Chung et al., Reference Chung, Chu, Zhang, Xie, Lo, Lee, Lan, Li, Zhang and Wang2005; Guo et al., Reference Guo, Wilson, Liu and Mao2006; Guo & Wilson, Reference Guo and Wilson2019). The volcanic activities may be divided into three major periods: syncollisional volcanism (~65–40 Ma), magmatic quiescence (~40–25 Ma) and post-collisional magmatism (~25–10 Ma) (Mo et al., Reference Mo, Hou, Niu, Dong, Qu, Zhao and Yang2007). The emplacement of the post-collision magmatites took place mainly on the southern Tibetan Plateau (Fig. 1b). The magmatic rocks can be divided into adakitic intrusive rocks, potassic–ultrapotassic volcanic rocks, and peraluminous granites (Chung et al., Reference Chung, Liu, Ji, Chu, Lee, Wen, Lo, Lee, Qian and Zhang2003; Hou et al., Reference Hou, Gao, Qu, Rui and Mo2004; Williams et al., Reference Williams, Turner, Pearce, Kelley and Harris2004; Liao et al., Reference Liao, Mo, Pan, Zhu, Wang, Jiang and Zhao2007; Mo et al., Reference Mo, Hou, Niu, Dong, Qu, Zhao and Yang2007; Huang et al., Reference Huang, Xu, Chen, Wu, Zeng, Xiong, Chen and Yu2016; Zhang et al., Reference Zhang, Li, Cao, Zhang, Huang, Dong, Lu and Liu2019). In particular, potassic–ultrapotassic volcanic rocks, which are mainly derived from the breakoff of the Indian continental lithosphere (Hou et al., Reference Hou, Gao, Qu, Rui and Mo2004; Ding et al., Reference Ding, Yue, Cai, Xu, Zhang and Lai2006; Huang et al., Reference Huang, Chen, Xu, Wang and Li2015), are characterized by high K2O/Na2O ratios and occur as dykes, lava flows and pyroclastic deposits (Miller et al., Reference Miller, Schuster, Klötzli, Frank and Purtscheller1999). Such potassic–ultrapotassic volcanic rocks are dominated by trachyandesite and trachyte, with phlogopite, clinopyroxene and a few orthopyroxene phenocrysts and a groundmass consisting of sanidine, phlogopite, clinopyroxene, ilmenite, Ti-magnetite, and glass (Miller et al., Reference Miller, Schuster, Klötzli, Frank and Purtscheller1999; Zhao et al., Reference Zhao, Mo, Dilek, Niu, DePaolo, Robinson, Zhu, Sun, Dong, Zhou, Luo and Hou2009; Guo & Wilson, Reference Guo and Wilson2019). The pyroclastic materials produced by those volcanic events were deposited in contemporary sequences in adjacent basins.
The Cenozoic stratigraphic sequence of the Lunpola Basin is >4000 m thick and includes the Niubao Formation and the Dingqinghu Formation (Xia et al., Reference Xia1983; Luo et al., Reference Luo, Dai and Pan1996). The Niubao Formation is a series of fluvial-lacustrine sediments, mainly exposed in the south Dayushan thrust fault and to the west of the basin, which consist of red fine sandstone and siltstone and green mudstone, interlayered with conglomerates and marl (Xia et al., Reference Xia1983; Luo et al., Reference Luo, Dai and Pan1996) (Fig. 1c). The pollen, fossil charophytes, and ostracods in the Niubao Formation indicate an Eocene–Oligocene age (Xia, Reference Xia1982, Reference Xia1986). The Dingqinghu Formation overlies the Niubao Formation with a conformity or parallel unconformity. It is composed of greyish siltstone and mudstone, deep-grey shale, a few greenish siltstones, marl and tuff layers, indicating a lake facies deposit (Xia, Reference Xia1983). The central basin is located in Jiangriacuo and Jiangjiacuo areas corresponding to the middle Niubao Formation. As with the uplift in the west and depression in the east of the basin during the Dingqinghu Formation deposition, the depocenter gradually migrated southeastward (Ai et al., Reference Ai, Lan, Zhu, Zhang and Zeng1998). Thus, the Dingqinghu Formation is dominated by reddish or brown-reddish mudstone, siltstone, and sandstone interlayers in the west, suggesting shallow to semi-deep lake facies deposition in the Chebuli (CBL) section. The central basin is dominated by semi-deep to deep lake facies, with thick grey to deep-grey mudstone and shales in the Lunpola-II (LPL-II), Lunpori (LPR), Papashan (PPS), and Papadong (PPD) sections (Fig. 1b). The detailed lithostratigraphic columns of five sections and representative field and hand specimen photos of analcime-bearing sediment samples are shown in Fig. 2.
Lithostratigraphic columns for the five studied sections (a–e) in the Lunpola Basin and representative photos of field and hand specimens (f–j). The white arrows in the photos indicate the analcime-bearing tuff layers. The red and cyan spots in the sections indicate the locations of analcime-bearing samples and analcime-poor sedimentary samples, respectively.

Materials and methods
Materials
In total, 36 samples were collected from the five sections in the Lunpola Basin (Fig. 2). The samples are characterized as silts and fine sands with a grey to grey-white colour. The thickness of the layers ranges from 2 cm to 10 cm, and no obvious layering within the homogeneous bulk sediments was observed. The main minerals in the analcime-bearing samples include analcime, biotite, and feldspar. The analcime-poor sedimentary sediments are dominated by alkaline feldspar, quartz, and calcite. The analcime-bearing samples with relatively low densities were assumed to be tuffaceous layers. Mineralogical and geochemical analyses were carried out to determine the formation process of the analcime. In addition, 137 samples from various potassic–ultrapotassic volcanic rocks from the late Oligocene to the Miocene in the Tibetan Plateau were collected for comparison with the analcime-poor and analcime-bearing samples.
Mineralogical analysis
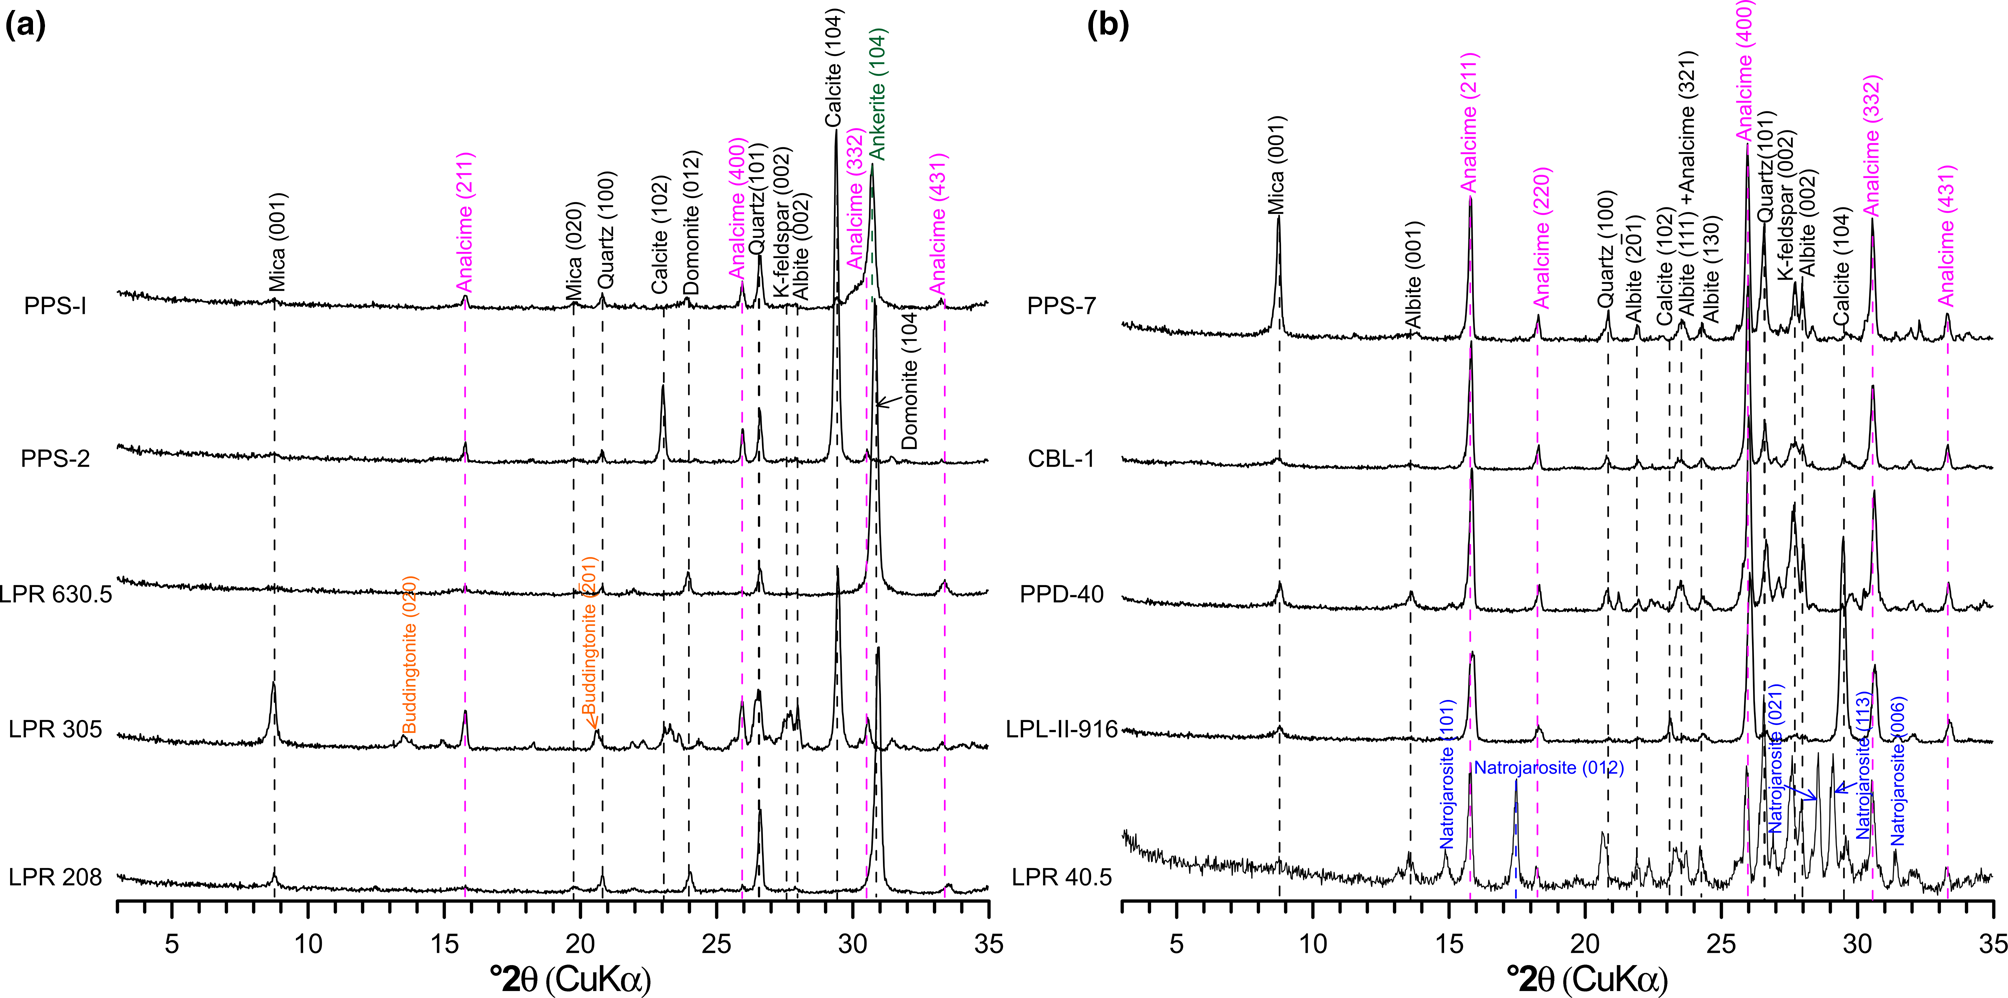
Thin-section microscopy and X-ray diffraction (XRD) analyses were used to identify the mineralogical composition of the samples. The thin sections were prepared based on the standard approach and analysed with a Zeiss Stemi 5180 polarizing microscope. Thirty six bulk samples, previously sieved through a <200 mesh sieve, were selected for random powder XRD to determine the mineralogical composition. A Rigaku D/MAX-2000 diffractometer (Cu-Kα radiation, 40 kV, 40 mA, 3–70°2θ range) was used. The minerals were identified based on their diagnostic peaks. In brief, the strong peaks at ~3.43 Å (400), ~5.61 Å (211) and ~2.93 Å (332) indicate collectively the existence of analcime in the bulk samples (Fig. 3a). The peaks at ~3.34 Å (101) and ~4.25 (100) suggest the presence of quartz (Fig. 3a). Regarding carbonates, the peaks at ~3.04 Å (104) and ~2.89 Å (104) indicate the occurrence of calcite and dolomite, respectively (Fig. 3a). Furthermore, small amounts of albite, K-feldspar, ankerite, natrojarosite, and buddingtonite were identified (Fig. 3). Semi-quantitative analyses of the minerals (weight %) was calculated using the K-value method of Chung (Reference Chung1974), using corundum as the reference material. The ratios of the characteristic reflections of the above non-clay minerals to the (012) reflection of corundum at 3.48 Å were 2.50 (analcime), 4.32 (quartz), 1.80 (albite), 2.05 (K-feldspar), 3.58 (calcite), 2.64 (dolomite), 2.63 (ankerite), 2.2 (natrojarosite) and 2.5 (buddingtonite), respectively.
XRD traces of bulk samples from the Lunpola Basin.

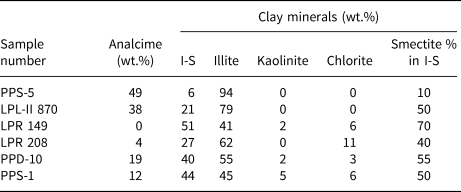
Then, six representative samples with varying analcime contents (Table 1) were selected to isolate the clay fraction (<2 μm) by sedimentation following Stokes’ Law. In brief, ~30 g of the bulk samples were treated with excess 25% H2O2 and 1 mol/L acetic acid to remove organic matter and carbonates, respectively, followed by washing with deionized water to remove excess H2O2 and acetic acid. After 8 h at room temperature (~20°C), the top 10 cm of the suspension was separated to collect the clay fraction. Oriented clay fractions were prepared by the pipette method and examined using the Rigaku D/MAX-2000 diffractometer (Cu-Kα, 1.5406 Å, 40 kV, 100 mA, 3–30°2θ, scanning step 0.02°2θ, scanning speed 10°/min) to obtain air-dried (AD) XRD traces. Subsequently, the AD oriented mounts were solvated with ethylene glycol vapour (EG solvated samples) for 24 h and then heated for 2 h at 450°C to obtain heated (T) XRD traces. All XRD measurements were conducted at the Micro Structure Analytical Laboratory, Peking University.
The composition of the clay minerals in typical samples from the Lunpola Basin.

Clay mineral identification and semi-quantitative estimates were performed using the Jade 6.5 software according to Moore & Reynolds (Reference Moore and Reynolds1989). As typical expandable clay minerals, smectite and randomly interlayered (R0) illite-smectite feature diagnostic peaks that migrate from 12–15 Å in the AD trace to ~17 Å in the EG-solvated samples. The position of higher-order basal peaks may help in distinguishing smectite from illite-smectite mixed layers. The presence of a 7 Å peak may indicate the existence of chlorite and kaolinite. The odd orders of chlorite at ~14.2 Å and 4.73 Å further separate chlorite from kaolinite. Furthermore, the presence of the chlorite peak at 14.2 Å in T XRD traces is used to distinguish chlorite from vermiculite; the peak of the latter shifts to ~10 Å after heating (Moore & Reynolds, Reference Moore and Reynolds1989). The occurrence of peaks at 10, 5, and 3.33 Å indicates the presence of illite (Moore & Reynolds, Reference Moore and Reynolds1989). Semi-quantitative analysis of clay minerals was performed following SYT 5163-2010 (Zeng et al., Reference Zeng, Wang, Xu, Jiao, Cui, Han and Zhang2010), which is an improved method based on that of Schultz (Reference Schultz1964). The peak areas at 10 Å (illite), 17 Å (smectite), and 7 Å (chlorite and kaolinite) are used in semi-quantitative clay-mineral calculations. Moreover, the relative contents of kaolinite and chlorite can be further separated by the peak-height ratios between the chlorite 3.54 Å peak (004) and the kaolinite 3.58 Å peak (002) (Schultz, Reference Schultz1964).
The proportion of smectitic layers in illite-smectite mixed layers is generally calculated by using an improved method from Reynolds (Reference Reynolds, Brindley and Brown1980). Peak migration curves were employed to compute the proportion of smectitic layers in illite-smectite mixed layers. In addition, the intensity ratio between the saddle and the peak at 17 Å in the EG-solvated trace was used as an alternative method (Weir et al., Reference Weir, Ormerod and El Mansey1975).
The second group of six representative analcime-bearing rock samples across all five sections was coated with a carbon layer for electron probe micro analysis (EPMA) to identify the mineralogical composition. A JEOL JXA-8230 Electron Probe Micro Analyser equipped with four wavelength-dispersive spectrometers (WDS) at the Key Laboratory of Continental Collision and Plateau uplift, Institute of Tibetan Plateau Research, Chinese Academy of Sciences (ITP-CAS), was used. An acceleration voltage of 15 kV, a beam current of 20 nA and a spot size of 5 μm were used when analysing the minerals. A modified ZAF (atomic number, absorption, fluorescence) correction procedure was used to correct the data online. The peak counting time was 10 s, and the background counting time was half of the peak counting time on the high- and low-energy background positions. In addition, an Energy Dispersive Spectrometer (EDS) with a scanning electron microscope (SEM) (JEOL-JSM-5610 LV) at an acceleration voltage of 20 kV, a focus distance of 18 mm, and a beam spot of 38 μm in diameter at the Chinese Academy of Geosciences, Beijing, was used to reanalyse the analcime.
Grain-size analysis
A total of 30 samples from the five sections were selected for grain-size analysis. About 0.1 g of the bulk sample was placed in a 120 mL beaker with 15–20 mL of 30% H2O2 solution. After heating on a heating plate at 120°C to accelerate the removal of the organic matter in the samples, 15 mL of 12% hydrochloric acid solution was added to dissolve any carbonates. Subsequently, nearly 100 mL of distilled water was added to dilute the solution. Finally, the samples were allowed to stand for 12 h, and the supernatant suspension was siphoned for analysis. Before measurement, the samples were dispersed with 10 mL of 0.05 M (NaPO3)6 in an ultrasonic bath for 10 min. All the samples were analysed using a Microtrac S3500 laser particle sizer (USA) at the ITP-CAS. The precision of the grain-size measurements is better than 0.5%.
Elemental analyses
The bulk samples were sieved through a <200 mesh sieve. Then, 0.5 g of dry samples and 10 mL of 10% acetic acid were placed in 15 mL polyethylene centrifuge tubes to remove soluble salts and carbonates, then washed and dried. Subsequently, 20–30 mg of dry, solid residual samples were digested using a mixture of nitric acid and hydrofluoric acid in a Teflon tank following the steps described by Yang et al. (Reference Yang, Fang, Galy, Jin, Wu, Yang, Zhang, Zan, Liu and Gao2016). Finally, the digested solution samples were diluted by ultrapure water ~2000-fold. The major and trace elements were analysed by inductively coupled plasma-optical emission spectroscopy (ICP-OES, Leeman Labs Prodigy-H) and inductively coupled plasma-mass spectrometry (ICP-MS, X-7; Thermo-Elemental, USA), respectively, at the ITP-CAS. Replicate analyses of samples showed that the relative standard deviations (RSDs) for all elements were <5% and mostly <2%.
Results
Mineralogy of the tuffs and sediments
Twenty five analcime-bearing samples and 11 analcime-poor samples were identified in the sample set, following the mineralogical analyses. The analcime-bearing samples are mainly composed of analcime, albite, K-feldspar, biotite, and small amounts of quartz and phlogopite (Figs 3 and 4; supplementary information Table S1). The analcime content ranges from 17 to 82%, with an average of 47%. The analcime is subhedral or euhedral (Fig. 4a,b,c), and the K-feldspar and quartz crystal fragments are fresh, angular, with similar sizes, and scattered randomly in the sample. In addition, there are a few felsic microcrystal fragments enclosed in the analcime crystal (Fig. 4a,b,d). Some analcime-bearing samples are cemented by calcite (Fig. 4b), and others are cemented by an opaque matrix (Fig. 4d). In contrast, the analcime-poor sedimentary samples contain abundant quartz and small amounts of illite, K-feldspar, and biotite (Figs 3 and 4; Table S1). Some samples from the LPR section contain abundant dolomite (Fig. 4e). The felsic clasts in the analcime-poor sedimentary rocks are subangular to subrounded and cemented by calcite or dolomite (Fig. 4e,f).
Optical microscopy images of representative analcime-bearing and analcime-poor sedimentary samples. (a) Typical analcime-bearing samples in the LPL-II section; K-feldspar, biotite and analcime are cemented by calcite (plane polarized light-PPL). (b) Same photo as (a) in cross-polarized light (XPL). Fine-grained K-feldspar crystal fragments in the analcime crystals, cemented by calcite. (c) Euhedral and subhedral analcime crystals and felsic clasts with grain sizes similar to those of the analcime (PPL). (d) Pyroclastic rock containing analcime cemented by an opaque matrix, with residual tuffaceous texture (XPL). (e) Analcime-poor sample consisting of K-feldspar, illite, quartz and minor biotite cemented by dolomite (XPL). (f) Analcime-poor rock, with subangular to subrounded quartz, K-feldspar and biotite cemented by calcite (PPL).

The six representative clay fractions isolated from the analcime-bearing bulk samples are dominated by mixed-layer illite-smectite (I-S) and illite. The amount of smectite layers in I-S identified in the PPS-5 and LPL-Ⅱ 870 samples is 10% and 50%, respectively. In the analcime-poor sedimentary samples, the main clay minerals are illite and I-S, with small amounts of chlorite and kaolinite. The proportion of smectite in the I-S is 40–70%, with an average of 54%. In general, the abundance of I-S minerals in the analcime-bearing samples is smaller than that in the analcime-poor sedimentary samples, but the illite content is greater in the analcime-bearing samples (Fig. 5, Table 1).
Semi-quantitative estimates of the clay minerals in a typical analcime-poor sedimentary sample (a) and a typical analcime-bearing sample (b).

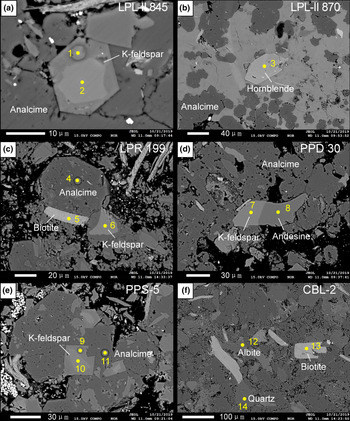
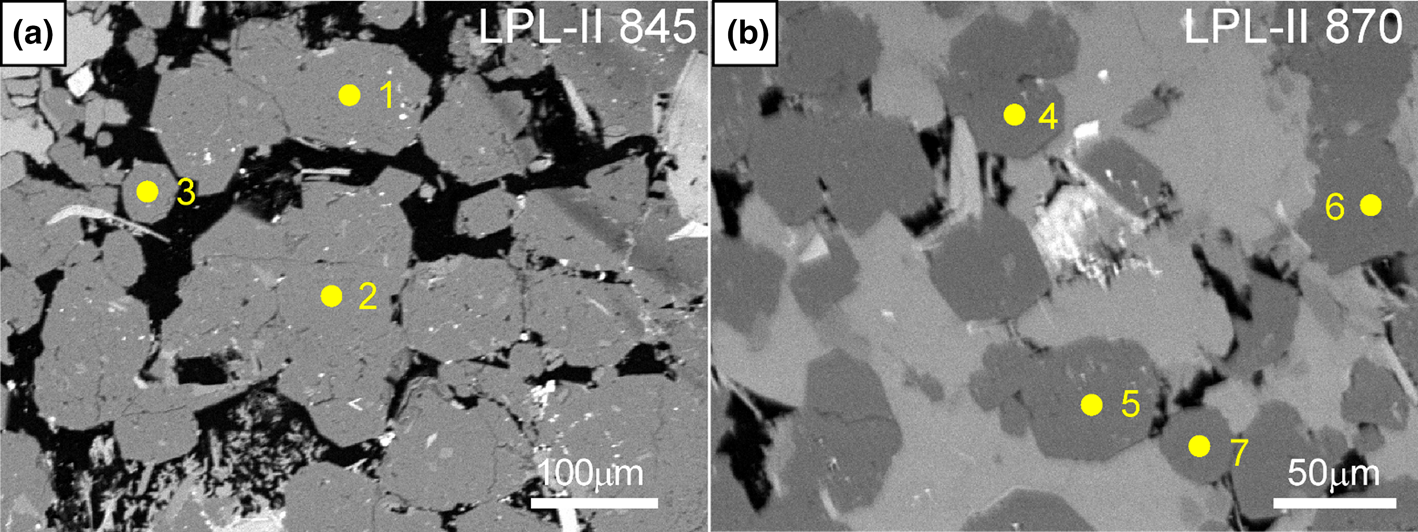
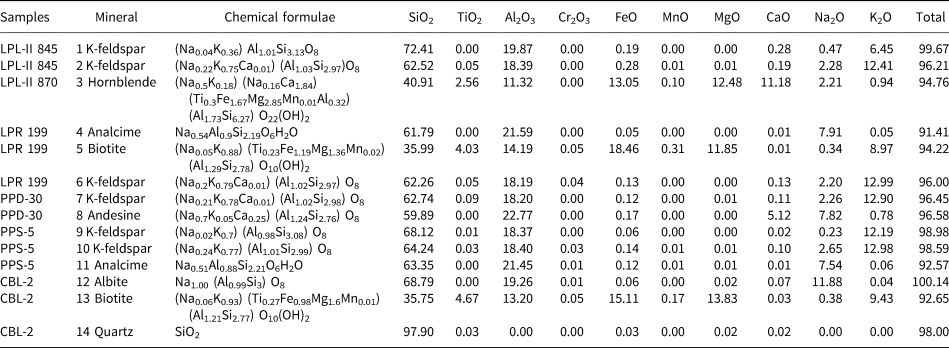
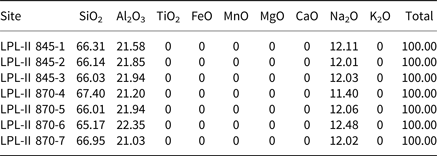
Electron back scatter diffraction (EBSD) images of the six typical analcime-bearing samples are shown in Fig. 6. The major minerals are analcime, alkaline feldspars, and biotite. The K-feldspar fragments are angular, and some biotite is kinked (Fig. 6e,f). Anhedral and euhedral K-feldspar crystals and other felsic minerals were enclosed in analcime (Fig. 6a,c,d,e). The euhedral and subhedral crystals of hornblende and biotite suggest a pyroclastic origin (Fig. 6b,f). The major elemental compositions of the pyroclastic minerals obtained by EPMA (Fig. 6) are listed in Table 2. The Na2O content of analcime is smaller than the theoretical chemical formula (NaAlSi2O6⋅H2O) (Table 2). Nevertheless, the EDS analysis showed that the Na2O content of analcime is similar to the theoretical chemical composition (Fig. 7, Table 3), which reveals that the narrow spot size (5 μm) in the WDS resulted in partial loss of Na during the EMPA. The low total composition (<100%) in nominally anhydrous minerals may be caused by the precision of the measurements under the very narrow spot size (1–2 μm) or the volatile enclosed in the crystals during quick condensation.
Electron back scatter diffraction (EBSD) images of typical analcime-bearing samples. (a) Euhedral K-feldspar enclosed by analcime; (b) euhedral analcime and hornblende cemented by calcite; (c) biotite and anhedral K-feldspar enfolded by euhedral analcime; (d) K-feldspar and andesine cemented by analcime; (e) euhedral K-feldspar, and other angular felsic minerals enclosed in analcime crystals; (f) subhedral biotite and felsic minerals cemented by analcime. The yellow spots indicate the locations of EPMA, the results of which are given in Table 2.

EBSD images showing the EDS analysis sites in typical analcime-bearing samples. The yellow spots indicate the sites analysed.

Elemental compositions of the minerals, based on EPMA, in the typical analcime-bearing samples from the Lunpola Basin.

Composition of the typical analcime-bearing samples, based on EDSa.

a The oxide content (%) was calculated by element and normalized.
Grain size
The grain-size frequency curves can be divided into two patterns according to the peak shape. The analcime-bearing samples mainly have a unimodal mode, with grain-size peaks ranging from 30 to 80 μm, which can be further divided into two groups. The first group exhibits a narrow peak (Fig. 8a), and the second type shows a wide peak that may contain two similar grain-size components (Fig. 8b). The cumulative frequency curves yield comparable patterns, indicating that the analcime-bearing samples are characterized by a relatively uniform grain-size distribution (Fig. 8c). This suggests that the mineral particles were transported by a single dynamic mechanism. The grain-size frequency curve of the analcime-poor sedimentary samples is dominated by a bimodal distribution; the fine-grained component (4–8 μm) may correspond to clays, and the coarse component at 100–300 μm (Figs 8d,e) is indicative of felsic minerals clasts. The cumulative frequency curves with variable distributions also suggest that the analcime-poor sedimentary samples may reflect two different sedimentary processes, thus being different from the analcime-bearing samples (Fig. 8f). The grain-size data of these samples are presented in Table S2. The minerals in the thin-section analysis confirm the characteristics of the grain size.
Grain-size frequency distribution curves for the analcime-bearing samples (a, b, c) and the analcime-poor sedimentary samples (d, e, f). The analcime-bearing samples show a unimodal mode (a, b), and the frequency cumulative curves reveal a single dynamic mechanism (c). The analcime-poor sedimentary samples show bimodal grain size patterns (d, e), and the frequency cumulative curves reveal two types of dynamic mechanisms (f). The grain-size frequency curves have the same colour as the frequency cumulative curves.

Chemical composition of the tuffs and sediments
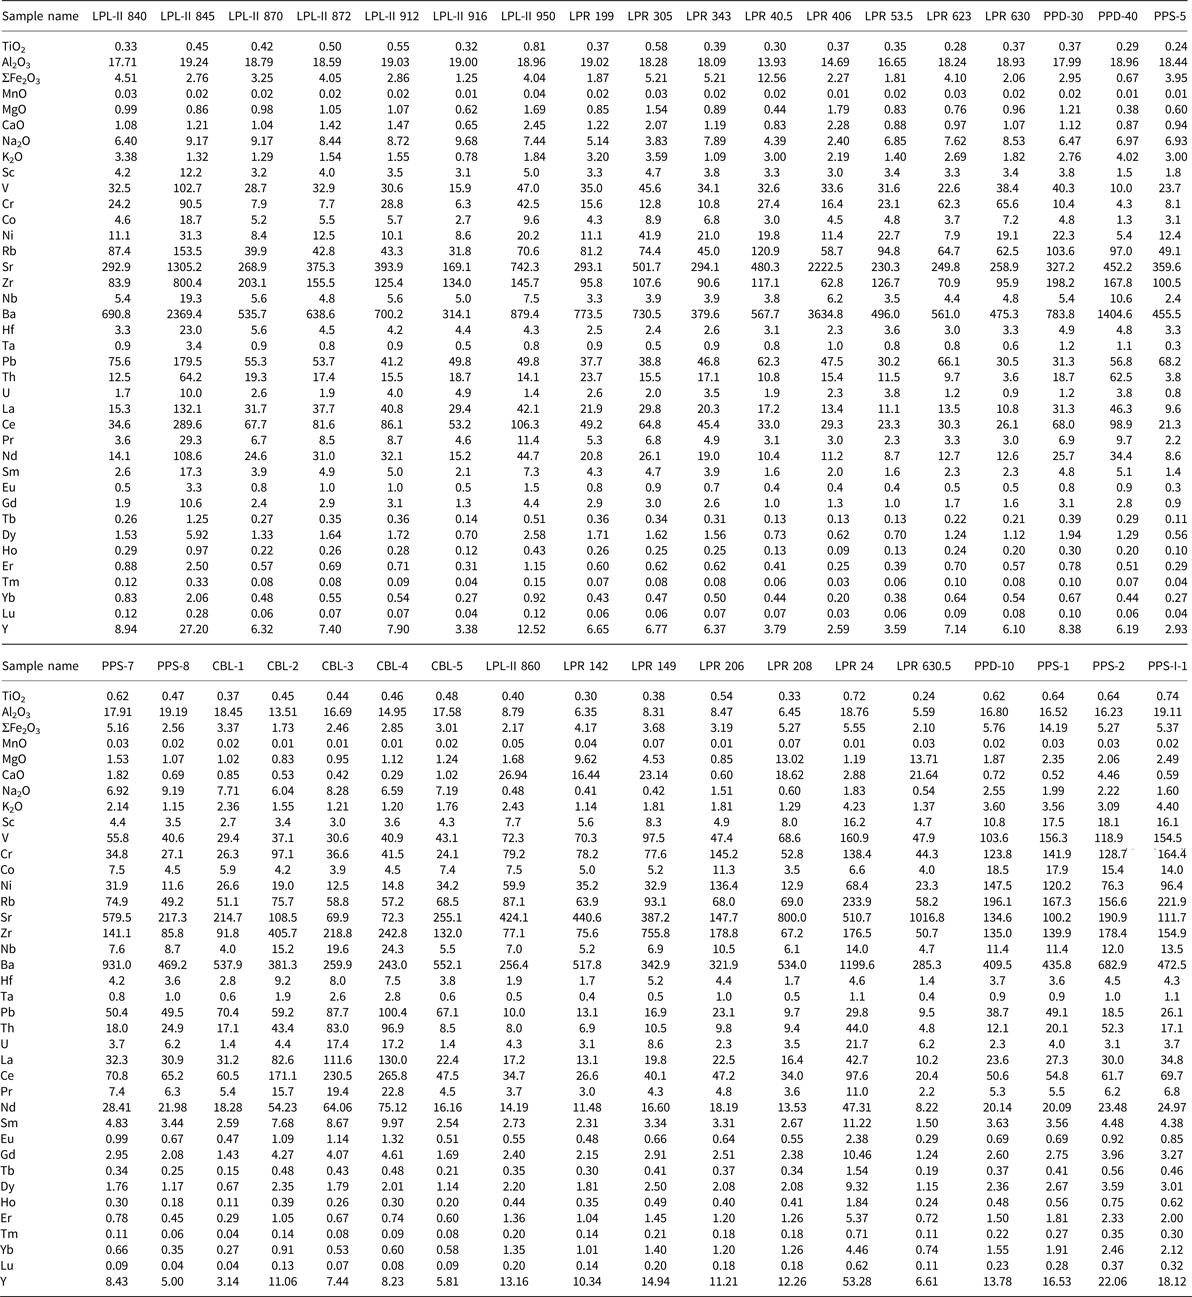
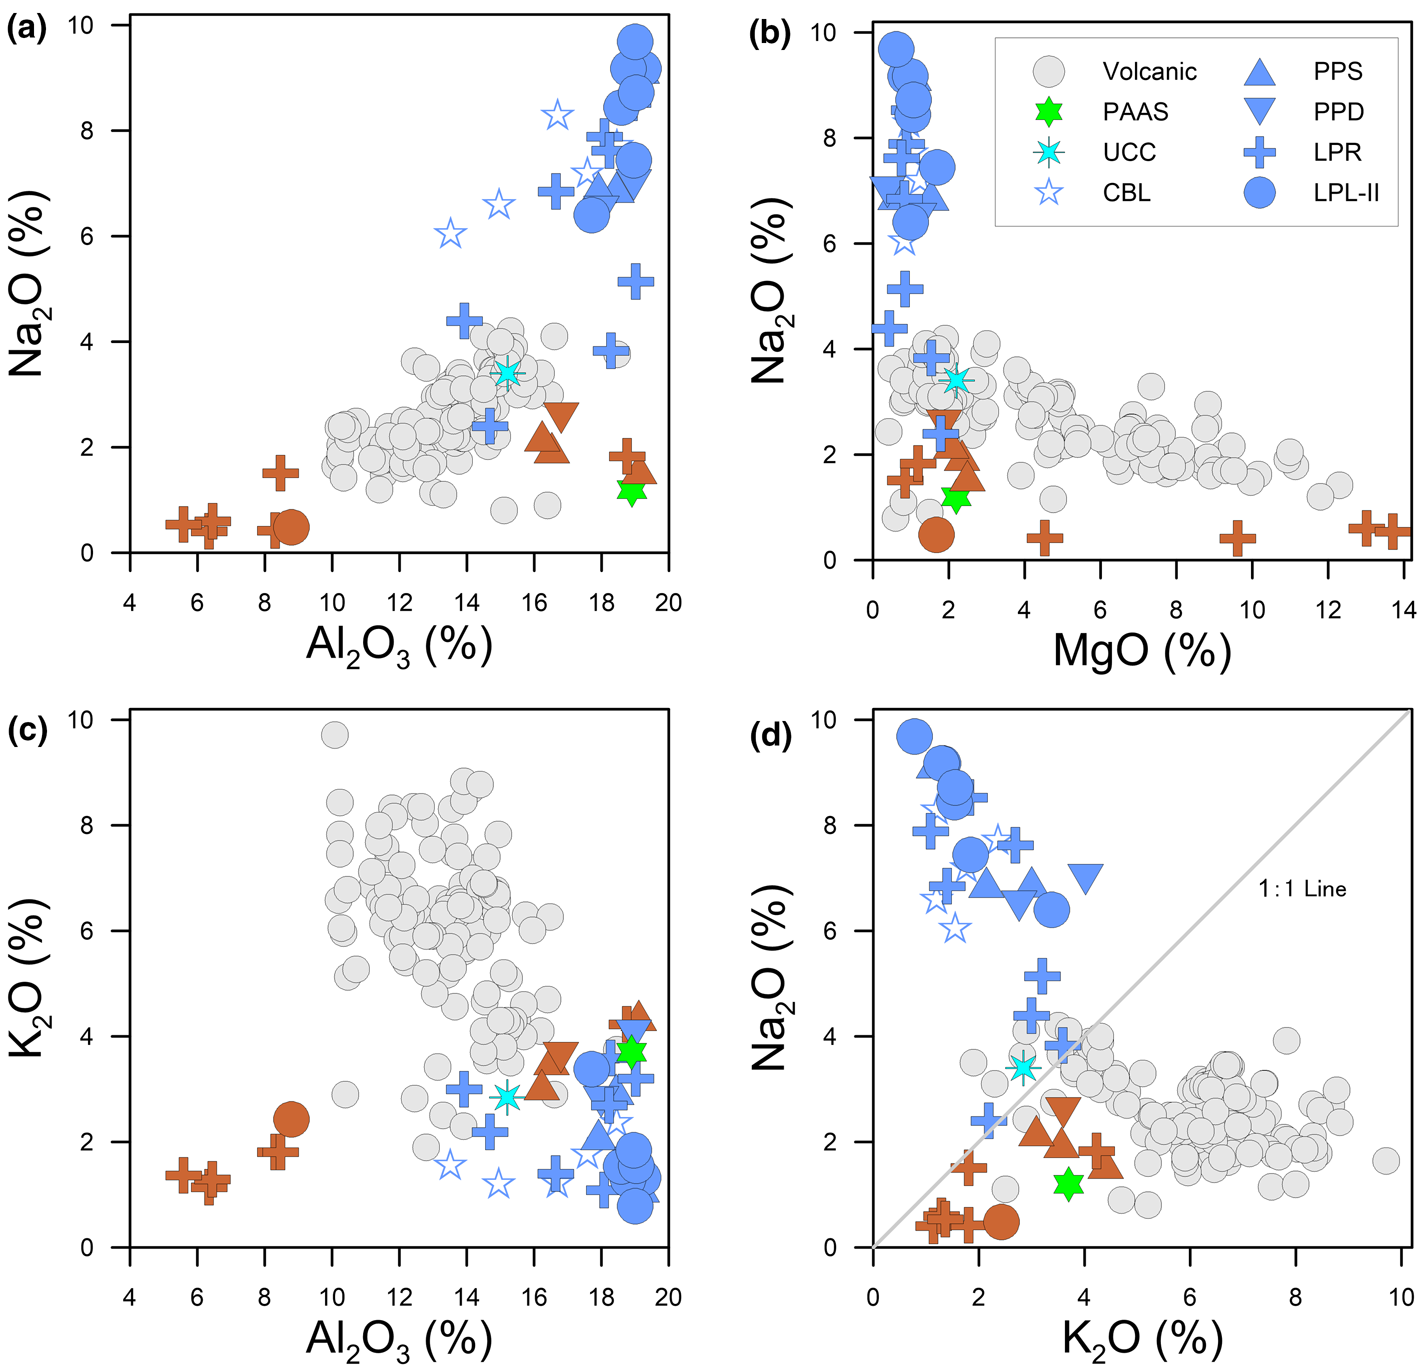
The Al2O3, K2O, CaO, and Fe2O3 (total) exhibit similar abundance ranges in the analcime-bearing and analcime-poor sedimentary samples (Table 4). Na2O is enriched in the analcime-bearing samples and depleted in the analcime-poor sedimentary samples. MgO is enriched in some of the dolomite in the analcime-poor sedimentary samples but is generally low in the analcime-bearing samples. Thus, the Na2O-MgO and Na2O-Al2O3 plots may be used to distinguish the analcime-bearing and analcime-poor sedimentary samples (Fig. 9a,b). The K2O content of the volcanic rocks from the central Tibetan Plateau (grey circles in Fig. 9) is greater than that of the sedimentary samples (Fig. 9c), but the ratio of K2O/Na2O is <1 in the analcime-bearing samples (Fig. 9d).
Major (%) and trace (ppm) element compositions of the samples from the Lunpola Basin.

The correlation of major-element oxides of samples with/without analcime in the Lunpola Basin. The locations of the compared volcanic rocks in the late Oligocene to Miocene in the Tibetan Plateau are shown in Fig. 1. The blue symbols correspond to the analcime-bearing samples, the brown symbols to the analcime-poor sedimentary samples and the grey symbols mark the volcanic rock samples. The different shapes represent samples from different sections of the Lunpola Basin.

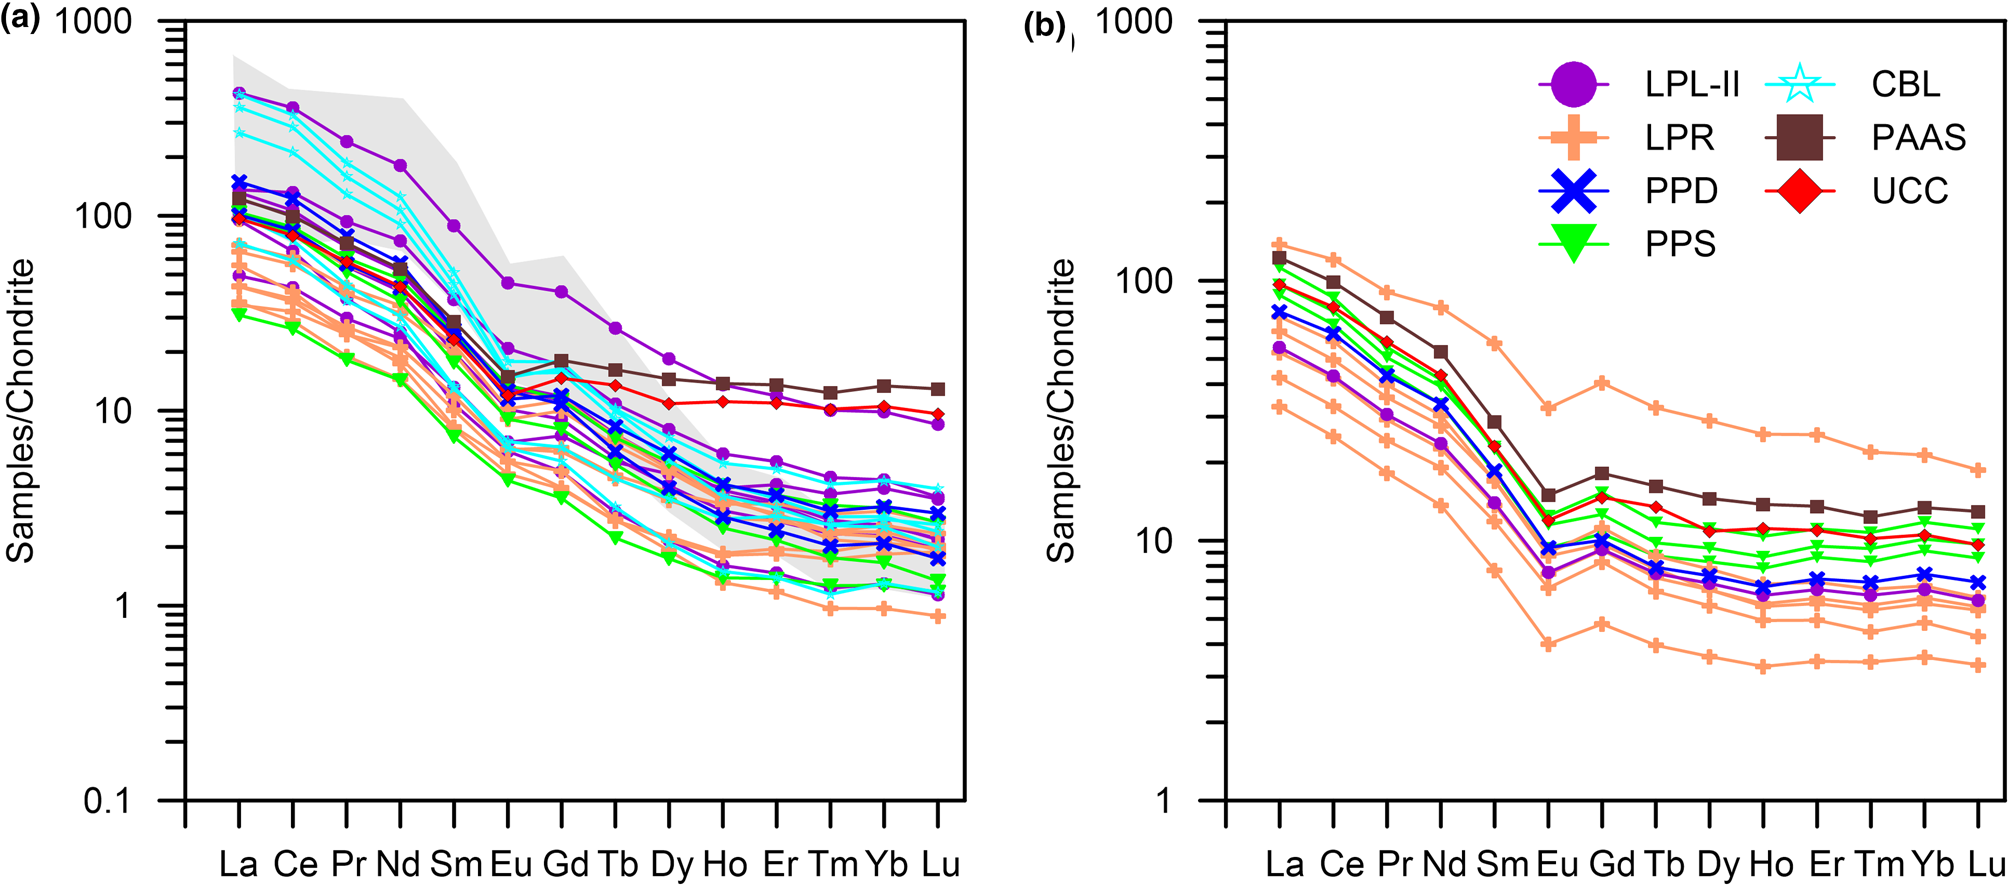
The chondrite-normalized rare earth element (REE) distributions for all samples exhibit light REE (LREE)-enriched and heavy REE (HREE)-depleted patterns (Fig. 10a,b). However, compared to the upper continental crust (UCC) and the post-Archean Australian shales (PAAS), the analcime-bearing samples display a more enriched LREE and a more depleted HREE, with a less negative Eu anomaly. Such REE patterns are similar to the Miocene intermediate volcanic rock pattern in the central Tibetan Plateau (Fig. 10a; Zhao et al., Reference Zhao, Mo, Dilek, Niu, DePaolo, Robinson, Zhu, Sun, Dong, Zhou, Luo and Hou2009). The analcime-poor sedimentary samples exhibit uniform REE patterns parallel to the UCC and PAAS (Fig. 10b). The UCC normalized trace elements show depletion of the first-row transition elements (V, Co, Ni, Sc, Cr) and HREEs, the large ionic lithophile elements (LILE) are slightly depleted (Rb, U, K) and Na is significantly enriched. The high field strength elements (HFSE) are immobile (Fig. 11). The average compositions of the analcime-bearing samples have a distribution pattern similar to that of volcanic rocks. However, their contents are lower, which may account for the primary compositions of the source and the mixing of the sedimentary materials.
Chondrite-normalized REE distribution patterns of the analcime-bearing samples (a) and the analcime-poor sedimentary samples (b) in the Lunpola Basin. The different colours reveal samples from different sections, and the shadow in (a) shows the ultrapotassic volcanic rocks in the central Tibetan Plateau.

UCC-normalized trace-element distribution patterns of the analcime-bearing samples, analcime-poor sedimentary samples and volcanic rocks in the Tibetan Plateau (a) and their average value distributions (b). Unaltered pyroclastic samples are from Miller et al. (Reference Miller, Schuster, Klötzli, Frank and Purtscheller1999).

Discussion
Identification of pyroclastic rocks and their source rocks
Analcime may form in different environments under different processes. Luhr and Kyser (Reference Luhr and Kyser1989) classified the analcime into five genetic types, including primary igneous crystallization (P-type), conversion of leucite or other precursor minerals (L-type), hydrothermal metamorphism (H-type), transformation of volcanic glass or zeolite precursors in saline and alkaline lakes (S-type), or metamorphic sequence under pressure and temperature (M-type). The P-type and L-type rocks are related to the magmatic rocks, which do not exist in our studied stratigrapic sections. Field and petrographic observations further exclude the occurrence of hydrothermal (H-type) and metamorphic (M-type) analcimes due to the absence of different metamorphic generation minerals and vein systems (Kralj, Reference Kralj2016) (Figs 4, 6). It is suggested, therefore, that the analcime in the Lunpola Basin may be related to the S type.
The results of the petrographic and mineralogical analyses demonstrate that the analcime-bearing precursor rocks might be of pyroclastic origin for the following reasons: (1) The euhedral hornblende and biotite in the analcime-bearing samples (Fig. 6b,f) indicate that they crystallized in the magma before the volcanic eruption. (2) The anhedral K-feldspar crystals enclosed in larger euhedral K-feldspar crystals in the analcime-bearing samples (Fig. 6a, 6e) reveal two phases of crystallization; the euhedral crystals formed before the volcanic eruption. (3) The angular felsic minerals and some kinked biotite crystals in the analcime-bearing samples (Figs 4a, 6f) indicate that they were fragmented during the explosion. These minerals are also different in shape from the subangular to subrounded clastic rocks in the analcime-poor sedimentary samples (Fig. 4f), suggesting that they were not transported far away after deposition.
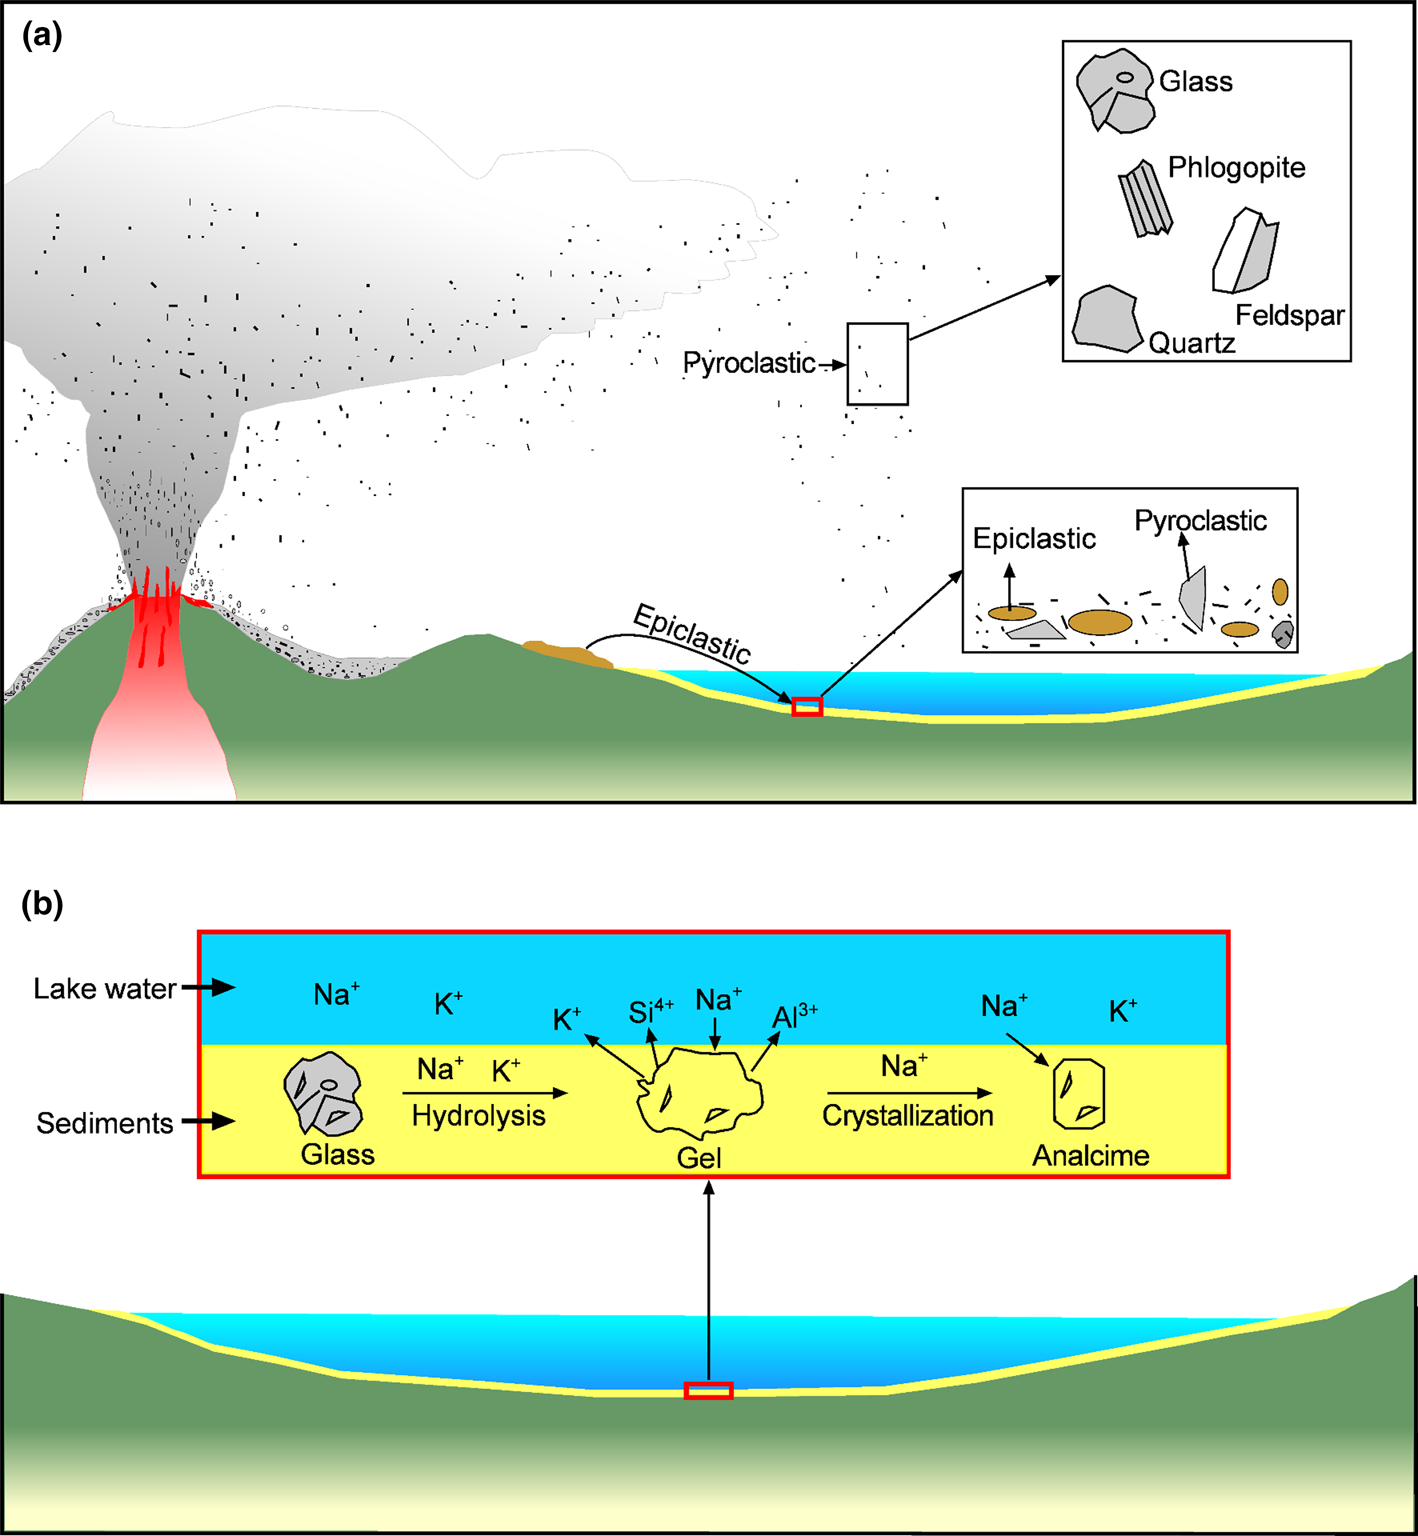
The petrographic and mineralogical observations also reveal the whole transformation process of volcanic material after deposition (Fig. 12): (1) The erupted products include felsic fragments, euhedral hornblende, biotite and volcanic glass. These materials were transported far away from the crater by a single force and settled into the lake (Fig. 12a), as shown by the uniform grain-size distribution for different minerals (Fig. 8a–8c). (2) The quenched volcanic glasses were hydrolysed preferentially in saline and weakly alkaline environments with high water/rock ratios because of thermodynamic instability (Hay, Reference Hay1966; Taylor & Surdam, Reference Taylor and Surdam1981). The large alkaline cations content, i.e. Na and K dissolved from the pyroclastic rocks and/or remaining in the lake water, promoted conversion of volcanic glass to gels. Meanwhile, Na reacted with the gels to form analcime (Fig. 12b; Taylor & Surdam, Reference Taylor and Surdam1981; Langella et al., Reference Langella, Cappelletti, Gennaro, Bish and Ming2001). (3) The loose sediments provided adequate porosity for the euhedral and subhedral analcime to crystallize. The feldspar clasts enclosed in the subhedral analcime crystals that were further cemented by the calcite or opaque matrix (Fig. 4b, 4d) indicate that the felsic clasts were deposited before analcime formation, and the calcite subsequently cemented the analcime. The subhedral or euhedral analcime in Turkey formed by direct chemical precipitation from the solution of pyroclastic material or precursor minerals (Karakaya et al., Reference Karakaya, Karakaya and Temel2013). Meanwhile, the analcime also converted preferentially to heulandite and laumontite with significant Ca-activity and higher temperatures and is associated with alkaline zeolites or clays (e.g. clinoptilolite, phillipsite, and montmorillonite) (Iijima & Utada, Reference Iijima and Utada1966; Zhu et al., Reference Zhu, Zhu, Wu, Liu, Li, Jiang and Liu2014). However, alkaline zeolites or smectitic clay minerals were absent from the analcime-bearing samples, indicating that the alteration conditions reached the stability field of analcime (Chipera & Apps, Reference Chipera, Apps, Bish and Ming2001; Langella et al., Reference Langella, Cappelletti, Gennaro, Bish and Ming2001). The unimodal peak grain-size pattern (Fig. 8a,b) reveals that the analcime crystals remain similar in size to the felsic clasts, indicating that the analcime crystals inherited the size of the original volcanic glass shards in the pyroclastic rocks. The felsic clasts and volcanic dust in the volcanic glass would be enclosed in the analcime crystal (Figs 4b,d, 6e), following the conversion of the vitric fragment to analcime.
Schematic diagram showing the genesis of the pyroclastic layers, deposition, and the mixing process of pyroclastic and epiclastic material (a) and the alteration process (b). The alteration process is according to Taylor & Surdam (Reference Taylor and Surdam1981).

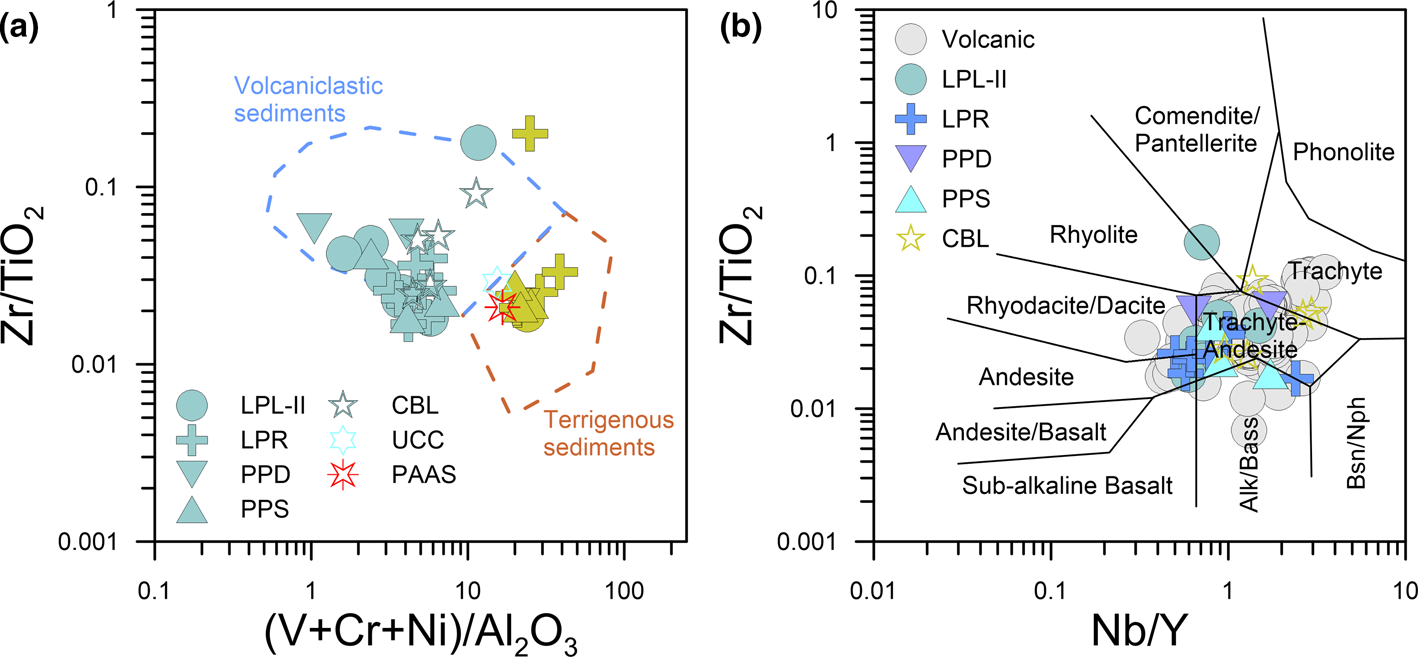
The Zr/TiO2-Nb/Y plot might be used to discriminate the parent rocks of altered volcanic materials (Winchester & Floyd, Reference Winchester and Floyd1977). V, Cr and Ni will be depleted from the volcanic glass during hydration and diagenetic transformation processes with high water/rock ratios (Andreozzi et al., Reference Andreozzi, Dinelli and Tateo1997). The plots of Zr/TiO2-(V+Cr+Ni)/Al2O3 and Zr/TiO2 -Nb/Y have been applied to identify the source rocks of Miocene volcanic ash layers in Italy (Andreozzi et al., Reference Andreozzi, Dinelli and Tateo1997), providing a geochemical approach to distinguish ash beds in the stratigraphic section. In the present study, all analcime-bearing samples are projected as volcaniclastic sediments, while their analcime-poor sedimentary counterparts plot into the range of terrigenous sediments, being different from the pyroclastic samples (Fig. 13a). Furthermore, all the analcime-bearing samples in the plot of Zr/TiO2-Nb/Y are projected in the field of trachyte-andesite, in accordance with the trachyandesite and trachyte potassic–ultrapotassic volcanic rocks present in the southern Tibetan Plateau (Fig. 13b) (Miller et al., Reference Miller, Schuster, Klötzli, Frank and Purtscheller1999; Zhao et al., Reference Zhao, Mo, Dilek, Niu, DePaolo, Robinson, Zhu, Sun, Dong, Zhou, Luo and Hou2009; Guo & Wilson, Reference Guo and Wilson2019). Thus, both plots indicate that all the analcime-bearing samples are trachyte-andesite pyroclastic rocks, confirming the petrographic and mineralogical identifications.
(a) Zr/TiO2 versus (V+Cr+Ni)/Al2O3 discrimination diagram for all of the samples (after Andreozzi et al., Reference Andreozzi, Dinelli and Tateo1997) and (b) Zr/TiO2 versus Nb/Y discrimination diagram for the analcime-bearing samples (after Winchester & Floyd, Reference Winchester and Floyd1977) in the Lunpola Basin. The green and yellow spots in (a) show the analcime-bearing samples and the analcime-poor sedimentary samples, respectively.

Development of a geochemical plot to distinguish analcimes from pyroclastic rocks and sediments
The REE patterns of the analcime-bearing samples are coincident with the volcanic rocks dominated by potassic–ultrapotassic magmatism in the late Oligocene to the Miocene in the Tibetan Plateau. However, they are different from those of the UCC and PAAS, which in turn are similar to the analcime-poor sedimentary samples (Fig. 10a, b). The REE elements are less affected by the diagenetic and weathering process (Rollinson, Reference Rollinson1993), thus suggesting that these volcanic rocks may potentially be the parent rocks of the analcime-bearing samples in the Lunpola Basin.
Major elements show that the Na2O content in analcime-bearing samples is greater than analcime-poor sedimentary samples and the volcanic rocks (Fig. 9a, b), but the K2O is greater in the volcanic rocks than both in the analcime-poor sedimentary samples and analcime-bearing samples (Fig. 9c,d; Table S3). There are two possible processes that may explain the difference in the behaviour of Na and K. First, the potassic–ultrapotassic magmatic rocks contained more K2O than Na2O (Miller., Reference Miller, Schuster, Klötzli, Frank and Purtscheller1999; Williams et al., Reference Williams, Turner, Kelley and Harris2001, Reference Williams, Turner, Pearce, Kelley and Harris2004; Zhao et al., Reference Zhao, Mo, Dilek, Niu, DePaolo, Robinson, Zhu, Sun, Dong, Zhou, Luo and Hou2009), unlike the analcime-bearing samples. This may suggest that K-rich phenocrysts in the volcanic rocks led to a larger Na content in the residual magma compared to K, due to fractional crystallization. This is supported by the observation that the main phenocrysts in the volcanic rocks, including sanidine, phlogopite, Fe-Ti oxides, and clinopyroxene (Miller et al., Reference Miller, Schuster, Klötzli, Frank and Purtscheller1999; Zhao et al., Reference Zhao, Mo, Dilek, Niu, DePaolo, Robinson, Zhu, Sun, Dong, Zhou, Luo and Hou2009; Guo & Wilson, Reference Guo and Wilson2019), contain large amounts of K. This process yielded a relatively Na-rich/K-poor volcanic material that was transported to the basin. Moreover, the hydrolysis of the volcanic materials may be another possible explanation. Na was incorporated into the analcime crystal, and K was released into the solution. The clay adsorbed some of the K released and may have been converted to illite or I-S in the presence of a large amount of illite. Such phenomena are observed in clays in the Lunpola Basin. The analcime-bearing samples contain more illite and a smaller proportion of smectite layers in I-S than their analcime-poor sedimentary counterparts (Table 1).
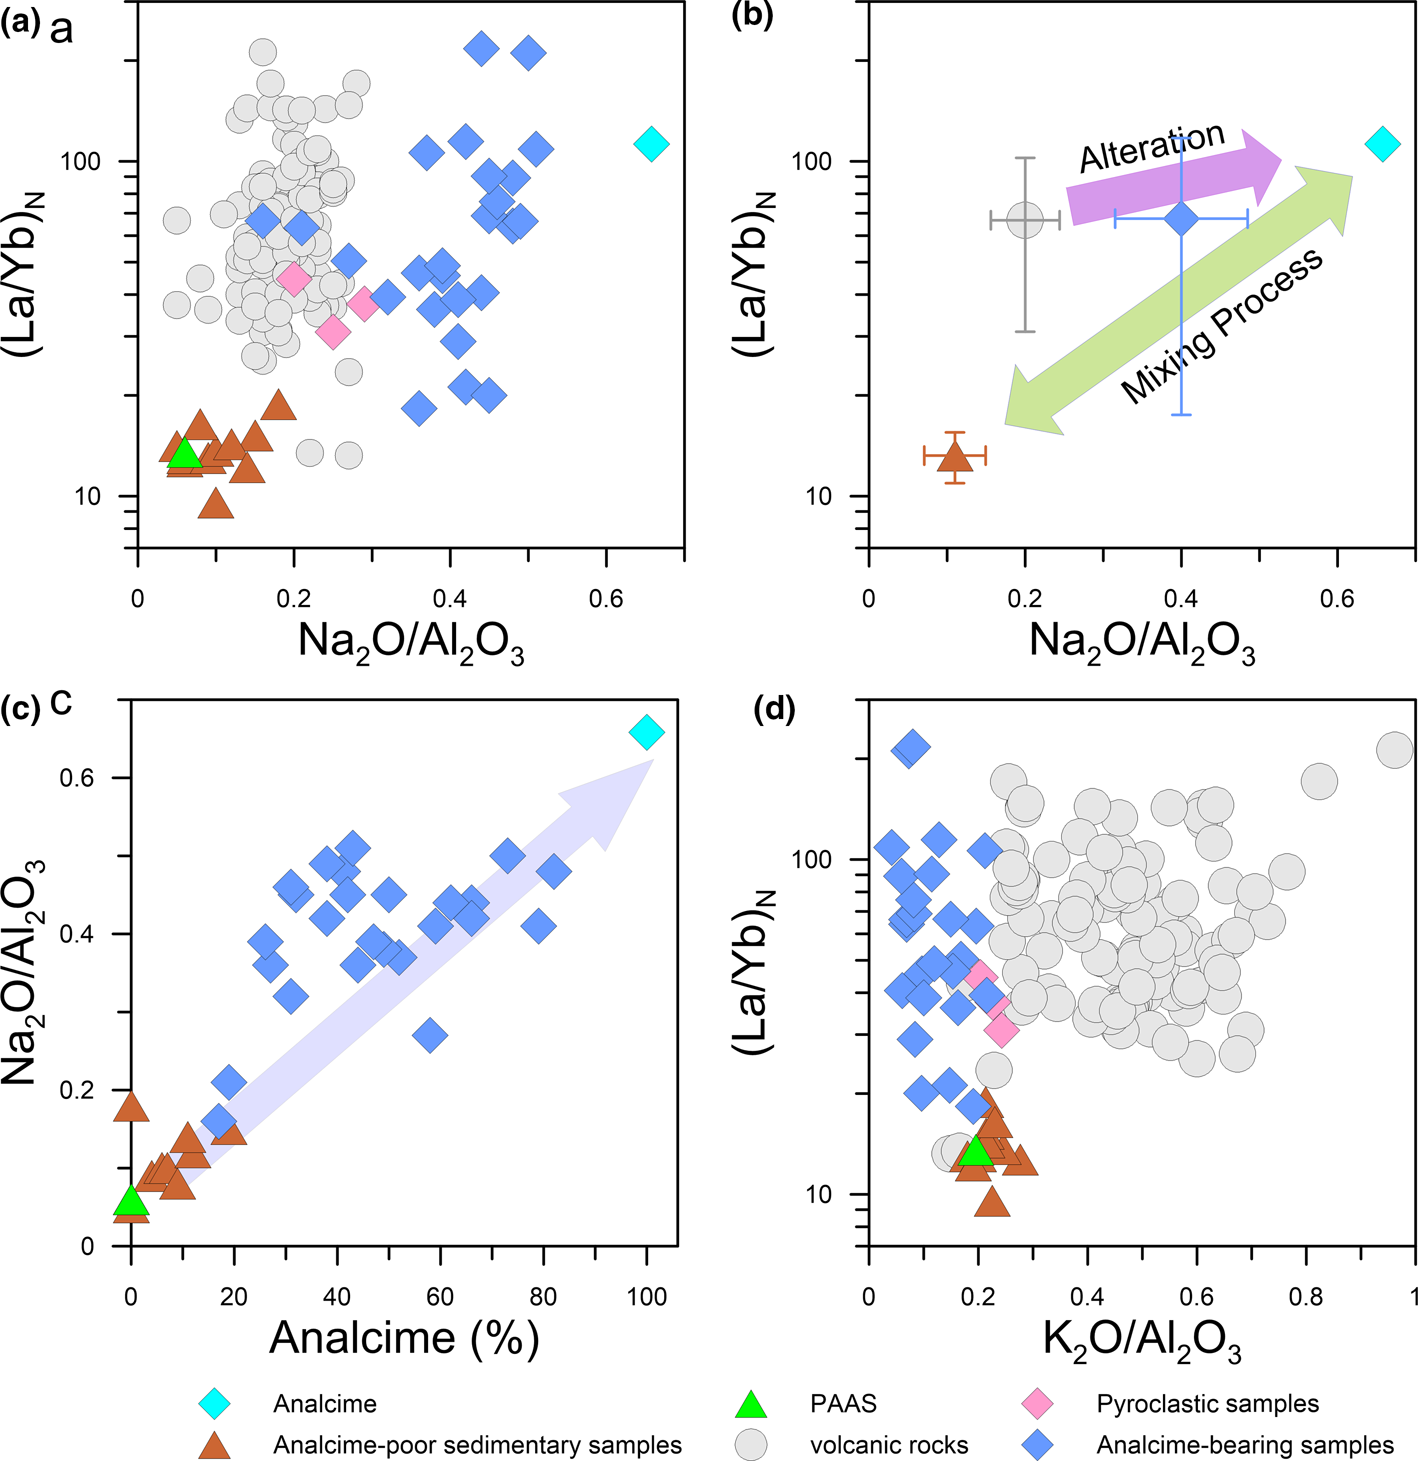
A Na2O/Al2O3 vs. La/Yb diagram is proposed, therefore, which may be used to discriminate the end-members of analcime-poor sedimentary samples, analcime-bearing samples, and volcanic rocks (Fig. 14). The analcime-bearing samples and the volcanic rocks are well separated by an alteration process with comparable variation in the La/Yb ratios and variable Na2O/Al2O3 ratios (Fig. 14a), as well as a mixing process between the analcime-poor sedimentary and analcime-bearing samples (Fig. 14b). The mixing process between the volcanic ash and the analcime-poor sediments is also observed by the positive trend between the Na2O/Al2O3 ratios and analcime content of the rocks (Fig. 14c). Also, the La/Yb ratios in the analcime-bearing samples, unaltered pyroclastic rocks, and volcanic rocks are generally greater than those in the analcime-poor sedimentary samples (Fig. 14a,d). Therefore, the La/Yb ratio may be used as an additional proxy to discriminate the analcime-bearing samples from the remaining sedimentary sequence. Such a mixing process can also be tested by extrapolation of the Na2O/Al2O3-analcime content in relation to pure analcime. The Na2O/Al2O3 ratio of pure analcime is estimated to be 0.658 from the linear correlation in Fig. 14c. Considering the influence of albite and other Na-containing minerals, the Na2O/Al2O3 ratio of 0.658 is in good agreement with the theoretical value according to the chemical formula of diagenetic analcime (0.608) in volcanic tuffs (Chipera & Apps, Reference Chipera, Apps, Bish and Ming2001).
Discrimination diagrams of the analcime-bearing rocks, analcime-poor sedimentary rocks and volcanic rocks. The grey cycles, blue diamonds, pink squares, and brown triangles indicate the volcanic rocks, analcime-bearing rocks, unaltered pyroclastic rocks (Miller et al., Reference Miller, Schuster, Klötzli, Frank and Purtscheller1999), and analcime-poor sedimentary samples, respectively. The La and Yb contents were normalized according to chondrite. The solid grey, brown and blue spots in (b) indicate the average contents of the volcanic rocks, analcime-poor sedimentary rocks, and analcime-bearing rock samples, respectively, and the error bars are according to the standard deviation. The La/Yb ratio of pure analcime (cyan square) was calculated based on the linear correlation between the analcime-bearing samples and the analcime-poor sedimentary samples in (a), with a Na2O/Al2O3 value of 0.658.

Conclusions
The analcime-bearing rocks in the Lunpola Basin consist of euhedral to subhedral authigenic analcime and angular felsic minerals. Typical magmatic minerals such as euhedral hornblende, biotite, and anhedral/euhedral K-feldspar crystals were detected. The analcime-bearing samples are closely associated with volcanic materials. Such analcimes are alteration products of volcanic ash which was deposited in the basin and subjected to post-deposition hydrolysis and reprecipitation of analcime.
The analcime-bearing samples are characterized by a large Na content and a large LREE/HREE ratio, similar to that of the volcanic rocks from the Late Oligocene to the Miocene in the Tibetan Plateau. The analcime formation in the Lunpola Basin includes an alteration process in which volcanic materials were altered to analcime and a process in which analcime was mixed with other sedimentary materials. Thus, the discrimination plot of Na2O/Al2O3-La/Yb can be used to distinguish the sediments and pyroclastic rocks, including the altered pyroclastic rocks in the Lunpola Basin.
Supplementary material
To view supplementary material for this article, please visit https://doi.org/10.1180/clm.2020.39.
Acknowledgements
This work was co-supported by the Strategic Priority Research Program of the Chinese Academy of Sciences (XDA20070201), the National Second Expedition to the Tibetan Plateau (2019QZKK0707), the NSFC fund (grant no. 41620104002; 41877298), and the Youth Innovation Promotion Association of the Chinese Academy of Sciences (2018095) for Y. Yang. The authors are grateful to Prof. George E. Christidis for his comments, which helped to improve the quality of the manuscript. Many thanks to Prof. Albert Galy, Jinxiang Li and anonymous reviewers for their comments, and to Xiaoming Liu, Jing Xie, Shaopeng Gao, Fenjun Tang, Shengli Yang, Chihao Chen and Zhongpeng Han for their help in the field and in the laboratory.