INTRODUCTION
Up to 50% of the children born preterm at very low birth weight (VLBW) manifest cognitive, behavioral, attention, or socialization defects (Volpe, Reference Volpe2009) even when only those with normal intelligence are considered (Anderson, Doyle, & Victorian Infant Collaborative Study Group, Reference Anderson and Doyle2003; Bhutta, Cleves, Casey, Cradock, & Anand, Reference Bhutta, Cleves, Casey, Cradock and Anand2002; Short et al., Reference Short, Klein, Lewis, Fulton, Eisengart and Kercsmar2003; Wolke & Meyer, Reference Wolke and Meyer1999). Thus, it is important to understand the dynamics of development and effects that moderate development in children born preterm. One factor that has been demonstrated to moderate development is parenting style. For example, parenting style influences emotional, social, language, and cognitive development and the risk for psychiatric disorders (Fletcher, Walls, Cook, Madison, & Bridges, Reference Fletcher, Walls, Cook, Madison and Bridges2008; Guajardo, Snyder, & Petersen, Reference Guajardo, Snyder and Petersen2009; Neeren, Alloy, & Abramson, Reference Neeren, Alloy and Abramson2008; Noel, Peterson, & Jesso, Reference Noel, Peterson and Jesso2008). Supportive parenting can have positive effects on cognitive, behavioral, and psychological development from childhood through adulthood (Beckwith, Rodning, & Cohen, Reference Beckwith, Rodning and Cohen1992; Eshel, Daelmans, de Mello, & Martines, Reference Eshel, Daelmans, de Mello and Martines2006; Fletcher et al., Reference Fletcher, Walls, Cook, Madison and Bridges2008; Landry, Smith, Swank, Assel, & Vellet, Reference Landry, Smith, Swank, Assel and Vellet2001; Landry, Smith, & Swank, Reference Landry, Smith and Swank2003; Landry, Smith, & Swank, Reference Landry, Smith and Swank2006; Landry, Smith, Swank, & Guttentag, Reference Landry, Smith, Swank and Guttentag2008; Smith Landry, & Swank, Reference Smith, Landry and Swank2005, Reference Smith, Landry and Swank2006).
Previously we reported that supportive parenting had a positive affect on cognitive development in a large cohort of children born at term and preterm at VLBW (Landry et al., Reference Landry, Smith, Swank, Assel and Vellet2001). Maternal behaviors were examined at 6, 12, and 24 months and 3½ and 4½ years of age during a 70-minute home visit. Trained observers rated maternal responsiveness (acceptance, flexibility/responsiveness) and verbal and non-verbal stimulation (Landry, Smith, Miller-Loncar, Swank, Reference Landry, Smith, Miller-Loncar and Swank1997). Analysis of maternal responsiveness scores with principal component analysis revealed two factors: one representing the early (6, 12, and 24 month) scores and one representing the later (3.5 and 4.5 year) scores. A hierarchical clustering analysis of these principal component factors identified four distinct clusters: high maternal responsiveness across all ages; high maternal responsiveness during the early, but not the later, ages; moderate maternal responsiveness during the later, but not the earlier, ages; and low maternal responsiveness across all ages. Maternal stimulation behaviors were examined across the maternal responsiveness clusters. Mothers that demonstrated consistently high responsiveness across the early and later ages demonstrated higher rates of stimulation and lower rates of restrictive behaviors while interacting with their child. Inconsistent responsive mothers (i.e., high or moderate maternal responsiveness only during the early or later ages) were more directive toward their child during the early ages but demonstrated behaviors similar to the mothers with consistent responsiveness during the later ages. Mothers with consistently low responsiveness across the early and later ages (i.e., unresponsive mothers) showed the lowest level of stimulation and a greater reliance on control and restrictive behaviors.
The child’s cognitive and language skills were also assessed at these ages. The Bailey Scales of Infant Development and the Sequenced Inventory of Communication Development were used at 6, 12, and 24 months of age; while the Stanford-Binet Intelligence Test and the Clinical Evaluation of Language Fundamentals were used at 3.5 and 4.5 years of age. Maternal responsiveness was significantly associated with cognitive-language development. Consistent maternal responsiveness was associated with better cognitive-language development than other parenting groups while inconsistent maternal responsiveness was associated with higher levels of cognitive-language development than unresponsive mothers. These relations were influenced by whether the child was born term or preterm. In general, the rate of cognitive-language development in children born preterm was closer to the rate of cognitive-language development of the children born at term for children whose mothers demonstrated higher responsiveness as compared to children whose mothers demonstrated lower responsiveness (Landry et al., Reference Landry, Smith, Swank, Assel and Vellet2001).
Despite the behavioral evidence that supportive parenting can have, a positive moderating effect on cognitive development, little is known about the effect of supportive parenting on brain development. In fact, only the effect of adverse parenting on brain development has been investigated (Taylor, Eisenberger, Saxbe, Lehman, & Lieberman, Reference Taylor, Eisenberger, Saxbe, Lehman and Lieberman2006; Yap et al., Reference Yap, Whittle, Yucel, Sheeber, Pantelis and Simmons2008). Research concerning the effect of positive parenting on brain development is particularly absent in vulnerable populations, such as children born preterm, that might benefit the most from positive parenting. Children born preterm demonstrate atypical development in brain anatomy. Abnormalities in whole brain, white and gray matter, hippocampus, and deep brain nuclei volume, and well as differences in gray matter volume asymmetry have been demonstrated in children born preterm (Abernethy, Cooke, & Foulder-Hughes, Reference Abernethy, Cooke and Foulder-Hughes2004; Nosarti, Al-Asady, Frangou, Stewart, Rifkin, & Murray, Reference Nosarti, Al-Asady, Frangou, Stewart, Rifkin and Murray2002; Peterson et al., Reference Peterson, Anderson, Ehrenkranz, Staib, Tageldin and Colson2003). Although investigators have measured changes in cortical gray matter volume in children born preterm, newer methods now allow the two components of gray matter volume, surface area and thickness, to be delineated and analyzed separately. Analyzing the individual components of gray matter volume separately is particularly important because each component has been shown to dynamically change differently throughout development.
Cortical surface area, relative to cerebral volume, dramatically increases during late fetal development but is believed to change little after birth (Kapellou et al., Reference Kapellou, Counsell, Kennea, Dyet, Saeed and Stark2006). In the neonatal period the surface area has been shown to be reduced relative to cerebral volume for children born preterm and cortical surface area, relative to cerebral volume, has been shown to be related to neurodevelopment at 2 years of age (Kapellou et al., Reference Kapellou, Counsell, Kennea, Dyet, Saeed and Stark2006). Surface area appears to be abnormal in adolescents and young adults with neurodevelopmental disorders that are believed to have a prenatal onset such developmental phonological dyslexia (Frye, Liederman, Malmberg, MacLean, Strickland, & Beauchamp, Reference Frye, Liederman, Malmberg, MacLean, Strickland and Beauchamp2010). This suggests that abnormalities in the development of cortical surface area during early brain development may persist into adolescences and adulthood.
Unlike surface area, cortical thickness changes dynamically across the life span as a consequence of development and disease. Cortical thinning may reflect the absence of specific cortical neurons due to neurodegenerative disease (Im, Lee, Seo, Kim, et al., Reference Im, Lee, Won Seo, Hyung Kim, Kim and Na2008; Im, Lee, Seo, Yoon, et al., Reference Im, Lee, Won Seo, Hyung Kim, Kim and Na2008; Seo et al., Reference Seo, Im, Lee, Kim, Kim and Kim2007). Cortical thickness, particularly in the frontal and temporal regions, appears to be related to neurodevelopmental disorders such as attention-deficit disorder (Shaw et al., Reference Shaw, Lalonde, Lepage, Rabin, Eckstrand and Sharp2009) and autism (Raznahan et al., Reference Raznahan, Toro, Daly, Robertson, Murphy and Deeley2009). Fluctuations in cortical thickness, as a consequence of different phases of laminar growth, as well as pruning of cortical connections, vary with stage of development (Landing, Shankle, Hara, Brannock, & Fallon, Reference Landing, Shankle, Hara, Brannock and Fallon2002; Shaw et al., Reference Shaw, Kabani, Lerch, Eckstrand, Lenroot and Gogtay2008). Thickness fluctuations during adolescence may be particularly important because such fluctuation occur in the higher-order frontal, temporal and parietal areas (Rabinowicz, Petetot, Khoury, & de Courten-Meyers, Reference Rabinowicz, Petetot, Khoury and de Courten-Myers2009). In general, cortical thickness peaks in early adolescence and then decreases through adolescence into adulthood. These changes during adolescence appear to be independent of white matter maturation (Tamnes, Ostby, Fjell, Westlye, Due-Tønnessen, & Walhovd, Reference Tamnes, Ostby, Fjell, Westlye, Due-Tønnessen and Walhovd2010). Of interest, abnormal cortical thinning appears to be associated with psychiatric disorders with adolescence onset (Janssen et al., Reference Janssen, Reig, Alemán, Schnack, Udias and Parellada2009; Voets et al., Reference Voets, Hough, Douaud, Matthews, James and Winmill2008).
In this study, we investigated the relation between preterm birth and brain development and the moderating effect of maternal responsiveness on this relation. We obtained anatomic magnetic resonance imaging (MRI) scans on 33 adolescents systemically selected from our longitudinal study on child development based on whether they were born at term or preterm and maternal responsiveness. The components of gray matter volume, cortical surface area, and cortical thickness, were determined using a well-validated algorithm (Fischl et al., Reference Fischl, Salat, Busa, Albert, Dieterich and Haselgrove2002; Makris et al., Reference Makris, Kaiser, Haselgrove, Seidman, Biederman and Boriel2006). We focused our analysis on the frontal, temporal, and parietal areas for several reasons: first, these areas are particular important in the cognitive limitations associated with preterm birth; and, second, studies have identified neural networks essential for verbal and non-verbal interpersonal interactions in these regions (Herold et al., Reference Herold, Feldmann, Simon, Tenyi, Kover and Nagy2009; Kobayashi, Glover, & Temple, Reference Kobayashi, Glover and Temple2007a,Reference Kobayashi, Glover and Templeb; Kobayashi, Glover, & Temple, Reference Kobayashi, Glover and Temple2008). In addition, we examined hemispheric differences in cortical surface area and thickness because differences in hemispheric cortical gray matter volume has been associated with preterm birth (Peterson et al., Reference Peterson, Anderson, Ehrenkranz, Staib, Tageldin and Colson2003).
From previous evidence we make several predictions. First, we predict that the general surface area attenuation associated with preterm birth will continue into adolescence and that cortical thickness differences between adolescents born preterm and term will occur in regions related to the cognitive and language deficits associated with preterm birth. Second, we predict that maternal responsiveness will moderate differences in cortical thickness, but not cortical surface area. This is based on the fact that relative surface area is believed to primarily change prenatally, whereas cortical thickness appears to dynamically change throughout life and that cognitive disorders associated with experience, such as posttraumatic stress disorder, are associated with cortical thickness abnormalities (Geuze, Westenberg, Heinecke, de Kloet, Goebel, & Vermetten, Reference Geuze, Westenberg, Heinecke, de Kloet, Goebel and Vermetten2008). Furthermore, we believe that an interaction will occur between maternal responsiveness and preterm birth, such that greater similarities will be found in cortical thickness between adolescents born term and preterm for those with consistently responsive mothers as compared to those with consistently unresponsive mothers. Such anatomic evidence would confirm our previous cognitive and language developmental findings (Landry et al., Reference Landry, Smith, Swank, Assel and Vellet2001).
METHODS
Participants in the Longitudinal Study
Participants were selected from a longitudinal cohort of 360 children recruited from three Houston area hospitals. Term children had no significant prenatal, perinatal, or neonatal complications. Children born preterm had a gestational age ≤36 weeks, a birth weight <=1600 g, and were demographically similar to those born term. Participants were excluded if they had nervous system abnormalities, symptomatic syphilis, short bowel syndrome, positive HIV antibody, the mother was <16 years of age or tested positive for drugs at the time of the child’s birth or if English was not the primary language at home. Most participants were African-American (63.0%) with fewer being of Caucasian (20.1%) and Hispanic (15.0%) ethnicity. The sample contained predominately participants of lower socioeconomic status. There were slightly more females than males. Quality of schooling, socioeconomic status, gender, and ethnicity were not different across birth groups. All children in this cohort were assigned a parenting group in our previous study (Landry et al., Reference Landry, Smith, Swank, Assel and Vellet2001).
Selection of Adolescents for the Current Study
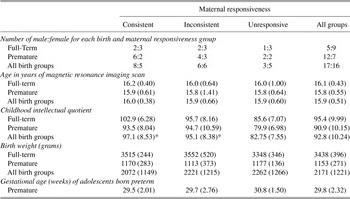
Sixteen (5%) of the original cohort was eliminated due to two or more Stanford-Binet 4th Ed. quantitative skill scores below 85 during the 3rd, 5th, or 7th grades. This subscale was used due to its relatively low language load. In addition, 91 participants (25%) were eliminated due to attrition, leaving a total of 253 participants. Our goal was to select at least five participants from each maternal responsiveness and birth group combination evenly distributed across gender (Table 1). We were also sensitive to selecting children with a wide range of intellectual abilities within each group combination.
Patient characteristics

Note
Means and standard deviations are provided for age, IQ, birth weight and gestational age. Age represents age at which magnetic resonance imaging scan was obtained. Stanford-Binet IQ was derived from the average obtained during the 3rd, 5th, and 7th grades. Gestation age at birth is reported for all adolescents born preterm. *Significant difference as compared to unresponsive maternal responsiveness group.
To obtain a sufficient sample size for each maternal responsiveness group, we combined the two groups with inconsistent maternal responsiveness because they demonstrated similarities in cognitive and language development (Landry et al., Reference Landry, Smith, Swank, Assel and Vellet2001). Recruitment from the group with low maternal responsiveness was limited for three reasons: a smaller number of children were assigned to this group in the original study, this group contained more children with an IQ low enough to be excluded from the current study, and attrition was higher in this group.
Many of the participants could not participate due to braces as the metal in the braces distorts the MRI’s magnetic field. Of the potential participants selected, nine declined to participate, one demonstrated ventriculomegaly, and technical problems arose in two. Gender, age at MRI scan, Stanford-Binet IQ, and birth weight were compared across maternal responsiveness and birth groups using a χ2 or analysis of variance (ANOVA). Gestational age is presented only for adolescents born preterm because the exact gestational age for the children born term was not recorded in our data. The age range of the participants was limited from 15 years 9 months to 17 years 2 months.
To ensure that the participants examined in this study represented the original cohort, the Stanford-Binet IQ, birth weight, gestational age, and socioeconomic status was compared between the participants selected for this study and the original cohort for each birth and maternal responsiveness group using t tests. In addition, a χ2 was used to compare the male:female ratio between the participants selected for this study and the original cohort. No differences between the participants selected for this study and the larger cohort was found.
Because handedness can influence brain development, only right-handed participants were included in this study. Right-handedness was confirmed by an Edinburgh Handedness Inventory (Oldfield, Reference Oldfield1971) laterality index score greater than 50 (Dragovic, Reference Dragovic2004). After description of the study, written informed consent was obtained in accordance with our Institutional Review Board regulations.
MRI Protocol
A three-dimensional T1-weighted (echo time = 4.03 ms, repetition time = 8.6 ms, flip angle = 8°, field of view = 256 mm, 256 contiguous 1-mm slices, matrix = 256 × 256) magnetization-prepared 180° radio-frequency pulses and rapid gradient-echo sequence optimized for gray-white matter contrast differentiation was used to collect two sets of high-resolution structural MRIs on a 3.0 Tesla Phillips Achieva scanner with Dual Quasar gradients (62 mT/m) and all-digital radio frequency acquisition system.
MRI Processing
Each participant’s brain was processed separately using an automated processing stream that required no manual user intervention. Cortical reconstruction and volumetric segmentation was performed with the Freesurfer image analysis suite (http://surfer.nmr.mgh.harvard.edu/). First, the two T1 MRI volumes were corrected for participant motion during the acquisition and averaged together. Next, non-brain tissue was removed using a hybrid watershed/surface deformation procedure (Fischl, Salat, et al., Reference Fischl, Salat, van der Kouwe, Makris, Segonne and Quinn2004), followed by segmentation of the subcortical white matter and deep gray matter volumetric structures (Fischl et al., Reference Fischl, Salat, Busa, Albert, Dieterich and Haselgrove2002; Fischl, van der Kouwe, et al., Reference Fischl, Salat, van der Kouwe, Makris, Segonne and Quinn2004). Next, the gray-white matter border was identified and tessellated. This process created a model of the cortical surface by constructing a polygonal mesh made up of adjacent triangles, each with three edges and three vertices. The cortical mesh contained ~150,000 vertices per hemisphere (Dale, Fischl, & Sereno, Reference Dale, Fischl and Sereno1999; Dale and Sereno, Reference Dale and Sereno1993; Fischl and Dale, Reference Fischl and Dale2000; Fischl, Sereno, & Dale, Reference Fischl, Sereno and Dale1999). Several deformation procedures were then performed on the cortical model and defects in the cortical surface model were automatically corrected using manifold surgery (Fischl, Sereno, & Dale, Reference Fischl, Sereno and Dale1999; Fischl, Liu, & Dale, Reference Fischl, Liu and Dale2001; Segonne, Pacheco, & Fischl, Reference Segonne, Pacheco and Fischl2007).
Cortical thickness and surface area were calculated at each vertex of the cortical mesh. Measures of cortical thickness have been validated and demonstrate good test–retest reliability across scanner manufacturers and across field strengths (Han et al., Reference Han, Jovicich, Salat, van der Kouwe, Quinn and Czanner2006). Cortical surface area was calculated for each triangle in the mesh (Fischl and Dale, Reference Fischl and Dale2000; Pienaar, Fischl, Caviness, Makris, & Grant, Reference Pienaar, Fischl, Caviness, Makris and Grant2008). Total cortical surface area defined by this method has been shown to be in agreement with postmortem studies, validated on brain phantoms and compared with other surface-based techniques (Eskildsen & Ostergaard, Reference Eskildsen and Ostergaard2007; Lee, Lee, Kim, Kim, Evans, & Kim, Reference Lee, Lee, Kim, Kim, Evans and Kim2006; Makris et al., Reference Makris, Kaiser, Haselgrove, Seidman, Biederman and Boriel2006).
This processing stream parcellated the cortex into regions of interest (ROIs) using a validated first order anisotropic non-stationary Markov random field model algorithm that uses both global and local position as well as curvature information (Desikan et al., Reference Desikan, Segonne, Fischl, Quinn, Dickerson and Blacker2006; Fischl, van der Kouwe, et al., Reference Fischl, van der Kouwe, Destrieux, Halgren, Segonne and Salat2004). Due to their involvement in cognitive and language development, we selected the inferior, middle, and superior frontal, anterior cingulate, superior (including banks superior), middle, and inferior temporal, angular (inferior parietal), supramarginal, and superior parietal cortical regions. The average cortical thickness across all vertices within each ROI and the total surface area of all of the triangles contained within each ROI were used as the dependent variables. These dependent measures were also calculated with each hemisphere separately.
Statistical Analysis
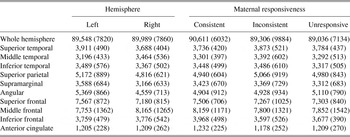
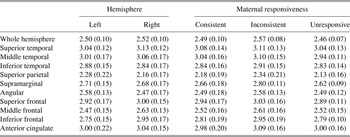
The mean and standard deviation for the thickness and surface area of each hemisphere and each ROI are provided in Tables 2 and 3.
Mean (standard deviation) surface area (mm2) for each cortical region by hemisphere and maternal responsiveness

Mean (standard deviation) thickness (mm) for each cortical region by hemisphere and maternal responsiveness

ANOVA and analysis-of-covariance (ANCOVA) were used to investigate whether preterm birth was associated with differences in cortical surface area and thickness, while controlling for brain hemisphere (left vs. right). Additionally, we aimed to determine whether maternal responsiveness moderated such relationships. ANOVAs and ANCOVAs were implemented as linear mixed-models using the GLIMMIX procedure of SAS 9.1 (SAS Institute Inc., Cary, NC). The intercept was a random effect, maternal responsiveness and preterm birth were between-subject effects and hemisphere was a within-subjects effect. Because it is possible for age, gender, and/or Stanford-Binet IQ to be associated with cortical development, we included these effects as factors as part of the initial ANCOVA models. Because these factors were not found to be significantly associated with any dependent measure we eliminated them from further consideration.
Two analyses were used to examine each dependent variable. First, we examined the effect of preterm birth and hemisphere on the dependent variable. After this first analysis was simplified, as described below, the maternal responsiveness variable was added to the resulting model as a constant effect and interaction with the variables remaining in the linear model. For each analysis, all effects along with their interactions were examined for significance and the model was simplified by removing the highest order non-significant interaction, or effect if no interaction existed, and the model was recomputed. This simplification procedure was repeated until all effects and interactions in the model were significant with the exception that non-significant effects remained in the model if they were dependent effects of a significant interaction. This procedure has been widely used by our group and others (Frye, Fisher, Coty, Zarella, Liederman, & Halgren, Reference Frye, Fisher, Coty, Zarella, Liederman and Halgren2007; Frye et al., Reference Frye, Fisher, Witzel, Ahlfors, Swank and Liederman2008; Frye, Hasan, et al., Reference Frye, Hasan, Xue, Strickland, Malmberg and Liederman2009; Frye, Landry, Swank, & Smith, Reference Frye, Landry, Swank and Smith2009; Frye et al., Reference Frye, Liederman, Malmberg, MacLean, Strickland and Beauchamp2010; Landry et al., Reference Landry, Smith, Swank, Assel and Vellet2001).
Total hemispheric surface area and thickness were the first dependent variables examined. Next, each ROI was examined while controlling for the relationship between the dependent variable and the corresponding hemispheric measurement. This was done by including the hemispheric measurement in the model as a covariate when examining each ROI (Frye et al., Reference Frye, Liederman, Malmberg, MacLean, Strickland and Beauchamp2010). In this way, the relation between a fixed effect and the dependent variable in a ROI would not occur simply because that relation occurred for the entire hemisphere. Because we conducted statistical analyses for multiple ROIs, we mitigated Type I error by setting the alpha to 0.01. Interactions were analyzed using orthogonal contrasts.
Cortical Surface Area and Thickness Difference Maps
Surfaced-based cortical maps were produced to visualize the differences detected by the statistical analyses. A difference map depicts a Z-score at each cortical vertex. The cortical surface was created by non-rigidly aligning each participant’s cortical surface to a unit sphere and used individual cortical folding patterns to match cortical geometry across participants, averaging the surfaces in the spherical coordinate system and re-inflating the averaged surface (Fischl, Sereno, Tootell, & Dale, Reference Fischl, Sereno, Tootell and Dale1999).
RESULTS
Participant Characteristics
Neither the number of males nor females nor age was significantly different across maternal responsiveness or birth groups. The average Stanford-Binet IQ was significantly different across maternal responsiveness, F(2,26) = 8.80, p = .001, but not birth groups. Adolescents with unresponsive mothers demonstrated a lower IQ than the adolescents with consistently, t(26) = 4.08, p < .001, and inconsistently, t(26) = 3.20, p < .01, responsive mothers. Birth weight, F(1,26) = 318.71, p < .0001, was lower for adolescents born preterm as compared to adolescents born at term but were not different across maternal responsiveness groups.
Surface Area
Hemispheric surface area was greater in the right hemisphere as compared to the left hemisphere, F(1,31) = 11.23, p < .01, and in adolescents born term as compared to those born preterm, F(1,31) = 8.71, p < .01. Inferior temporal surface area was greater in adolescents born term as compared to those born preterm, F(1,31) = 10.52, p < .01 (Figure 1, purple arrow) but there was no difference between right and left inferior temporal surface area. Surface area was greater in the left superior temporal, F(1,30) = 18.74, p < .001, superior parietal, F(1,30) = 8.80, p < .01, supramarginal, F(1,30) = 24.00, p < .0001, angular, F(1,30) = 75.64, p < .0001, and superior frontal, F(1,30) = 18.50, p < .001, areas while the surface area was greater in the right middle temporal, F(1,30) = 7.95, p < .01, and middle frontal, F(1,30) = 13.04, p < .001, areas (Tables 2). Surface area was not different across birth groups for the superior or middle temporal, superior parietal, supramarginal, angular, or superior or middle frontal areas. The hemispheric surface area covariate was significantly related to the surface area in the superior temporal, F(1,30) = 39.33, p < .0001, middle temporal, F(1,30) = 55.60, p < .0001, inferior temporal surface area, F(1,31) = 36.93, p < .0001, superior parietal, F(1,30) = 21.88, p < .0001, supramarginal, F(1,30) = 20.37, p < .0001, angular, F(1,30) = 32.73, p < .0001, superior frontal, F(1,30) = 76.35, p < .0001, middle frontal, F(1,30) = 19.24, p < .0001 and inferior frontal, F(1,31) = 21.32, p < .001, regions. No effects were significant for anterior cingulate surface area. Maternal responsiveness did not moderate any of the effects of surface area reported above.
Cortical thickness (left) and surface area (right) compared across birth groups [term vs. very low birth weight (VLBW) preterm] with arrows highlighting regional differences (see text). Color scale represents Z-scores. The scale of Z-scores varies from greater structural size (cortical thickness or surface area) for the term group to greater structural size (cortical thickness or surface area) for the preterm group. Specific regional subareas are depicted in the cortical diagram below the data figures.

Cortical Thickness
Cortical thickness was greater in the right hemisphere as compared to the left hemisphere, F(1,31) = 7.66, p < .01, but was not different across birth group. Cortical thickness was greater for adolescents born at term as compared to adolescents born preterm in the superior, F(1,31) = 7.67, p < .01, and middle, F(1,31) = 8.04, p < .01, temporal regions (Figure 1, large yellow arrows) but cortical thickness was not different across these regions in the right and left hemispheres. The inferior frontal cortical thickness was greater for adolescents born at term as compared to adolescents born preterm, F(1,30) = 7.60, p < .01 (Figure 1, thick light blue arrows) and in the right inferior frontal area as compared to the left, F(1,30) = 81.80, p < .0001. Anterior cingulate cortical thickness was greater for adolescents born preterm as compared to adolescents born at term, F(1,31) = 9.03, p < .01, (see Figure 1, thick red arrows), but cortical thickness was not different across hemispheres in this areas. Cortical thickness was greater in the left inferior temporal, F(1,30) = 6.60, p < .01, superior parietal, F(1,30) = 24.61, p < .0001, supramarginal, F(1,30) = 9.55, p < .01, and angular, F(1,30) = 53.37, p < .0001, regions, while thickness was greater in the right superior, F(1,30) = 17.36, p < .001, and middle, F(1,30) = 80.17, p < .0001, frontal areas but thickness in these cortical regions did not differ across birth groups. The hemispheric thickness covariate was significantly related to thickness in the superior temporal, F(1,31) = 10.89, p < .01, middle temporal, F(1,31) = 57.83, p < .0001, inferior temporal, F(1,30) = 23.51, p < .001, superior parietal, F(1,30) = 48.04, p < .0001, supramarginal, F(1,30) = 103.63, p < .0001, angular, F(1,30) = 85.24, p < .0001, superior frontal, F(1,30) = 61.43, p < .0001, middle frontal, F(1,30) = 87.49, p < .0001, inferior frontal, F(1,30) = 73.09, p < .0001, and anterior cingulate, F(1,31) = 12.23, p < .001, regions.
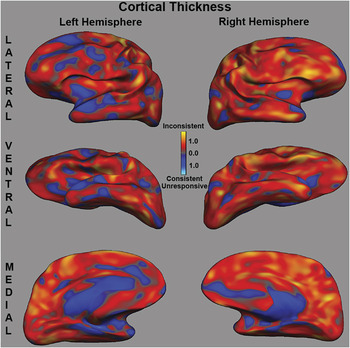
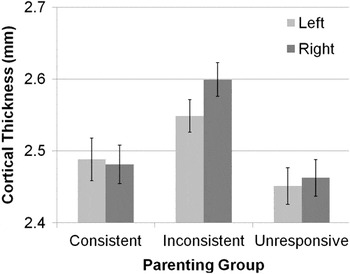
Maternal responsiveness moderated the effect of hemispheric thickness reported above, F(2,29) = 7.44, p < .01. Adolescents with inconsistently responsive mothers demonstrated a greater difference in cortical thickness across hemispheres as compared to adolescents with consistently responsive, t(29) = 3.82, p < .001, and unresponsive, t(29) = 2.30, p < .05, mothers. The latter two maternal responsiveness groups showed little difference in cortical thickness across hemispheres (Figures 2, 3). The difference in cortical thickness across hemispheres for adolescents with inconsistently responsive mothers was the result of the right hemisphere being thicker than the left hemisphere. In addition, overall cortical thickness was different across maternal responsiveness groups. Adolescents with inconsistently responsive mothers demonstrated an overall thicker cortex compared with adolescents with consistently responsive, t(29) = 2.57, p = .02, and unresponsive, t(29) = 2.97, p < .01, mothers (Figure 2).
Cortical thickness compared between inconsistently responsive mothers and consistently responsive and unresponsive mothers combined. Color scale represents Z-scores. The scale of Z-scores varies from greater cortical thickness for adolescents in the inconsistent parenting group to greater cortical thickness for the adolescents in the consistent and unresponsive parenting groups.

Average left and right hemispheric thickness across maternal responsiveness groups.

DISCUSSION
This study examined adolescents born term and preterm whose development was followed since birth. We determined whether preterm birth was associated with atypical hemispheric and regional (frontal, temporal, parietal) cortical thickness or surface area. We then examined whether supportive parenting, as measured by responsiveness of the mother to her child during infancy and early childhood, moderated these relations. Preterm birth was associated with differences in both cortical thickness and surface area. Maternal responsiveness was found to be associated with differences in cortical thickness, but not surface area, and did not interact with the effects of preterm birth.
Prematurity Is Associated With Differences in Both Surface Area and Thickness
Although it is known that the relative cortical surface area is attenuated in neonates and young children born preterm (Kapellou et al., Reference Kapellou, Counsell, Kennea, Dyet, Saeed and Stark2006), only one study has measured surface area in adolescents who were born preterm (Martinussen et al., Reference Martinussen, Fischl, Larsson, Skranes, Kulseng and Vangberg2005). By measuring surface area in adolescence rather than in childhood or infancy, we have confirmed that abnormalities in cortical growth associated with preterm birth continue into adolescence.
The surface area difference maps did not reveal a spatially homogenous reduction in surface area across the cortex, suggesting that surface area reductions were not spatially aligned across participants. A difference between the term and preterm adolescents in the inferior temporal area was additionally found, even when the effect of hemispheric surface area was taken into account. Abnormalities in relative cortical surface area have been related to neurodevelopmental and psychiatric disorders such as autism spectrum disorder (Nordahl et al., Reference Nordahl, Dierker, Mostafavi, Schumann, Rivera and Amaral2007) and schizophrenia (White, Andreasen, Nopoulos, & Magnotta, Reference White, Andreasen, Nopoulos and Magnotta2003). Of interest, preterm birth and medical complications are both risk factors for developing these disorders and are associated with a relative attenuation in cortical surface area. This suggests that abnormalities in surface area could be the mechanism that links preterm birth and medical complications to an increased risk for neurodevelopmental and psychiatric disorders (Byrne, Agerbo, Bennedsen, Eaton, & Mortensen, Reference Byrne, Agerbo, Bennedsen, Eaton and Mortensen2007; Cannon, Jones, & Murray, Reference Cannon, Jones and Murray2002; Kuban, O’Shea, Allred, Tager-Flusberg, Goldstein, & Leviton, Reference Kuban, O’Shea, Allred, Tager-Flusberg, Goldstein and Leviton2009; Limperopoulos et al., Reference Limperopoulos, Bassan, Sullivan, Soul, Robertson and Moore2008).
Adolescents born preterm demonstrated thinner superior and middle temporal and inferior frontal areas and a thicker anterior cingulate area as compared to adolescents born at term, thereby confirming earlier findings (Martinussen et al., Reference Martinussen, Fischl, Larsson, Skranes, Kulseng and Vangberg2005). Cortical regions found to be thinner in adolescents born preterm subserve cognitive functions that are commonly identified as deficient in children and adolescents born preterm such as defects in executive function (Anderson, Doyle, & Victorian Infant Collaborative Study Group, Reference Anderson and Doyle2004; Aylward, Reference Aylward2002; Bayless and Stevenson, Reference Bayless and Stevenson2007), reasoning skills (Smith, Landry, & Swank, Reference Smith, Landry and Swank2000), and language deficits (Sansavini, Guarini, Alessandroni, Faldella, Giovanelli, & Salavioli, Reference Sansavini, Guarini, Alessandroni, Faldella, Giovanelli and Salvioli2006, Reference Sansavini, Guarini, Alessandroni, Faldella, Giovanelli and Salvioli2007; Stolt, Klippi, Launonen, Minck, & Lehtonen, Reference Stolt, Klippi, Launonen, Munck and Lehtonen2007). It is known that gray matter density, which is highly correlated with thickness, decreases through late childhood and into early adolescence, presumably as a consequence of synaptic pruning, in the brain areas found to have thickness differences across birth groups in this study (Gogtay et al., Reference Gogtay, Giedd, Lusk, Hayashi, Greenstein and Vaituzis2004; Shaw et al., Reference Shaw, Kabani, Lerch, Eckstrand, Lenroot and Gogtay2008). This could suggest that either underdevelopment or excessive pruning may occur in the temporal and inferior frontal regions and inadequate pruning might occur in the anterior cingulate area during development. Underconnectivity between temporal and frontal areas has been documented in children born preterm. Fewer connections between these areas could result in greater cortical pruning due to decreased afferent and efferent neurons and a thinner cortex (Skranes et al., Reference Skranes, Vangberg, Kulseng, Indredavik, Evensen and Martinussen2007).
Maternal Responsiveness Was Associated With Differences in Whole-Brain Thickness
Maternal responsiveness was associated with differences in cortical thickness. Whole-brain thickness was greater and more asymmetric for adolescents with inconsistently responsive mothers compared with adolescents with consistently responsive and unresponsive mothers. The dynamics of cortical thickness during adolescence is just starting to be understood. Studies suggest that adolescents with neurodevelopmental and psychiatric disorders demonstrate reduced cortical thickness (Janssen et al., Reference Janssen, Reig, Alemán, Schnack, Udias and Parellada2009; Raznahan et al., Reference Raznahan, Toro, Daly, Robertson, Murphy and Deeley2009; Shaw et al., Reference Shaw, Lalonde, Lepage, Rabin, Eckstrand and Sharp2009; Voets et al., Reference Voets, Hough, Douaud, Matthews, James and Winmill2008) and that practice on a visual-spatial game for 3 months results in an increase in regional cortical thickness (Haier, Karama, Leyba, & Jung, Reference Haier, Karama, Leyba and Jung2009). This suggests that the increase in cortical thickness seen in the adolescents with inconsistently responsive mothers is unlikely to be pathologic and could result from the enhanced use of cognitive processes. The current study only measured cortical thickness at one time point. This does not provide enough information to determine whether the differences in cortical thickness were due to a change in the dynamics of cortical growth or relatively static difference in thickness.
We predicted that the effects of maternal responsiveness would interact with preterm birth such that the brain structure of adolescents born preterm and term would demonstrate more similarities for the groups with high maternal responsiveness as compared to the groups with low maternal responsiveness. However, this prediction was not confirmed. This suggests that the moderating effect of supportive parenting on cognitive development found in our earlier developmental study most likely resulted from structural differences in brain development not examined in this study such as connectivity.
Limitations, Implications, and Future Directions
Our findings need to be tempered due to several limitations of this study. First, we were limited in the number of individuals we could recruit because we recruited from a unique cohort. This limited our ability to perfectly balance gender or examine gender as a variable in our analysis. In addition, the complexity of the statistical analysis was limited due to the restricted sample size. We must also recognize that recruitment of the original cohort was through the parents, in most cases the mothers. This recruitment strategy could have been influenced by maternal characteristics at the time of this study—several years after it was measured.
Future studies should address the dynamics of cortical growth over time to gain a better understanding of how experience throughout early life can influence the dynamic of cortical growth. Such information will certainly help in the understanding of how supportive parenting strategies can influence brain development and which parenting strategies can be recommended to parents, especially for children who are at high risk for cognitive limitations such as those born preterm.
ACKNOWLEDGEMENT
This study was supported by grant NS046565 to Dr. Frye. and HD25128 to Dr. Landry.