

The assessment of vocational potential in personal injury cases is a niche area within rehabilitation practice in Australia. Pryor and Hawkins (Reference Pryor and Hawkins2009) commented that the related assessment practices are complex. Firstly, there is evidence to suggest that vocational potential cannot be determined on the basis of severity of injury alone. For instance, Novack, Bush, Meythaler and Canupp (Reference Novack, Bush, Meythaler and Canupp2001) indicated that early neurocognitive status had a greater effect on outcome than severity in traumatic brain injury. When examining spinal cord injury, Murphy and Young (Reference Murphy and Young2006) reported that even facilitators might be context related (e.g., family, social networks or pre-injury employers). In addition, the inhibitors or facilitators associated with employment are difficult to implement operationally (Lee, Abdullah & May, Reference Lee, Abdullah and Mey2011). Secondly, in most frameworks dealing with the career development of persons with disabilities it has been recognised that a mixture of personal and environmental factors influence vocational potential predisposition (Beveridge, Craddock, Liesener, Stapleton & Hershenson, Reference Beveridge, Craddock, Liesener, Stapleton and Hershenson2002). Personal factors have included age, sex, occupational history or psychological background (Cornes, Reference Cornes1990); environmental factors have included issues such as the physical demands of work or labour market factors (Williams, Dunn, Bast & Giesen, Reference Williams, Dunn, Bast and Giesen2006).
The challenge for practitioners assessing vocational potential is access to instruments that determine earning capacity accurately (see Frank, Rosenthall & Caplan, Reference Frank, Rosenthall and Caplan2010). There are more than 10 evaluation frameworks that are in existence today. These date from the early 1980s and include, amongst others: Labour Market Access Model, McCroskey Vocational Quotient System, Deutsch-Sawyer Model, Boyd-Toppino 12 Factor Functional Model, Cohen-Yankowski Functional Procedure, Dillman Impairment Equation, Toppino-Agrusa Six Factor Model, RAPEL (Rehabilitation, Access, Placeability, Earning Capacity, Labour Force Participation) and its extensions, Le Boeuf Evaluation Process, Leeper Evaluation Methodology, Spitznagel and Cody Methodology, Field's Practical Approach, or Hankin's Three-Step Method (see Robinson, Reference Robinson and Robinson2013). Accordingly, a continuing issue of practical and theoretical importance has been the valid assessment of vocational potential.
Shahnasarian (Reference Shahnasarian2004) sought to conceptualise employability objectively and introduced 14 specific factors for evaluating the earning potential of a person with disability from injury or accident (see Shahnasarian, Reference Shahnasarian2011 for a historical overview). This led to the development of the Earning Capacity Assessment Form-2 (Shahnasarian, Reference Shahnasarian2010). This provides guidelines for determining the impairment to earning capacity along a scale from no loss (0%), through mild (0–19%), moderate (20–49%), severe (50–79%), extremely severe (80–99%) and catastrophic (100%). In order to arrive at a decision, a counsellor is required to apply 16 judgmental heuristics to combinations of the items that constitute the ECAF-2. The purpose of this article is to evaluate the psychometric features of the Earning Capacity Assessment Form-2 (ECAF-2).
The ECAF-2 as a Vocational Potential Measure
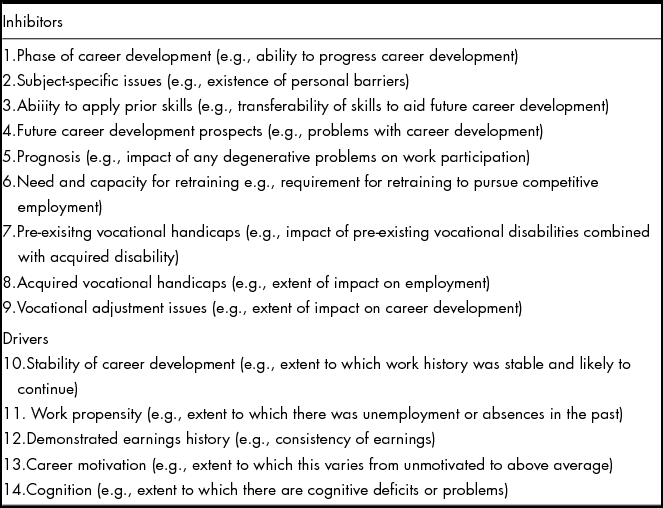
The ECAF-2 is completed following a vocational evaluation. It comprises 14 items that focus on vocational adjustment. The ratings from these items are combined in a number of different ways to obtain the overall impairment to earning capacity.
There are nine inhibitor items of employment in the ECAF-2. These comprise: (a) the phase of career development, (b) subject specific issues, (c) ability to apply prior skills, (d) future career development prospects, (e) prognosis, (f) capacity for retraining, (g) pre-existing vocational handicaps, (h) acquired vocational handicaps, and (i) vocational adjustment issues. In some instances the effects of inhibitors and drivers may be reversed (Shahnasarian, Reference Shahnasarian2010, p. 3).There are also five facilitator items of employment. These are termed drivers and comprise: (j) stability of career development, (k) work propensity, (l) demonstrated earnings history, (m) career motivation and (n) cognition.
The ratings on each of the 14 characteristics range from 0 to 3 and are summarised in Table 1. Only the personal factors that facilitate employment or inhibit a return-to-work are emphasised (Shahnasarian, Reference Shahnasarian2010, p. 2). It is apparent that socio-demographic factors such as age, gender, education or occupation are not included directly, even though the personal factors also follow the World Health Organisation's International Classification of Functioning (see Madden, Fortune, Cheeseman, Mpofu, & Bundy, Reference Madden, Fortune, Cheeseman, Mpofu and Bundy2013).
A description of the ECAF-2 inhibitor and driver work items

Adapted from Shahnasarian Reference Shahnasarian2010, pages 8–13
Athanasou (2013) examined the uses of the ECAF-2 in an Australian context with adults (N = 87) comprising head injuries (n = 11), circulatory conditions (n = 1), psychiatric disabilities (n = 5), musculoskeletal conditions (n = 66), sight loss (n = 1) and unspecified condition (n = 3). This analysis reported that 0% had no loss, 6% were classified as having a mild loss, 51% a moderate loss, 22% a severe loss and 22% were rated as an extremely severe loss. The five driver/facilitator items (10) to (14) listed above did not contribute in a consistent fashion. It was considered that data from other practice jurisdictions would assist to replicate and extend the findings. For this reason, the current study incorporates data from a US cohort and examines the ECAF-2 drivers and inhibitors for their structure using a measurement approach.
Measurement Approach
Facilitators and inhibitors have been considered as factors on a continuum of employability (Shahnasarian, Reference Shahnasarian2004). For example, Fugate, Knicki and Ashforth (Reference Fugate, Kinicki and Ashforth2004) also proposed that employability represents a psycho-social construct and a fundamental research question is whether each of the items (inhibitors or drivers) contributes meaningfully to an underlying, hypothesised latent trait of earning capacity impairment.
Rasch modelling (Bond & Fox, Reference Bond and Fox2007) is suited to investigate the structure of measures that presume a latent trait such as, employability or earning capacity impairment. In brief, Rasch scaling tests the adequacy of each item as a measure of the underlying characteristic that is of interest. Rasch scaling was originally developed for dichotomous items (right-wrong, yes-no) but has been extended to ordered category items such as rating scales or polytomous grading. There are a number of technical advantages in using the Rasch model that include mathematically overcoming the limitations of small samples, adjusting item responses for the characteristics of the sample such as high or low employability, and evaluating the fit of an item to earning capacity impairment (Embretson, Reference Embretson1996; Fox & Jones, Reference Fox and Jones1998; Hambleton, Swaminatham & Rogers, Reference Hambleton, Swaminatham and Rogers1991).
The study applied Rasch modelling scale to ECAF-2, which is an assessment of vocational potential. It proposed that higher levels of earning capacity loss are accompanied by an increased probability of responding positively to an item on the ECAF-2. This is illustrated hypothetically for an item in Figure 1. With Rasch modelling, the probabilities of responding to an item are transformed to a scale of log odd ratios or logits. These become the standard units of measurement. The horizontal axis shows the employment incapacity in terms of logits. The vertical axis indicates the probability of responding to an item for a particular level of ability.
A hypothetical description of the Rasch model linking responses to an item and overall categorisation of employment impairment.
Goals of the study
In this study the Rasch model is used to check the response to an item to see how well it fits the model. Moreover, a Rasch analysis allows the items in an assessment such as the ECAF-2 to be located along a calibrated dimension of employment impairment. It is then possible to determine whether the persons responding to the ECAF-2 are really matched to the items.
These Rasch scores have utility because they are calibrated to take into account the difficulty of the specific items as well as controlling automatically for whatever might be the levels of employment capacity in a group. Thus, findings would point towards a set of validated criteria for vocational potential evaluations than is presently the case in many judgements with other related measures.
Method
Participants
The participants (N = 110) in this study underwent a vocational assessment in relation to the determination of economic loss. The data pool consisted of 85 clients from Australia and 25 from the USA. The sample for the data analysis comprised (55 males, 47 females, 8 not listed). The mean age was 39.4 years (SD = 11.5, N = 100) and they ranged in age from 14 to 62 years. The level of schooling was from grades 6 to 12 with a median around Year 10. Cases came from both rural (29% – all percentages rounded) and city (71%) regions. They included mainly work-related accidents (44%), motor vehicle accidents (35%) and 21% were general liability claims (e.g., medical negligence, public risk). They were evenly divided into those who had dependants and those without any dependants. The entire database without identifying details is available from the author upon request.
Instrument and Procedure
The ECAF-2 was completed following a vocational assessment. The data were collected by two counsellors with just over 51 years’ experience in vocational evaluation between them. Internal consistency reliability of the ECAF-2 in a previous study was 0.82 and the level of inter-rater agreement on items ranged from 57% to 100% (Shahnasarian, Reference Shahnasarian2010, p. 35).
This assessment comprised inter alia a structured 1 ½ hour interview including aspects of educational and physical assessments. Ethical approval for the use of agency data was granted on condition of privacy and confidentiality.
Analysis and Procedure
Analysis of ECAF-2 was undertaken using the Rasch scaling program, Quest (Adams & Khoo, Reference Adams and Khoo1996). The 14 ratings of the ECAF-2 that are scored 0–3 are actually discrete categories and not an interval scale. For this reason a partial credit Rasch analysis for multi-category descriptions is appropriate. The model describes the probability of observing a specific category rating from 0–3 as a function of the impairment to earning capacity of a person and the item difficulty of each inhibitor or facilitator (Aadams & Khoo, Reference Adams and Khoo1996, p. 89).
The fit of the responses to the measurement model is determined on the basis of infit and outfit statistics. These have an expected value of 1 and usually range from 0.75 to 1.3. The infit mean square is a weighted and standardised score residual (i.e., observed minus expected response) whereas the outfit mean square is unweighted and includes every response including outliers. The fit statistics indicate the extent to which the items are located within their unidimensional scale.
Reliability was calculated by a Separability Index (with a value of 1 representing high separability). The separability reliability index is the Rasch analogue to the coefficient alpha. It focuses on whether the ECAF-2 was defined by a distinct hierarchy of items. In this sample separability was barely adequate.
Results
The average overall rating on the ECAF-2 was 17.12 (SD = 5.84) out of a maximum of 42 and for the record the coefficient alpha internal consistency was 0.81. This is entirely consistent with the value of 0.82 reported in the manual for a sample (N = 40 to 64). Table 2 includes the overall statistics for the entire ECAF-2 from the Rasch analysis. Results from the analysis are reported as logit values (also called difficulty).
Statistics relating to the ECAF-2 (N = 110)

1Means and SD refer to the mean and standard deviation of the scores in logits; 2infit means square and outfit mean square (expected range 0.75 to 1.3); 3separatibilty is an index of reliability (the proportion of observed variance that is considered true).
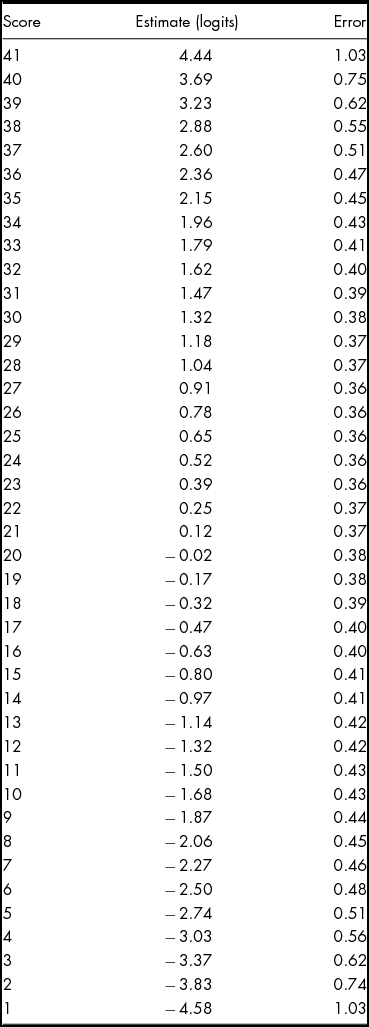
Table 3 provides conversion of the raw scores from the ECAF-2 to estimates of employment capacity impairment. This ranges from 1 (very low impairment) and a Rasch estimate of -4.58 to the maximum ECAF-2 score of 41 (very high impairment) with a Rasch score of 4.44. These Rasch scores provide a standardised conversion and typically vary from around -3 to +3 with a mean of zero. The positive logit values represent persons with a greater level of employment capacity loss. The reader might note that total scores do not have a linear relationship with ability estimates. Rather, the relationship is non-linear (see Figure 2).
Score Equivalence Table (N = 110)
A plot of the non-linear empirical relationship between ECAF-2 raw scores and the Rasch estimates of employment capacity impairment.
ECAF-2 Item Measures
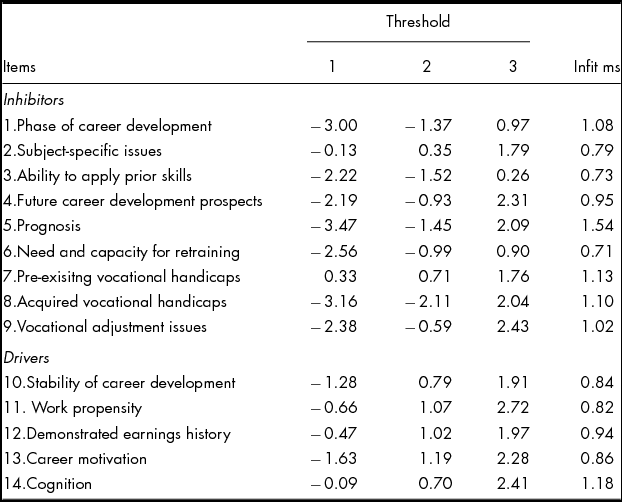
The item statistics are presented in Table 4. Columns 2–4 of Table 4 indicate the logit value of the different points on the ratings scale for each item. One would expect to see an increase in the threshold values in a scale as one proceeds from 0 to 1, then 1 to 2 and from 2 to 3 if the ratings are internally coherent. This was clearly the case but it is also clear that the thresholds on each item have vastly different values and meanings.
Values for items on the ECAF-2
1The partial credit analysis is on the basis of thresholds; there are four ratings 0 to 3 but the threshold 1 is the step in a rating from 0 to 1; threshold 2 is the step from 1 to 2 and threshold 3 is the step from 2 to 3
A category 1, 2 or 3 has different meanings across different items. For instance it did not take a great deal of employment incapacity to be at threshold 3 on Item 6 (i.e., to be unable to apply prior skills) whereas on item 14 (i.e., cognitive problems) and item 8 (i.e., vocational adjustment issues) were related to very high levels of employment incapacity. The ratings on each item were not of similar value.
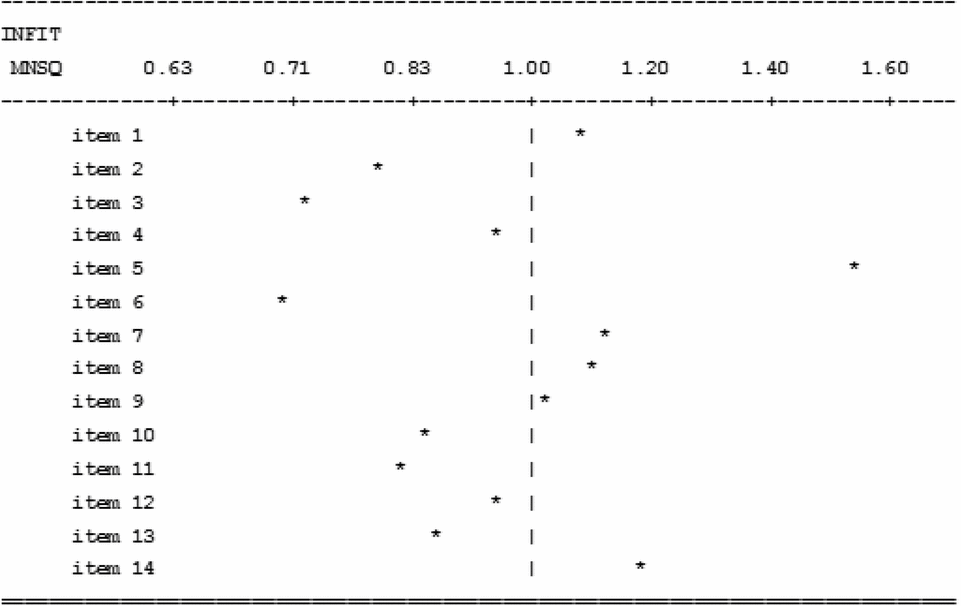
The fit of the items to the theoretical model of earning capacity was tested by reference to the infit mean square values (see column 5 of Table 4). The fit of these items to the measurement model was not satisfactory for Items 3, 5 and 6. The distribution of items by their extent of infit measure is also portrayed in Figure 3 where it is probably easier to visualise.
Distribution of Infit statistics for the items of the ECAF-2.
ECAF-2 Item-ability maps
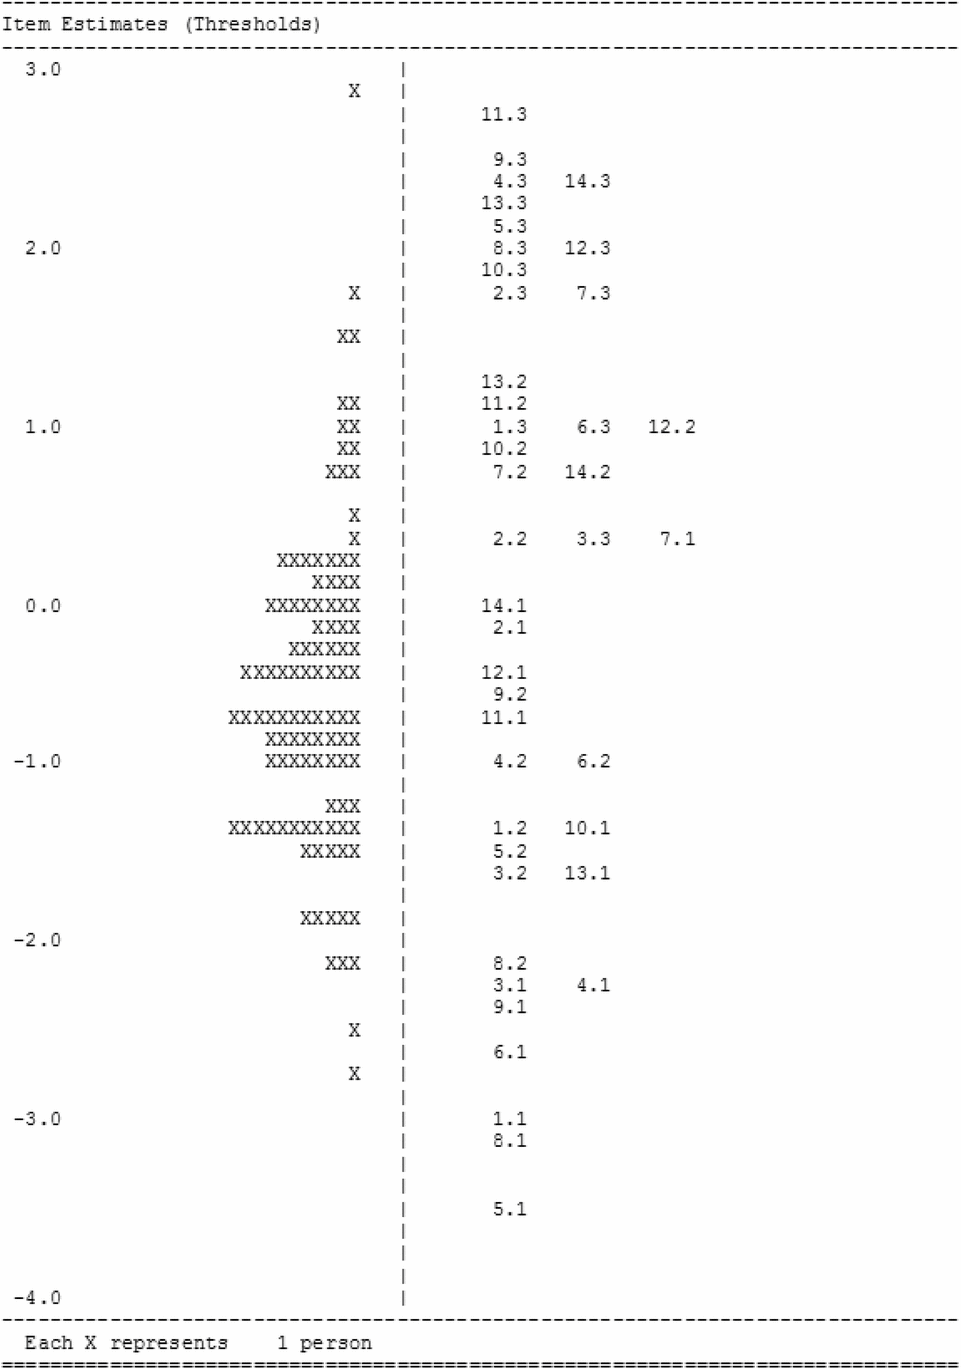
Figure 4 is an item-ability map that sets out the employment capacity and the item responses on the same calibrated scale. The zero value represents the mean of the item difficulties and also the mean level of employment capacity of the group. The figure is described in greater detail below.
Item-ability map for the ECAF-2.
In Figure 4 the numbers on the far left are from –4.0 (very low impairment of earning capacity) to +3.0 (very severe impairment of earning capacity). These are the logit scale values on which the people are calibrated.
Each X in Figure 4 represents a person and the left hand side shows a rotated histogram. The positive logit values represent persons with a greater level of employment capacity loss. In this case it appears as a reasonably normal distribution of people across these calibrated logit values. The upper extremes of incapacity are sparse in Australia because the most catastrophic injuries tend not to be assessed. They are catered for automatically through a lifetime care plan and do not undertake any vocational evaluation because of the universally agreed seriousness of their situation.
The results also present the response categories of each of the items on the right hand side. The positive values represent the “more difficult to endorse” categories on an item. The first number before the decimal point represents the item number and the second number after the decimal point represents the threshold. For instance at the top of the right-hand side, the 11.3 represents the threshold 2–3 on item 11, whereas at the bottom 5.1 represents the threshold 0–1 on item 5.
From these data, it is apparent that it requires a great deal of incapacity to be rated at the threshold 3 on item 11 (i.e., a work propensity with extended periods of absence or unemployment for no apparent reason) whereas it did not require much incapacity to be rated as threshold 1 on item 5. (i.e., prognosis for a person with no appreciative degenerative problems anticipated; and whose future work participation will be unaffected).
A rating of 3 on 10, 8, 12, 5, 13, 4, 14, 9 and 11 was almost certainly indicative of very severe incapacity. At least three items (5, 8, 1) did not overlap with the distribution of the group and were not as helpful in describing impairment, that is, they were generally below the level of earning capacity impairment of this multinational group of people with disability. The placement of people and items on the same scale allowed one to see for the first time just how well the category ratings on the different items matched the range of impairment.
Discussion and Conclusions
The analysis of these responses using a Rasch measurement model provided a means of describing and calibrating categorisations on the ECAF-2. Overall, there was a reasonable fit to the measurement model. For instance the infit mean square centred on 0.98 and was within the range of 0.75 to 1.3. The findings of this preliminary analysis indicate the potential for a standardised assessment of earning incapacity.
At the level of the items, there was a direct, hierarchical relationship between category ratings of 0–3 and the extent of incapacity items. Within each item the categories were ordered correctly and there was no instance where a category was out of place numerically.
Prospectively, particular items and category ratings can now be used to define levels of impairment. For instance, it is proposed tentatively that (a) ratings of 3 on items 10, 8, 12, 5, 13, 4, 14, 9 and 11 indicate a very severe impairment; (b) ratings of 2 on items 13, 11, 12, 10, 7 and 14 and ratings of 3 on items 1 and 6 indicate a severe impairment; (c) moderate impairment is characterised by ratings of 3 on item 3, a rating of 2 on item 2, 9, 4 and 6 and ratings of 1 on items 7, 14, 2, 12 and 11; (d) mild impairment involves ratings of 2 on items 1, 5, 3, and 8 plus ratings of 1 on items 10, 13, 3, 4, 9 and 6. Ratings of 0 (zero) naturally constitute no impairment. These findings may be used to adjust the 16 judgement heuristics for the interpretation of incapacity.
There are practical implications of using a Rasch model in earning capacity assessment. Firstly, it now permits a clearer description of what it means to have a particular level of impairment. This is characterised graphically in Figure 4 where the description of vocational impairment is in direct relation to categorisation on specific items. This may even provide a shortcut for the dozen or more complex judgemental heuristics with over 100 calculations that now form the basis for the ECAF-2. Problems of assessment are likely to occur with low scorers and for this reason the items in the low to moderate range may need further elaboration and calibration.
Strengths and Limitations
The strength of this study is that the Rasch analysis is sample free. It is actually independent of the characteristics of the sample or the difficulty of the facilitator or inhibitor items. This means the item calibration is transportable across samples and settings. It might be worthwhile to note that a practical advantage of the current study is that it involved a sample that was two to three times larger than that cited in the manual for the ECAF-2 (presumably this is the 40–64 that formed the correlation matrix reported in the manual – Shahnasarian, Reference Shahnasarian2010, p. 37).
There are also some theoretical issues that may warrant further attention. It is not clear as Shahnasarian (Reference Shahnasarian2010, Reference Shahnasarian2011) has theorised that (a) there are separate inhibitor and driver effects on employment; or (b) that driver effects may interact with inhibitors and somehow mitigate the effects of any injury. It would appear that what have been characterised as drivers fall along the one dimension and that the absence of a driver is itself a negative. In short it is suggested that (a) vocational impairment capacity can be conceived as essentially unidimensional; (b) different points along the dimension of impairment are characterised by specific factors. Some items were particularly characteristic of the degree of impairment. A program of research is now underway to determine whether a simpler dichotomous categorisation may replace the more cumbersome and subjective 0–3 rating that currently exists in the ECAF-2.
Acknowledgements
I am indebted to my colleague R Brad Coffey of Re-Employment Resources who first suggested a simple summative use of the ECAF-2 in clinical rehabilitation practice and who kindly provided US data. The helpful comments of three referees are also gratefully acknowledged.