Introduction
Steady state creep of materials is most often measured in uniaxial tension or compression experiments and is usually described by the power law relation
 $$\dot{\varepsilon } = \alpha {\sigma ^n}\quad .$$
Here,  $\dot{\varepsilon }$ is the uniaxial steady state strain rate, σ is the creep stress, and α and n are the material parameters characteristic of the creep behavior. Although early efforts to quantify time-dependent creep deformation via indentation methods date back to the 1960s [Reference Atkins, Silverio and Tabor1], significant progress was not achieved until the advent of load and depth sensing indentation techniques, i.e., nanoindentation. The appeal of nanoindentation in the measurement of power-law creep parameters stems from its ability to probe small volumes, thereby reducing the amount of material needed to evaluate properties and allowing for the measurement of very thin films and small particles.
One of the first successes in studying creep by instrumented indentation methods is the work of Chu and Li [Reference Chu and Li2]. Using cylindrical, flat punch indenters with diameters varying from 0.173 to 0.730 mm, these investigators experimentally showed that steady state impression creep (flat punch indentation) of succinonitrile exhibits the same stress dependence as that measured in uniaxial compression [Reference Chu and Li2]. Subsequently, Mayo and Nix used a nanoindentation system equipped with a Berkovich indenter tip (a triangular pyramid) to measure the stress exponents for room temperature creep of lead, tin, and their alloys, verifying that the values of the stress exponent measured by indentation are the same as those in uniaxial experiments [Reference Mayo and Nix3]. Although these results were an important step forward, the stress exponent is only one of the parameters needed to describe steady state creep. To be complete, one must also be able to determine the uniaxial creep coefficient, α, from the indentation data, and this task has proven considerably more complex.
To address this issue, it is often assumed that if steady state creep is achievable under indentation conditions, then it should also exhibit a power law form similar to that of Eq. (1), or
 $${\dot{\varepsilon }_i} = \beta p_{{\rm{nom}}}^n\quad ,$$
where  ${\dot{\varepsilon }_i}$ is the indentation creep rate, p nom is the nominal pressure under the indenter, and β and n are the indentation creep parameters. For a geometrically self-similar indenter like a cone or pyramid, which is the focus of the work here, the indentation creep rate may be written as
 $${\dot{\varepsilon }_i} = {{\dot{h}} / h}\quad ,$$
where h is the nominal displacement of the indenter into the material and  $\dot{h}$ is the rate of this displacement. The pressure, p nom, in Eq. (2) is given by
 $${p_{{\rm{nom}}}} = {P / {{A_{{\rm{nom}}}}}}\quad ,$$
where P is the instantaneous force on the indenter and A nom is the nominal contact area deduced from the known geometry of the indenter (or area function) evaluated at the instantaneous depth of penetration, h. This area is chosen in preference to the real contact area, which would include effects from sink-in or pile-up, because the nominal contact area can be directly determined from the measured indentation depth, whereas the actual contact area cannot.
A detailed contact mechanics analysis of this problem by Bower et al. [Reference Bower, Fleck, Needleman and Ogbonna4] showed that the creep exponent measured by indentation methods via Eq. (2) should indeed be the same as that measured in uniaxial experiments [Eq. (1)] provided the material creeps in a strictly power-law fashion with no transient behavior. Moreover, Bower’s analysis, in conjunction with an experimental study of indentation creep of amorphous selenium by Su et al. [Reference Su, Herbert, Sohn, LaManna, Oliver and Pharr5], showed that for a conical indenter of half-included angle, θ, the uniaxial creep coefficient, α, can be determined from indentation measurements of the parameter β through the following relation:
 $$\propto = {{\beta {F^n}{c^{2n - 1}}} / {\tan \theta }}\quad .$$
In this expression, F is a nondimensional parameter referred to as the “reduced contact pressure,” and c is the pile-up/sink-in parameter defined as c = h c/h, where h c is the depth along which contact is made with the indenter and h is the indenter penetration depth. For pile-up, c > 1 while for sink-in, c < 1. A detailed analysis [Reference Bower, Fleck, Needleman and Ogbonna4] showed that for a pure power-law creeping material, both F and c are unique functions of n and θ, with finite element methods providing specific numeric values [Reference Bower, Fleck, Needleman and Ogbonna4, Reference Su, Herbert, Sohn, LaManna, Oliver and Pharr5].
Using Bower’s analysis [Reference Bower, Fleck, Needleman and Ogbonna4], Su et al. successfully evaluated experimental nanoindentation data for amorphous selenium (n ≅ 1) crept at 35 °C and found that the values of α and n could be accurately deduced from the indentation load–displacement–time data using a variety of different indentation creep methods [Reference Su, Herbert, Sohn, LaManna, Oliver and Pharr5]. However, when used by Lucas and Oliver to examine their indentation creep data for high-purity indium (n ≅ 7), the methodology was far less successful [Reference Lucas and Oliver6]. It should be noted, however, there is some uncertainty in the interpretation of the indium data due to the fact that the indentation and uniaxial data were taken by two different groups at two different times using two different source materials with possibly important differences in microstructure and impurity contents. However, this inconsistency raises the question of how well Bower’s theoretical analysis describes indentation creep. Also, all of the aforementioned nanoindentation experiments were conducted in materials that creep near room temperature in order to avoid complications caused by thermal drift that can dramatically distort experimental data. This leaves open the question of whether or not instrumental issues can be overcome to conduct tests at elevated temperatures, where creep becomes relevant in most engineering materials.
To this end, a new nanoindentation creep data set is presented here for the solid-acid material CsHSO4 crept at 145–160 °C in a new high-temperature nanoindentation system. CsHSO4 is a model material for superprotonic solid-acids which are of interest for intermediate temperature fuel cell technology [Reference Haile, Boysen, Chisholm and Merle7]. The new nanoindentation results are compared with previously published uniaxial compression creep results obtained on exactly the same material [Reference Ginder and Pharr8] in order to assess the utility of Bower’s analysis in deducing uniaxial creep parameters from nanoindentation data.
Results
Constant indentation strain rate creep tests were performed at 145, 150, and 160 °C to minimize CsHSO4 dehydration during testing while still being distinctly above the superprotonic transition temperature of 141 °C [Reference Baranov, Shuvalov and Shchagina9]. At each temperature, tests were conducted using  ${{\dot{P}} / P}$ values of 0.200, 0.020, and 0.002 s−1. Figure 1 shows the data collected for the 3 indents performed at 145 °C and a
 ${{\dot{P}} / P}$ of 0.2 s−1 to illustrate typical material behavior and experimental scatter observed during testing. When a test is initiated, the nanoindenter requires finite time to achieve the input constant
 ${{\dot{P}} / P}$ needed for imposing constant strain rate (CSR). As Fig. 1(a) shows, the constant
 ${{\dot{P}} / P}$ was achieved by ∼1 μm of depth into each test. Once CSR was achieved, the material would begin to trend towards a common steady state as illustrated by the converging of load on sample in Fig. 1(b) to a common value at a given depth in the late stages of the tests. The resulting load–displacement–time data collected from each indent were then converted into corresponding imposed constant indentation strain rates
 ${{\dot{h}} / h}$, shown in Fig. 1(c), and resulting nominal indentation pressures (or hardness) p nom, shown in Fig. 1(d). Because p nom and
 ${{\dot{h}} / h}$ become constant during the latter part of testing, the measured values for stress and strain rates are representative of steady state creep deformation conditions.
Nanoindentation CSR testing results for CsHSO4 at 145 °C and  ${{\dot{P}} / P} = 0.200\;{{\rm{s}}^{ - 1}}$. (a)
 ${{\dot{P}} / P}$ imposed during the test loading segment. (b) Loading curves recorded from the imposed
 ${{\dot{P}} / P}$. (c) Calculated imposed indentation strain rate
 ${{\dot{h}} / h}$. (d) Calculated nominal indenter pressure p nom. The three curves in each plot are the results of the 3 separate tests conducted at the stated condition, showing typical experimental behavior and scatter.

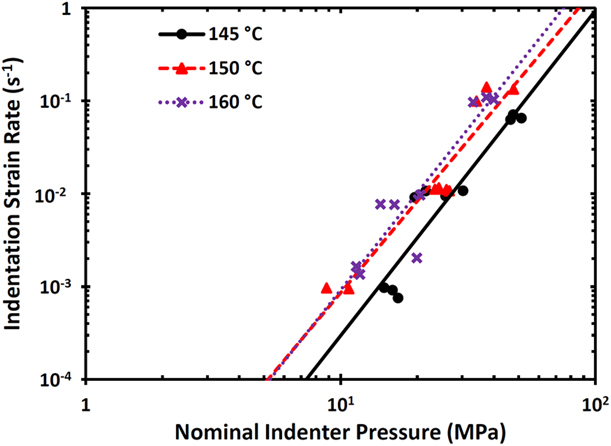
To determine numerical values for power-law creep fitting,  ${{\dot{h}} / h}$ and p nom were averaged over the last micrometer of depth for each test, and these values were then used to generate a log–log plot of the stress dependence, as shown in Fig. 2. The values of the stress exponent n and the indentation creep coefficient, β, extracted from these measurements [see Eq. (2)] are summarized in Table I, where it is apparent that the stress exponent for CsHSO4 is in the range of 3.3–3.5. From the measured stress exponents, the values of the reduced contact pressure, F, and the pile-up/sink-in parameter, c, were determined for an indenter angle θ = 70.3° (this is the conical indenter equivalent of the Berkovich indenter used in the experiments) using the Bower fitted relations approach like Su et al. [Reference Su, Herbert, Sohn, LaManna, Oliver and Pharr5], and the uniaxial creep coefficient, α, was determined using Eq. (5). All these parameters are included in the Table I.
Nominal indenter pressures plotted as a function of imposed constant indentation strain rates at the 3 temperatures tested in the superprotonic phase; when fitted to a power-law function, a steady state creep deformation regime was attained during testing.


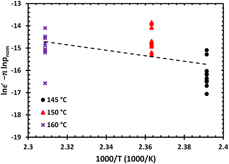
The temperature dependence of the indentation creep rate is examined by assuming that β(T) = β′ exp(−Q/RT) and rewriting Eq. (2) as the following:
 $${\dot{\varepsilon }_i} = \beta '\exp \left( {{{ - Q} / {RT}}} \right){p_{{\rm{nom}}}}^n\quad ,$$
where Q is the activation energy for creep, R is the gas constant, and T is the absolute temperature. In this case, a plot of  $\left( {\ln \;{{\dot{\varepsilon }}_i} - n\;\ln {p_{{\rm{nom}}}}} \right)$ versus 1/T should be linear with a slope of −Q/R. The data from the indentation creep tests are plotted in this fashion in Fig. 3. Although the data are somewhat scattered, a linear regression indicates a creep activation energy of Q ≅ 1 ± 0.5 eV.
Temperature dependence of steady state indentation creep regime. As the indentation tests were conducted at CSRs, the Y axis is constructed to compare correlation between imposed test temperature and strain rate with measured output indentation pressure.

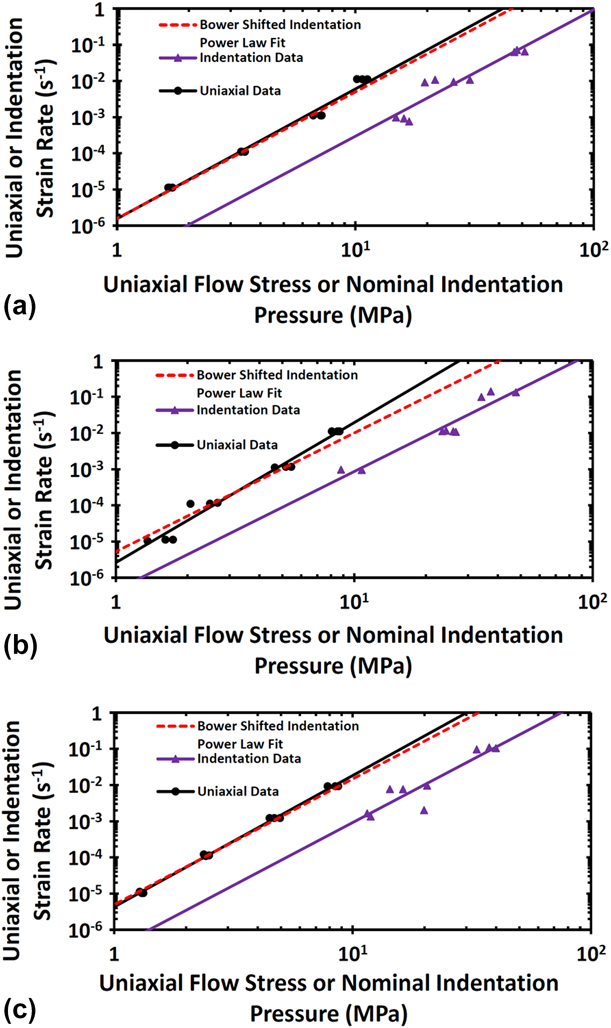
In order to compare the indentation creep results to those obtained in uniaxial compression [Reference Ginder and Pharr8], the indentation strain rates and contact pressures measured here are compared against previously published uniaxial creep test results by plotting both sets in Fig. 4 as a function of either the nominal indentation pressure for the indentation data or the uniaxial compression stress for the uniaxial data at each of the 3 temperatures tested. The experimental data are shown as individual data points, whereas the lines represent various fits to said points. The solid lines are the linear regressions of the indentation and uniaxial creep data, while the dashed line is a prediction of the uniaxial behavior based on the indentation measurements and a conversion of the measured β to α by the Bower model as described by Eq. (5), i.e., the “Bower shift.” The plots clearly indicate that at all three test temperatures, the Bower analysis provides an accurate description of the relationship between the indentation and uniaxial data. We also note that the activation energy for creep observed in the uniaxial tests, Q = 1.02 eV [Reference Ginder and Pharr8], closely matches the indentation derived value.
Plots of uniaxial [from 8] and nanoindentation steady state creep measurements in CsHSO4 with power-law fitted curves and compared using the Bower shifted indentation power law fit. (a) 145 °C testing results, (b) 150 °C testing results, and (c) 160 °C testing results.

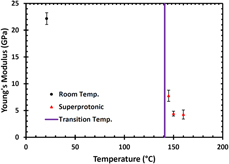
The temperature dependence of Young’s modulus of CsHSO4 as determined by the continuous stiffness measurement technique is shown in Fig. 5. The values shown in this plot were determined from the largest contact depths (about 10 μm) assuming a Poisson’s ratio of 0.3. The data indicate that the modulus of the superprotonic phase (T > 141 °C) is substantially lower than that at room temperature. In addition to the accelerated creep behavior, this reduction in modulus could be important in fuel cell design where compressive stresses are often applied to the electrolyte to seal the devices.
Average Young’s modulus of CsHSO4 as a function of temperature assuming a Poisson’s ratio of 0.3. Error bars represent one standard deviation from the average modulus.

Discussion
The nanoindentation results presented here confirm that CsHSO4 becomes a significantly weaker material after being heated through its superprotonic transition. In addition to the large drop in Young’s modulus, nanoindentation testing revealed the existence of substantial steady state creep rates in superprotonic CsHSO4. Mechanically speaking, CsHSO4 appears to switch from behaving like a normal salt at room temperature to exhibiting soft-metal like behavior after reaching the superprotonic phase. In addition, the nanoindentation measured stress exponent, n ≅ 3.5, and creep activation energy, Q ≅ 1 eV, closely match the previously measured uniaxial compression values of n ≅ 3.6 and Q ≅ 1.02 eV.
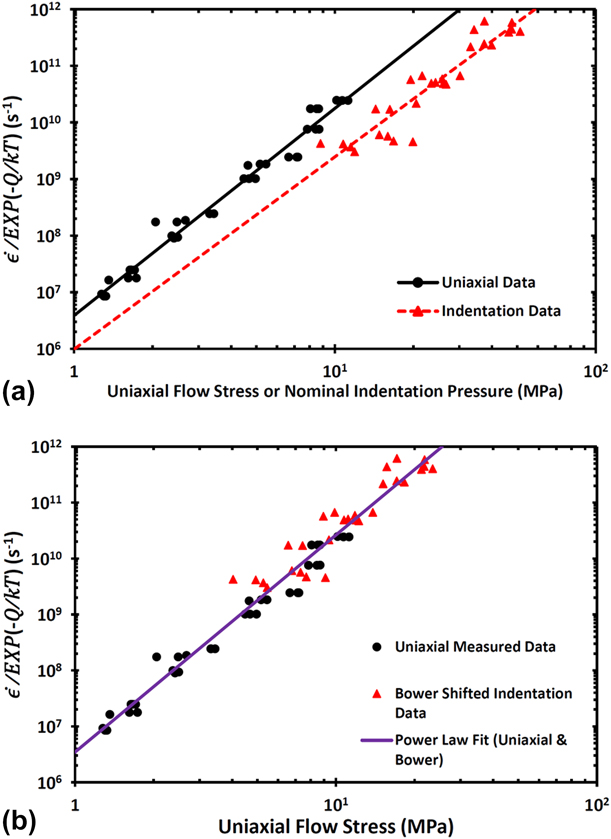
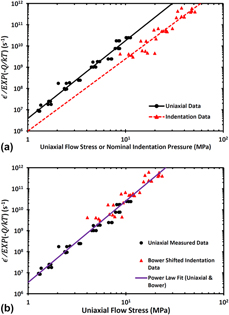
In Fig. 6(a), we have normalized the strain rates by the creep activation energy to show that both the uniaxial and nanoindentation data each fall onto their own master creep curves. This suggests that both uniaxial and nanoindentation tests reveal a single, thermally activated creep mechanism controlling the deformation of the superprotonic phase. The temperature compensated nanoindentation data can be further modified using Bower’s analysis to predict the uniaxial behavior, as illustrated in Fig. 6(b). This results in nanoindentation and uniaxial data lying on the same master creep curve, demonstrating the validity of Bower’s analysis for this material with stress exponent, n ≅ 3.5. It also shows that the challenges of elevated temperature nanoindentation can be overcome by both achieving good thermal stability in the tip and specimen and that load and depth sensing indentation techniques can indeed be used effectively to evaluate uniaxial creep properties.
Comparison plot of uniaxial [from 8] and nanoindentation measured, temperature compensated power law creep in CsHSO4. (a) Indentation hardness compared with uniaxial flow stress. (b) Bower predicted flow stresses combined with true uniaxial measurements.

To the authors’ knowledge, insufficient data exists regarding microstructural defects in CsHSO4 for the measured steady state creep parameters herein to be correlated with an exact deformation mechanism. That said, enough information is available for informed speculation into what may be underlying the observed mechanical behavior. CsHSO4, as previously mentioned, belongs to a class of materials known as solid-acids. Solid-acids consist of a primary salt-like cation–anion primary lattice with ordered hydrogen bond sublattices interwoven through the primary structure. When heated, most solid-acids simply melt or decompose; however, a select few consisting of larger ion species, like Cs, have their hydrogen bond sublattices “melt” before the primary ionic lattice does. It is this hydrogen bond network disordering that gives rise to the dramatic increase in proton conductivity observed in CsHSO4’s elevated temperature state. Accompanying this hydrogen bond disordering is also a transition in unit cell symmetry from monoclinic to tetragonal [Reference Chisholm10].
It is likely these two factors play a key role in the significant decrease in Young’s modulus from room temperature to the superprotonic phase. It is also likely these two factors are connected with the dramatic climb in creep rates of superprotonic CsHSO4 over its lower temperature phases. Traditionally n ≅ 3.5, as measured here, is associated with creep via dislocations assisted by diffusion. While self-diffusion activation energies for the superprotonic phase appear unknown, diffusional activation energies for some species just below the transition temperature have been measured in deuterated CsHSO4. The results of Dolinsek et al. indicate that, at 120 °C, hydrogen has a self-diffusion energy of 0.70 ± 0.03 eV and cesium has a self-diffusion energy of 0.60 ± 0.02 eV [Reference Dolinsek, Blinc, Novak and Shuvalov11]. This would suggest the measured indentation Q ≅ 1 eV is not out of range of being consistent with a diffusional-based mechanism. However, significant microstructural characterization beyond the scope of this work would be required to verify this hypothesis and positively identify the rate limiting species.
Summary and conclusions
CsHSO4, a material of interest to the fuel cell community, was used to generate new, elevated temperature nanoindentation creep data for comparison to uniaxial compression creep tests conducted on exactly the same material. Comparison of the nanoindentation and uniaxial compression measured results yields the following conclusions:
(1) The nanoindentation measured stress exponent of n ≅ 3.5 and creep activation energy of Q ≅ 1 ± 0.5 eV closely agree with their uniaxial compression measured counterparts, n ≅ 3.6 and Q ≅ 1.02 eV. It thus appears that the uniaxial creep behavior of materials can be successfully measured by nanoindentation methods.
(2) The analysis of Bower et al. [Reference Bower, Fleck, Needleman and Ogbonna4] successfully relates the nanoindentation creep data to the uniaxial steady state creep behavior.
(3) When heating CsHSO4 from room temperature to its superprotonic phase (T > 141 °C), Young’s modulus drops significantly, suggesting that, in addition to the rapid creep deformation of this material, special consideration of elastic deformation may be also important in fuel cell design.
Methods
CsHSO4 nanoindentation specimen fabrication
To produce CsHSO4 for nanoindentation experiments, cesium carbonate was reacted with sulfuric acid and precipitated using methanol. The resulting CsHSO4 precipitate was dried and ground to produce a fine powder. Full details of the powder synthesis and drying process have been published elsewhere [Reference Ginder and Pharr8]. The CsHSO4 powder was uniaxially pressed at room temperature in a cylindrical compression die for 5 min at a pressure of 472 MPa to yield disc specimens of 6 mm in diameter and 2.8 mm thick. At a theoretical density of 3.34 g/mL, these dimensions indicate sample densities in the range of 96–99% of theoretical [Reference Chisholm10, Reference Itoh, Ozaki and Nakamura12]. The sample surfaces were ground by hand using SiC grinding papers of successive grits P1500, P2500, and P4000 (MicroCut paper from Buehler). A very light, fine grinding with 0.3 μm alumina abrasive discs (FiberMet discs from Buehler, Lake Bluff, Illinois) was then applied before polishing on a vibratory polisher using a slurry of 0.05 μm alumina powder (MicroPolish from Buehler) and high-purity mineral oil. Between each grinding step, and after at least 24 h on the vibratory polisher, the specimens were sonicated for 5 min in anhydrous toluene and dried with nitrogen. The polished specimens were then mounted for testing and annealed overnight at 110 °C.
Nanoindentation methodology
All elevated temperature nanoindentation experiments were performed using a new, prototype high-temperature nanoindenter under development at Nanomechanics, Inc. (Oak Ridge, Tennessee). The indenter operates in a vacuum chamber that was sealed and pumped down to approximately 10−6 torr for testing. Both the CsHSO4 samples and diamond Berkovich indenter tip were independently heated to the desired testing temperature and maintained to ±0.1 °C. To avoid the slow dehydration of superprotonic CsHSO4, samples were discarded and replaced after a maximum of 5 h at temperature. The 5-h time period was established based on weight loss measurements with time at temperature [Reference Kislitsyn13].
All creep experiments conducted in this study used the well-established CSR method [Reference Lucas and Oliver6]. In this method, the loading rate,  $\dot{P}$, during testing is adjusted continuously to keep
 $\dot{P}$ divided by the current load, P, constant. Because
 ${{\dot{P}} / P}$ is undefined at the start of such a test, a small constant
 $\dot{P}$ was initially imposed until the desired
 ${{\dot{P}} / P}$ was achieved.
 $\dot{P}$ was then continuously altered to keep
 ${{\dot{P}} / P}$ constant until the test terminated at an indenter penetration depth of 10 μm. Keeping
 ${{\dot{P}} / P}$ constant produces a constant indentation strain rate,
 ${{\dot{h}} / h}$, provided that the material is homogenous and the hardness is not a function of depth [Reference Lucas and Oliver6]. Steady state deformation is achieved when the nominal indentation pressure, p nom, driving the imposed
 ${{\dot{h}} / h}$ also becomes constant. During the loading segment, the continuous stiffness measurement method was used to provide an estimate of Young’s modulus [Reference Oliver and Pharr14].
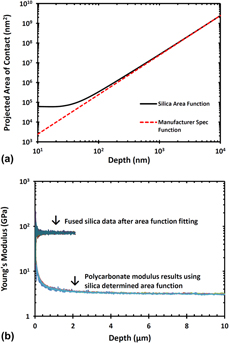
An area function for the Berkovich indenter tip was determined by indenting the reference material fused silica and back calculating the tip’s projected contact area as is standard for nanoindentation. However, because the fused silica indents used for area function fitting only reached depths of about 2 μm, further validation of this area function out to 10 μm was required. This was achieved by subjecting the fused silica area function to two comparison tests. First, the silica function was plotted against the tip manufacturer reported area function, measured by angular deflection of laser light directed down the indenter z axis. While at small penetration depths these two functions will differ due to tip rounding effects captured in the silica function, at the large depths encountered during creep testing, such tip effects become negligible necessitating the convergence of the two functions. As shown in Fig. 7(a), the silica fitted function smoothly converged to the manufacturer measured laser function at large depths. For the second comparison test, the indenter tip was used to probe the Young’s modulus of a polycarbonate reference sample, which as a softer material would allow for indents to be made out to 10 μm depths. Figure 7(b) shows that, when the silica area function and an assumed Poisson’s ratio of ν = 0.3 are applied to the polycarbonate results, the measured Young’s modulus approaches the expected bulk value of E ≈ 3 GPa over the 2 μm where the silica area function is known to be valid. The experimental polycarbonate Young’s modulus then remains constant over the additional 2–10 μm depth range. This consistency indicates that the silica fitted area function correctly describes the true area function of the indenter tip out to 10 μm depths, as any variation in the true area of the tip would yield deviations in the measured data from the expected bulk Young’s modulus.
Comparison tests validation of fused silica measured Berkovich tip area function. (a) Silica fitted function versus that reported by the tip manufacturer, measured via angular deflection of laser light shone down the indenter z axis. As the silica measured area function can account for tip rounding defects that the light-based approach cannot, the two functions should deviate at small depths but converge at greater depths where such defects no longer significantly contribute to the indentation contact area. (b) The fused silica area function was only fitted to data covering 2 μm of indenter penetration; however, the constant, accurate Young’s modulus measured in polycarbonate indicates this function is valid to at least 10 μm depths.

Because the goal of the experiments was to measure bulk properties, it was important to verify that the small volume sampled by the indenter was representative of the grain structure of the specimen. No established method for etching CsHSO4 could be found, so several different suggestions in the literature for etching other related materials were attempted. Of these, etching in a microemulsion of water, Triton X-100, and dodecanol produced the best results [Reference Wang, Li and Gao15]. The etched specimen in Fig. 8 shows that the grain structure of the material is roughly equiaxed and fairly uniform. The white triangle in the figure illustrates the approximate size of an indentation at the maximum penetration depth of 10 μm, indicating that many grains are sampled at this depth.
Micrograph of an etched CsHSO4 specimen showing the grain structure of the test specimens. The translucent triangle at the center of the image shows the size of a Berkovich indenter imprint after being driven 10 μm into the surface. This image confirms that multiple grains are sampled during nanoindentation testing.

Acknowledgments
This work was supported by the U.S. Department of Defense (DoD) through the National Defense Science & Engineering Graduate Fellowship (NDSEG) Program (RSG) and by the National Science Foundation through Grant No. DMR-174343 (GMP). The authors offer special thanks to Dr. Alex Papandrew and Dr. David Wilson for help with CsHSO4 synthesis, and to Nanomechanics, Inc. for assistance with the nanoindentation experiments.