Introduction
Pulsed electric current sintering (PECS) as developed in the Dr. Sinter™ apparatus (Dr. Sinter™ SPS-515S made by Fuji Electronic Industrial Co. 6-2-22 Fujimi Tsurugashima, Saitama 350-2201, Japan.) has demonstrated faster and higher compaction of sintered specimens compared with the hot press technique. In part, this improvement is due to pulsed current flow through the specimen providing in-specimen Joule heating and also to what has been called spark plasma sintering (SPS). However, SPS in the Dr. Sinter™ has been demonstrated[ Reference Hulbert, Anders, Dudina, Anderson, Jiang, Unuvar, Anselmi-Tamburini, Lavernia and Mukherjee 1 , Reference Hitchcock, Livingston and Liebenberg 2 ] to exhibit neither sparks nor plasma. In Ref. Reference Hitchcock, Livingston and Liebenberg2 the electromagnetic emission at radio frequencies (rf) of 10 to 160 kHz was observed and suggested to be an additional difference to the hot press sintering technique. These two techniques are generally applicable to smaller specimens and microwave sintering has been developed for heating and sintering with electromagnetic radiation at tHz frequencies for larger samples.[ Reference Lefeuvre, Fedorova, Gomonova and Tao 3 ] Thus PECS represents an intermediate step between hot pressing and microwave sintering. This report extends the rf emission frequency measurement to above 600 kHz although the peak in the emission is 12 kHz or lower. To examine the influence of the electromagnetic radiation on the sintering process a technique is presented to limit the current through the specimen while providing the electromagnetic radiation to envelop the specimen. The electromagnetic radiation importance to the PECS process is demonstrated.
RF spectrum analysis
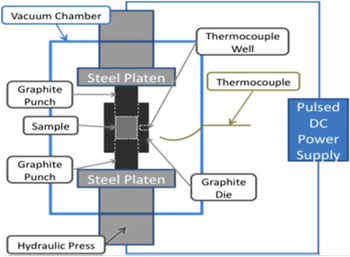
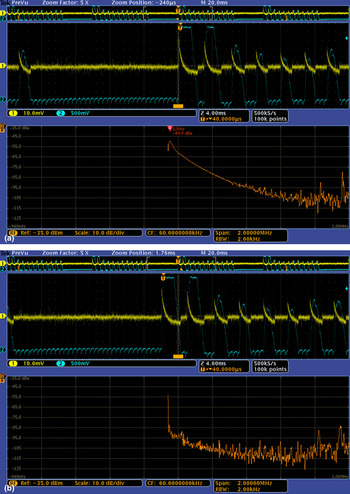
The MDO 4104 B-6 Tektronix (The Tektronix MDO4104B-6 instrument permits four individual voltage inputs to the oscilloscope and a separate input for the rf signal captured during the same measurement. The power of the rf signal in dBM has a value P = 10E(dBM/10) mW.)[ Reference Hitchcock, Livingston and Liebenberg 2 ] spectrum analyzer was used together with the thermocouple antenna (TCa) (The thermocouple antenna was previously demonstrated (see Ref. Reference Hulbert, Anders, Dudina, Anderson, Jiang, Unuvar, Anselmi-Tamburini, Lavernia and Mukherjee1) to detect sparks from a small arc welder. The TCa was used outside the vacuum to detect FM radio signals to 100 MHz including measurement to 1 GHz with the Tektronix MDO4104B-6 instrument.) located inside the Dr. Sinter™ vacuum chamber and external to the die as seen in Fig. 1. The frequency range was expanded from the 10 kHz lower limit of the analyzer to 2 MHz. Figure 2(a) (lower panel) shows the signal fades into noise at about 400–650 kHz. An additional measurement was made with the TCa probe inserted through the die into the specimen of Al2O3 and compared with the signal external to the die. A peak signal increase of ~15 dBm from −50 dBM was measured corresponding to 3.2 µW.
Dr. Sinter™ specimen chamber is shown. The thermocouple (TC) is located in the vacuum chamber and for die temperature measurements the TC is placed in a hole in the die. When the TC is used as the antenna (TCa) for the spectrum analyzer it is located external to the die in the vacuum as illustrated. The pulsed DC power supply is part of the Dr. Sinter™ electronics.

(A) Top screen. Upper panel; the Hall voltage (blue or lower trace) and the TC antenna (yellow or upper trace) are displayed. Brackets (orange) select the region from the upper panel to display in the middle panel where the Hall voltage and TCa values are expanded. The bar (orange or at the bottom of the middle panel) selects the region for the rf signal capture shown in the lower panel. The lower panel displays the rf emission versus frequency as captured by the TCa. The lower frequency of 10 kHz has been shifted to near the center. The peak maximum at 12 kHz has a power level of 49.9 dBM or 10 nW (The Tektronix MDO4104B-6 instrument permits four individual voltage inputs to the oscilloscope and a separate input for the rf signal captured during the same measurement. The power of the rf signal in dBM has a value P = 10E(dBM/10) mW.) (B) Bottom screen. Colors and traces are as shown in A. The bar (orange or at the bottom of the middle panel) is shifted to include the pulse peak and initial shut off of the PECS current. In the lower panel the peak at about 12 kHz shows a drop of 45 dBm from the peak in (a).

An improved measurement of the current pulse was obtained using a Hall probe (CPCO-500 BP-10 Hall current probe by GMW Assoc. San Carlos, CA has an output of 16 mV/A. The response time is stated to be less than 10 µs.) clamp around the current leads into the vacuum chamber. The output voltage is related to the current by the manufacture's calibration. Thus, the lower or blue curves (Fig. 2(a)) in the upper and middle panels are the Hall probe voltage independently and simultaneously recorded and compared with the TCa pulses shown as the upper curve or yellow. The Hall probe provides capture at <10 µs and the rise time in the selected region (orange bar in the middle panel of Fig. 2(a)) can be sampled with the TCa to capture the frequency spectrum in this pulse region of onset of the current pulse and peak (lower panel curve or orange of Fig. 2(a)). The TCa measured peak rf emission at 12 kHz is −49.9 dBM or 10 nW. Figure 2(b) shows the spectrum obtained during the pulse peak and initial turn off region (orange bar) and the rf spectrum signal from the TCa is reduced from 10 nW to 0.3 pW at the peak frequency of 12 kHz. This is consistent with the earlier measurements with the TCa indicating a maximum response during the pulse rise (yellow curve) in the upper and middle panels of Fig. 2(a). The rf electromagnetic emission is primarily from the driven (accelerated) current during the pulse rise.
RF emission importance in sintering
Normal operation of the PECS process
In the normal operation of the Dr. Sinter™ the current flows through the specimen and the electromagnetic wave rf emission occurs within the specimen and the punch and die. This is different from hot press sintering where thermal heating is conducted and/or radiated to the specimen. In PECS there is also thermal radiative and conductive heating from the surrounding punch and die that contributes at higher temperatures. As determined above and shown in Figs. 2(a) and 2(b), rf emission occurs predominantly in the initial rise of each current-on pulse. Much lower rf emission is measured during the pulse peak and decay.
Modification of the PECS process to demonstrate the importance of rf emission
In order to differentiate the electromagnetic wave rf emission importance in the PECS process pre-sintered disks of the electrical insulator Al2O3 (300 mesh Alfa Aesar) were separately sintered to temperatures of <1000 °C and installed above and below the selected material specimen. These disks with the 12 mm diameter of the punch and thickness each of 3 mm, restrict the current flow through the specimen and thus restrict both the internal rf emission and Joule heating. However, the electromagnetic wave rf emission from the pulsed current in the die envelops the specimen enhancing the proportion of energy to the specimen from the rf emission. Thermal and radiative heating from the die will also transmit to the specimen.
Nickel (Ni) and manganese (Mn) were selected for the specimen materials. The sintered disks had a thickness of about 6 mm. These materials, Mn (325 mesh 99.99% Alfa Aesar) and Ni (100 mesh 99.9% Alfa Aesar), form an interesting pair as seen from properties listed in Table I. The Mn has a higher electrical resistance and lower thermal conductivity than Ni, in each parameter by more than an order of magnitude. The melting temperatures are high in both materials and the molar specific heats are similar. Also the Al2O3 disks have a very high electrical resistance and an intermediate thermal conductivity to Mn and Ni.
Properties of the specimens used including graphite properties of the punch and die from Lide.[ Reference Lide 4 ]

The temperature is measured with a thermocouple (TC) inserted into the die. A temperature-in-the-die versus time profile was chosen, after trials, to provide for a long sequence (12/2 pulse on/off) of pulses at a low current (100 A) of the Dr. Sinter™ and to provide a short current increase to 300 A to produce a temperature well below the normal sintering temperatures and the melting temperatures of these specimens. An additional 10 min at 100 A current followed. A low force on the specimen, 49 MPa (setting of 6 on Dr. Sinter™), was used to further delineate the effect of the rf emission on the densification process.
Results
Relative importance of rf emission by limiting Joule heating in the specimen
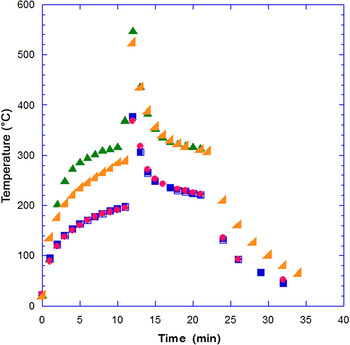
An example of two runs for Ni (2.5 gm) without the Al2O3 electrically insulating disks is shown in Fig. 3 as red and blue or dots and squares where the initial current is 100 A set for 10 min, then a current of 300 A is set for 1 min, and a current of 100 A is set for an additional 10 min. Comparison of the two temperature profiles measured with the TC in the die shows the uniformity of the two runs. The maximum temperature is well below the melting and normal sintering temperatures. Current flow and rf emission occurs in the specimen and the punch and die.
The die temperature versus time is shown for the current versus time profile (10 min @ 100 A, 1 min @ 300 A, 10 min @ 100 A, cool in vacuum @ 0.0 A) for two nickel specimens (2.5 gm each, 150 mesh fine powder, 99.96% pure) with no disks. These two runs are shown as red and blue or dots and squares. Two Ni specimens isolated with Al2O3 disks top and bottom of the specimens are subjected to the same current versus time profile. These two runs are shown as green and orange or vertical and tilted triangles.

With the Al2O3 (~0.5 gm each) electrically insulating disks in place and a Ni specimen of similar size as in the no-disk case, two nickel runs with disks, orange and green or triangle or tilted triangle are compared (Fig. 3). These disks isolate the same size specimen from direct pulsed current flow through the specimen. Thus there is no Joule heating or rf emission generated in the specimen. The rf emission is only generated from the pulsed current flow in the punch and die and radiates into the specimen. There will be thermal conduction and radiant heat transfer from the pulsed current heating of the die. The temperature is measured in the die. The area of the die compared with that of the punch is 1.33 so that reducing the current flow through the specimen will divert current flow through the die and thus cause a faster and higher temperature rise recorded by the TC in the die. The greater temperature rise in the die when the current through the specimen is blocked is clearly seen in Fig. 3. A temperature rise after 10 min results in a >100 °C increase for the disk blocked current through the specimen compared with the specimen only experiment. And after the 1 min at 300 A current the difference between the experiments with and without disks is further increased by about 150 °C. Some variation of the temperature versus time profiles for the two runs with Al2O3 disks is likely due to variations in Al2O3 disk sintering.
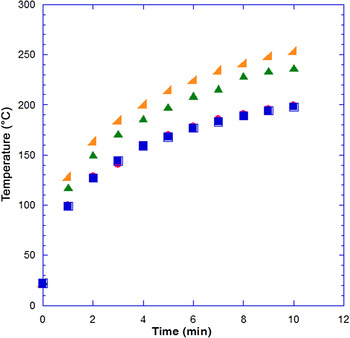
For the Mn (2.0 gm) specimens similar results are obtained. The temperature measured in the die increases more rapidly when the current path through the specimen is blocked by the electrically insulating Al2O3 disks as shown in Fig. 4. The temperature rise difference at the end of the 10 min pulsing at 100 A is about 50 °C between the disks and no disks case. The smaller temperature difference indicates that more energy is going into the Mn compared with the larger temperature rise for the Ni specimen. This comparison supports the case for greater rf emission heating in the Mn.
The die temperature versus time for four manganese specimens (2.0 gm each, 325 mesh, 99.99% pure), two specimens without Al2O3 disks, are shown as red and blue or dots and squares, and two specimens with Al2O3 disks, top and bottom of the specimen, shown as green and orange or vertical and tilted triangles. The current versus time profile (as described in Fig. 3) is shown for the first 10 min pulsing on the expanded scale.

Both the Ni and Mn specimens with no disks have a temperature rise at the end of 10 min that is similar, about 200 °C. The temperature rise in the die for Ni with disks after the 10 min current of 100 A is about 100 °C or twice that in Mn with disks (about 50 °C) and indicates that there is some shielding of the radiated rf emission by Ni due to its lower resistivity. The higher thermal conductivity of Ni and the Al2O3 disks might be expected to reduce the die temperature due to thermal heat conduction compared with the Mn (of lower thermal conductivity) with disks but the rf shielding by Ni appears more important.
Specimen density comparison
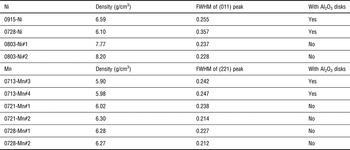
Comparison of the densification produced by the radiated rf emission for disks in place with the normal (without disks) sintering is determined from density measurements. The densities of the sintered specimens are listed in Table II for Mn and Ni. These densities were obtained with the Archimedes method in water. For less than full density there is the possibility of water or air bubbles in the pores reducing the accuracy of the measurement. Measurements of the dimensions for these disks as they come from the die also have a significant error, thus the densities must be considered as indicative and not definitive. The density of both Ni and Mn with no disks and with the same time and temperature profile is about 90% of full density. The density for Mn isolated by the disks is also about 90%, while the density of Ni is significantly less, about 75%. This is consistent with the better absorption of radiated rf emission for the Mn than for the rf shielding that the Ni with lower resistivity provides. In the normal (no-disks) case for Ni, the pulsed current through the sample will generate rf in the Ni enhancing the densification.
x-ray line FWHM and sintered density of Ni and Mn specimens with and without Al2O3 disks.

x-ray measurements
x-ray diffraction measurements are shown in Table II for the Ni and Mn specimens. For Ni specimens, the full width at half maximum (FWHM) of the peak corresponding to hkl = (011) shows that with the addition of the Al2O3 disks, the x-ray peaks become broader. The value of the FWHM can be used to estimate the grain size in a solid, given by Scherrer equation.[ Reference Cullity and Stock 5 ] Basically, the grain size is inversely proportional to the FWHM. Thus for Ni specimens, adding Al2O3 disks would lead to a lower densification, in agreement with the density values.
Similar results were obtained for Mn specimens. The hkl = (221) peak was selected. As shown in Table II, for Mn with disks, both density and FWHM indicate that the specimens are less well sintered than in the case without disks, but better sintered than for Ni with disks.
Discussion
The Al2O3 disks, top and bottom of the specimen, clearly limit the current pulses from passing through the specimen as demonstrated by the higher temperature rise in the die from additional Joule and rf emission heating in the die. The temperature difference measured in the die after about 10 min pulsing at 100 A shows a temperature rise of 100 °C greater when the Ni specimen is isolated from the current flow with the Al2O3 disks but not from the radiated rf emission generated in the surrounding die. For Mn the temperature rise is about one-half that and indicates that more energy is being lost from the die with the Mn specimen. This is consistent with the view that more radiated rf emission is being absorbed by the Mn that has about 16 times the resistivity of the Ni. And it suggests that the more than a factor of 10 higher thermal conductivity for Ni is less effective than the rf emission radiation in transferring energy to the Ni specimen with disks even though the Al2O3 disks also have a fairly high thermal conductivity. Comparing the Ni and Mn temperature rise when no disks are used, very similar values of 200 °C are measured in the die after the 10 min at 100 A current as both Joule and rf emission heating occur within the specimen in addition to the heat transferred and the rf emission radiated from the die.
As seen from Table II the densities measured are consistent with greater radiated rf absorption by the Mn with disks, resulting in a higher fractional density. A lower fractional density of the Ni with disks is consistent with rf shielding by the lower resistivity.
The x-ray FWHM data show a decrease of densification to about 90% for both Ni and Mn specimens compared with a normal sintering temperature and time. With Al2O3 disks in place the greater densification for Mn compared with Ni with the disks provides additional support for the greater electromagnetic radiation absorption by the Mn.
Conclusion
The electromagnetic radiation spectrum at radio frequencies from 10 to 400 kHz was determined to occur from the steep onset rise of the current pulse in the Dr. Sinter™ PECS process. Isolating the pulsed current flow through specimens of Ni and Mn with an insulating disk above and below the specimen restricted the in-specimen rf emission and Joule heating. Without the Joule heating in the specimen the rf emission radiated to the specimen from the pulsed current in the die and punch increased the fraction of rf energy to the specimen as determined by the temperature rise in the die. The Mn and Ni thermal conductivity and resistivity properties supported the temperature versus time differences when a similar current versus time profile for specimens with and without insulating disks was applied. The densification for the Ni and Mn specimens agree with the different measured temperature rise in the die and the absorption of the radiated electromagnetic rf emission from the die based on the higher resistivity and lower thermal conductivity of the Mn. The importance of the electromagnetic radio frequency emission in the sintering process of the PECS with the Dr. Sinter™ system was demonstrated. These results suggest an opportunity to advance the sintering process by tuning and controlling the electromagnetic radiation in pulsed electric current sintering. The PECS process would also be adaptable to larger specimens since in the normal sintering process the pulsed current and thus the electromagnetic rf emission and Joule heating are generated within the specimen.
Acknowledgments
We thank Professor Terry Tritt for the use of the Dr. Sinter™ and his support of this study. Y.F.L. and D.H.L. acknowledge useful discussions with Dr. Jian He and support of his NSF DMR 1307740 grant for Y.F.L. We thank Dr. Dale Hitchcock and Mr. Roger Livingston who participated in the study of the frequency spectrum of the rf emission using the Tektronix instrument on loan from the Savannah River DOE facility.