 tilt Fe grain-boundaries (GBs) with and without hydrogen (H) segregation, to investigate the mechanisms of GB embrittlement enhanced by H segregation. Premature fracture was found in the H-segregated GB, compared with the clean GB, in the tensile test simulations. The Fe–H bond showed covalent-like and ion-like characteristics. The covalent-like characteristics reinforced the Fe–Fe bonds, but the ion-like characteristics weakened the Fe–Fe bonds as a result of charge transfer. The effect of the latter increased with increasing strain, and prevailed over the former, resulting in GB embrittlement. In the shear test simulations, variation in the GB energy for the H-segregated GB was almost the same as that for the clean GB. This is because bond-breaking and rebonding occur concurrently in GB shearing and the variations in charge transfer during shear straining are less than those during tensile straining.
I. INTRODUCTION
Grain-boundary (GB) embrittlement in metals is often enhanced by impurity segregation at the GBs. Hydrogen (H)-induced GB embrittlement is one of the most critical problems in GB embrittlement, and it is still under debate.Reference Nagumo1, Reference Sofronis and Robertson2 McMahon showed that there are two types of H-induced GB embrittlement of steels: one is related to a combination of H and other impurities segregated at the GBs and the other results from the presence of H atoms only.Reference McMahon3 H atoms dissolve in the GB and presence of only the H atoms causes GB embrittlement because iron hydrides are not formed except under the limited conditions of high pressure and temperature.Reference Tkacz4 In such a situation, the effects of impurities on GB embrittlement can be estimated using the Rice–Wang thermodynamics model,Reference Rice and Wang5 in which the GB embrittlement is enhanced by impurities when the segregation energy at the free surface is lower than that at the GB. H segregation reduces the surface energy more than it reduces the GB energy,Reference Zhong, Wu, Freeman and Olson6, Reference Lu, Orlikowski, Park, Politano and Kaxiras7 which agrees with the observed enhancement of GB embrittlement by H segregation. Recently, Yamaguchi et al.Reference Yamaguchi, Ebihara, Itakura, Kadoyoshi, Suzuki and Kaburaki8 investigated the “mobile” effect of H on GB embrittlement, based on the Rice–Wang thermodynamics model. Also, Farkas et al.Reference Farkas, Nogueira, Ruda and Hyde9 showed by dynamic simulations of GB fracture of Fe that a crack proceeds without deflection to the inside of the grains in H-segregated Fe GBs. Mechanisms of the enhanced embrittlement of Fe GBs by H segregation have been investigated from the viewpoint of electronic structure, and it has been demonstrated that a charge transfer mechanism is responsible for the H-induced GB embrittlement of Fe.Reference Zhong, Wu, Freeman and Olson6, Reference Itsumi and Ellis10, Reference Gesari, Pronsato and Juan11 The electron populations of Fe–Fe bonds in the GB plane can be decreased by 60% by charge transfer,Reference Gesari, Pronsato and Juan11 where the 4s and 4p electrons play a dominant role.Reference Itsumi and Ellis10 The H–Fe bonding is ion-like,Reference Zhong, Wu, Freeman and Olson6 indicating that the charge transfer is due to ion-like characteristics. Gesari et al.Reference Gesari, Irigoyen and Juan12 showed the restrained H-induced embrittlement of Σ5(013) Fe GB by addition of carbon (C) or boron (B) because of a strong repulsive interaction of C–H and B–H.
Recently, the variations in electronic structure during straining have been investigated using first-principles fully relaxed tensile tests to gain a deeper understanding of GB embrittlement enhanced by impurity segregation.Reference Lu, Zhang, Deng, Wang, Kohyama, Yamamoto, Liu, Horikawa and Kanno13–Reference Yuasa and Mabuchi17 In general, the mechanisms of GB embrittlement enhanced by impurity segregation can be classified into two types: one is the decohesion mechanism,Reference Briant and Messmer18, Reference Messmer and Briant19 for example, in which the metal–metal bond is weakened as a result of charge transfer, and the other is the bond mobility mechanism,Reference Haydock20–Reference Goodwin, Needs and Heine22 for example, in which the mobility of atoms is limited by strong covalent bonding. The calculations by first-principles fully relaxed tensile tests revealed that the first bond-breaking occurs at the Fe–Fe bond around the impurity atom due to the weakened Fe–Fe bond in the decohesion mechanism,Reference Yuasa and Mabuchi16 while in the bond mobility mechanism, it occurs at the Fe–impurity bond, in spite of the high charge density of the Fe–impurity bond.Reference Yuasa and Mabuchi17 In the present work, first-principles fully relaxed tensile tests are performed on H-segregated  tilt Fe GBs and the bond-breaking events are investigated from the viewpoint of variations in electronic structure during straining. Some studies have been performed on H-segregated Σ3 Fe GBs so far,Reference Zhong, Wu, Freeman and Olson6, Reference Yamaguchi, Ebihara, Itakura, Kadoyoshi, Suzuki and Kaburaki8, Reference Itsumi and Ellis10 but to the authors’ knowledge, there are no other studies by first-principles fully relaxed tensile tests on H-segregated Σ3 Fe GBs. The present work by first-principles fully relaxed tensile tests reveals that the first bond-breaking site is not the Fe–Fe bond closest to the H atom because of the variations in electronic structure during straining. This finding highlights the importance of dynamic variations during straining for GB embrittlement. In addition, in the present work, first-principles shear tests are performed on the same Fe GBs to investigate the effects of H segregation on GB shearing.
II. COMPUTATIONAL METHOD
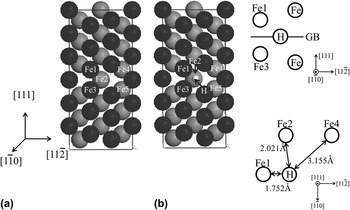
Two body-centered cubic (bcc) Fe cells with a  tilt GB were used: one was a cell without H segregation at the GB (clean GB model), and the other was a cell with H segregation at the GB (H-segregated GB model), where a H atom was located in an energetically stable interstitial site,Reference Zhong, Wu, Freeman and Olson6, Reference Yamaguchi, Ebihara, Itakura, Kadoyoshi, Suzuki and Kaburaki8, Reference Itsumi and Ellis10 as shown in Fig. 1. The GB energy of
 tilt GB is relatively high (= 1.74 J/m2), which is comparable with those of random boundaries. The initial cell size was 4.05 Å × 7.02 Å × 14.89 Å. Geometry optimization calculations were performed using the Cambridge Serial Total Energy Package (CASTEP),Reference Payne, Teter, Allan, Arias and Joannopoulos23, Reference Hohenberg and Kohn24 in which density functional theoryReference Hohenberg and Kohn24, Reference Kohn and Sham25 was used with a plane-wave basis set to calculate the electronic properties of the solids from first-principles. The exchange–correlation interactions were treated using the spin-polarized ferromagnetic version of the generalized gradient approximation within the Perdew–Burke–Ernzerhof scheme.Reference Perdew, Burke and Ernzerhof26 Ultrasoft pseudopotentialsReference Vanderbilt27, Reference Fischer and Almlof28 represented in reciprocal space were used for all elements in the calculations. The cutoff energy for the plane-wave basis set was 300 eV. The Brillouin zone was sampled using a Monkhorst-Pack 6 × 4 × 2 k-point meshReference Monkhorst and Pack29 and Gaussian smearing with a 0.1-eV width. These simulation conditions were determined as stipulated in Ref. Reference Yamaguchi, Ebihara, Itakura, Kadoyoshi, Suzuki and Kaburaki8.
Unit cell model of Fe with a  tilt grain boundary. In the present study, two cells are used: one (a) is the cell without H segregation at the grain boundary (clean GB model) and the other (b) is the cell with H segregation at the grain boundary (H-segregated GB model). The locations of atoms in the H-segregated GB model are shown in detail on the right-hand side. The Fe1–Fe3, Fe1(Fe3)–Fe2, Fe2–Fe4(Fe5), and Fe4–Fe5 bonds are the first-, second-, third-, and fourth-neighbor Fe–Fe bonds, respectively, to the H atom in the H-segregated GB model.

After the geometry optimization calculation, including cell optimization, a uniaxial tensile strain with an increment of 2% in the [111] direction, which was normal to the GB plane, was applied to the cells for the first-principles fully relaxed tensile tests. The lattice dimensions in the GB plane were fixed, neglecting Poisson’s ratio to simplify the calculations.Reference Lu, Zhang, Deng, Wang, Kohyama, Yamamoto, Liu, Horikawa and Kanno13–Reference Yuasa and Mabuchi17 This step was repeated until GB fracture occurred. In each step, all atomic positions were optimized in accordance with Hellmann–Feynman forces until all the forces were less than 0.03 eV/Å. In the present study, bond-breaking was determined from a rapid increase in bond length.
In the first-principles shear tests, shearing was simulated by shifting one grain with respect to the other, corresponding to the translation vectors of 1/20 of the  direction of the cell, and then relaxing the structure without cell optimization. The atoms in two layers in the middle of each grain were fixed to their bulk positions during the geometry optimization, while all the other atoms were allowed to be relaxed under the same conditions as in the tensile tests.Reference Molteni, Francis, Payne and Heine30, Reference Molteni, Marzari, Payne and Heine31
III. RESULTS AND DISCUSSION
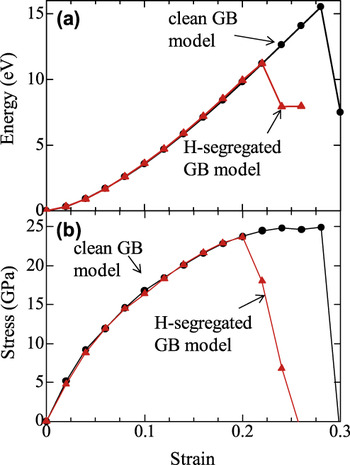
Figure 2(a) shows the total energy of the unit cell as function of tensile strain for the clean GB and H-segregated GB models. The maximum energy was 15.5 eV for the clean GB model and 11.2 eV for the H-segregated GB model, respectively. Clearly, the fracture energy for tensile deformation was reduced by the H segregation. The stress–strain curves are shown in Fig. 2(b) for the clean GB and H-segregated GB models. The flow stress for the H-segregated GB model was almost the same as that for the clean GB model up to 20% strain. In the clean GB model, the stress gradually increased with increasing strain until the strain reached 28%, but the stress rapidly decreased at 28–30%, and finally GB fracture occurred at 30%. In the H-segregated GB model, the stress rapidly decreased at 20–24%, and finally GB fracture occurred at 26%. Clearly, the H segregation enhanced the Fe GB embrittlement. The calculated ΔE GB–ΔE SF for the H segregation in Fe was 0.39 eV/atom, where ΔE GB is the segregation energy at the GB and ΔE SF is the segregation energy at the free surface. In this case, the difference between the segregation energies of the GB and the free surface was calculated in the static case, where the fracture surface was arbitrarily set between the two atomic layers in the GB. However, the difference in segregation energies may not be correctly estimated in the static case, because the configuration of the atoms is changed during straining. In the present work, the difference in segregation energies was calculated in the dynamic case, where the fracture surface was the surface after GB fracture, by the first-principles fully relaxed tensile test. As a result, ΔE GB–ΔE SF for H segregation in Fe was 0.41 eV/atom. Thus, the calculations in both the static and dynamic cases showed that H is a GB embrittler of Fe.Reference Zhong, Wu, Freeman and Olson6 The maximum stress was about 25 GPa for the clean GB model, as shown in Fig. 2(b). This roughly agrees with the result of first-principles calculations by Yamaguchi.Reference Yamaguchi32 These calculated values are too large, when compared with experimental values. This is because inelastic deformation related to dislocations cannot be treated by the first-principles calculations.
Energy-strain curves (a) and Stress–strain curves (b) of the clean GB and H-segregated GB models calculated from first-principles fully relaxed tensile tests.

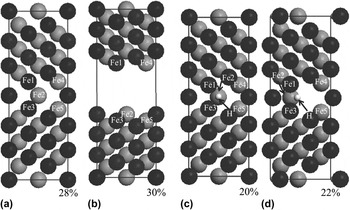
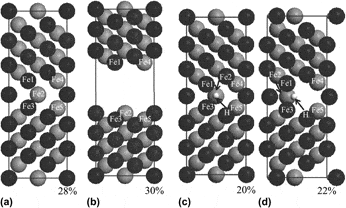
The atomic configurations of  at 28% and 30% in the clean GB model and at 20% and 22% in the H-segregated GB model are shown in Fig. 3. In the clean GB model, no bond-breaking occurred at 28%, and the Fe1–Fe2, Fe1–Fe3, Fe2–Fe4, and Fe4–Fe5 bonds were broken at 28–30%. In the H-segregated GB model, however, the Fe2–Fe4 and Fe2–Fe5 bonds were broken at 20–22%, and then the Fe4–Fe5 bond was broken. The Fe1–Fe3, Fe1(Fe3)–Fe2, Fe2–Fe4(Fe5), and Fe4–Fe5 bonds were the first-, second-, third- and fourth-neighbor Fe–Fe bonds, respectively, to the H atom in the H-segregated GB model. Note that the third- and fourth-neighbor Fe–Fe bonds to the H atom were broken more readily than the first- and second-neighbor Fe–Fe bonds to the H atom in the H-segregated GB model.
Fully relaxed atomic configurations of  : (a) and (b) are the atomic configurations at 28% and 30% in the clean GB model, and (c) and (d) are the atomic configurations at 20% and 22% in the H-segregated GB model. Note that the site for the first bond-breaking in the H-segregated GB model is different from that in the clean GB model.

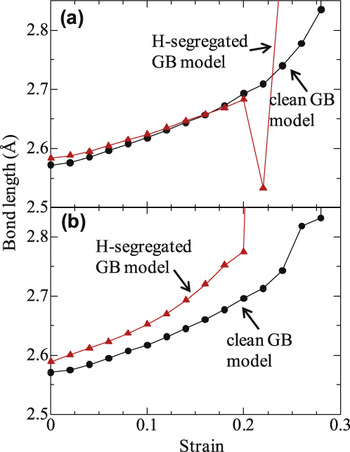
Variations in lengths of the (a) Fe1–Fe2 bond and (b) Fe2–Fe4 bond as a function of strain in the clean GB and H-segregated GB models.

The variations in bond length of (a) the Fe1–Fe2 bond and (b) the Fe2–Fe4 bond as a function of strain are shown in Fig. 4. The bond length of Fe1–Fe2 prior to straining in the H-segregated GB model was a little longer than that in the clean GB model, but the difference in the Fe1–Fe2 bond length decreased with increasing strain and became negligibly small at 10%. In contrast, the bond length of Fe2–Fe4 prior to straining in the H-segregated GB model was a little longer than that in the clean GB model, and the difference in Fe2–Fe4 bond length increased with increasing strain. The variations in bond length during straining reflect variations in the strength of the atomic bonding.Reference Lu, Zhang, Deng, Wang, Kohyama, Yamamoto, Liu, Horikawa and Kanno13–Reference Yuasa and Mabuchi17 The H atom affected the Fe2–Fe4 bond more strongly than it affected the Fe1–Fe2 bond, although the Fe2–Fe4 bond was farther away from the H atom than the Fe1–Fe2 bond was.
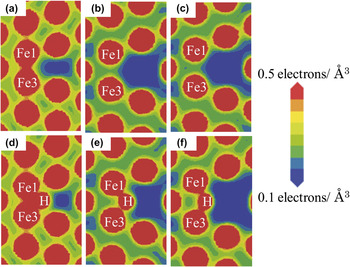
Charge-density distributions of  : (a), (b), and (c) show the charge-density distributions at 0%, 10%, and 22%, respectively, in the clean GB model, and (d), (e), and (f) show the charge-density distributions at 0%, 10%, and 22%, respectively, in the H-segregated GB model. The H atom reinforces the Fe1–Fe3 bond in the H-segregated GB model.

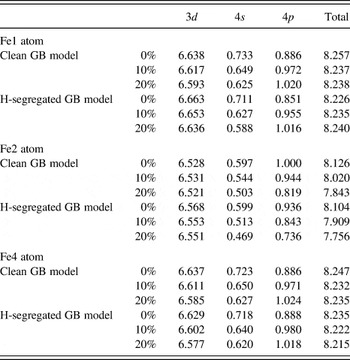
The occupation numbers at 0%, 10%, and 20% of the Fe1, Fe2, and Fe4 atoms were investigated to estimate the variations in charge transfer during straining. The results are listed in Table I. The descending order of total occupation numbers in the clean GB model prior to straining was Fe1 > Fe4 > Fe2. The total occupation number decreased with increasing strain for all Fe atoms, but the total occupation number order of Fe1 > Fe4 > Fe2 did not change during straining in the clean GB model. In the H-segregated GB model, it was noted that the total occupation number of the Fe1 atom was increased by straining; the 4p electrons played an important role in the increased occupation number of Fe1.Reference Itsumi and Ellis10 In contrast, the total occupation numbers of Fe2 and Fe4 in the H-segregated GB model were decreased by straining. The decreases in the total occupation numbers of Fe2 and Fe4 by straining in the H-segregated GB model were larger than those in the clean GB model. The order of the total occupation numbers changed from Fe4 > Fe1 > Fe2 to Fe1 > Fe4 > Fe2 as a result of strain in the H-segregated GB model. The changes in charge transfer during straining correspond to the fact that the Fe2–Fe4 and Fe4–Fe5 bonds were broken more readily than the Fe1–Fe2 and Fe1–Fe3 bonds in the H-segregated GB model. Thus, the bond-breaking sites in the H-segregated GB model were affected by the changes in charge transfer during straining.
Occupation numbers for 3d, 4s, and 4p electrons of the Fe1, Fe2, and Fe4 atoms in the clean GB model and the H-segregated GB model. The electron occupation number is calculated by integrating the PDOS to the Fermi energy.

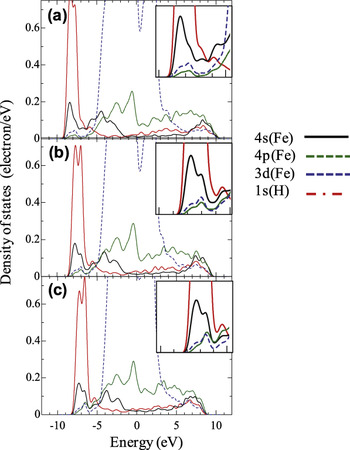
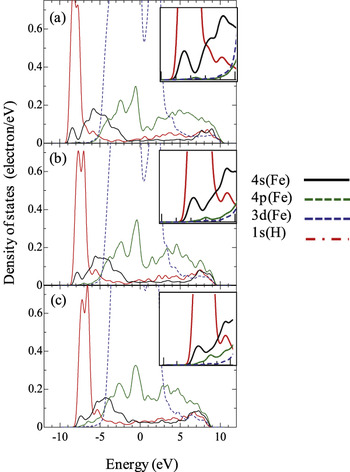
Figure 5 shows the charge-density distributions of  at 0%, 10%, and 22%. The H atom strongly bonded with the Fe1 and Fe3 atoms, and reinforced the Fe1–Fe3 bond in the H-segregated GB model. The partial density of states (PDOS) of the Fe1 and H atoms at 0%, 10%, and 20% in the H-segregated GB model are shown in Fig. 6. Hybridization peaks were observed at −9 eV to −7 eV in the Fe1 and H atoms. The s electrons played a vital role in hybridization.Reference Itsumi and Ellis10 The number of electrons related to the hybridization in Fe1 at 10% was larger than that at 0%, and decreased little at 20%. The covalent-like characteristics are probably responsible for the strong interaction of the Fe1(Fe3)–H bond. It is known that P segregation enhances the GB embrittlement of Fe [33–36]. In the P-segregated Fe GB, because the Fe–P bond has intense covalent-like characteristics, the mobility of electrons is limited, resulting in premature breaking of the Fe–P bond.Reference Yuasa and Mabuchi17 In contrast, no premature breaking of the Fe–H bond was found in the H-segregated Fe GB. This suggests that the covalent-like characteristics of the Fe–H bond are rather weak.
PDOS of the Fe1 and H atoms in the H-segregated GB model: (a) 0%, (b) 10%, and (c) 20%. The Fermi level is defined as the zero of energy. Magnified figures of the PDOS in the range −10 eV to −5 eV are shown on the upper right. Hybridization peaks are observed at −9 to −7 eV in the Fe1 and H atoms.

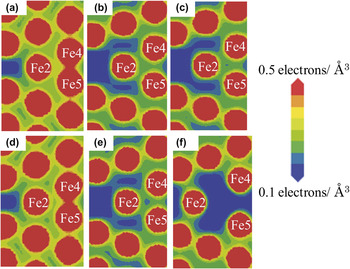
Charge-density distribution of  with strain: (a), (b), and (c) show the charge-density distributions at 0%, 10%, and 22%, respectively, in the clean GB model, and (d), (e), and (f) show the charge-density distributions at 0%, 10%, and 22%, respectively, in the H-segregated GB model. Note that the charge density between Fe2 and Fe4(Fe5) in the H-segregated GB model decreases more during straining than it does in the clean GB model.

Figure 7 shows the charge-density distributions of  at 0%, 10%, and 22%. The charge densities between Fe2 and Fe4(Fe5), and between Fe4 and Fe5, decreased during straining in the clean GB model, but the breaking of these bonds did not occur at 22%. In contrast, the charge density between Fe2 and Fe4(Fe5) in the H-segregated GB model decreased more during straining than it did in the clean GB, and the Fe2–Fe4(Fe5) bond was broken at 22%. The breaking of the Fe2–Fe4(Fe5) bond accelerated breaking of the Fe4–Fe5 bond, although the Fe2 atom bonded with other Fe atoms after breaking of the Fe2–Fe4 bond. Thus, breaking of the Fe2–Fe4(Fe5) bond was enhanced in the H-segregated GB model. This is due to larger decreases in the total occupation numbers of Fe2 and Fe4(Fe5) in the H-segregated GB model, as shown in Table I. The PDOSs of the Fe4 and H atoms at 0%, 10%, and 20% in the H-segregated GB model are shown in Fig. 8. The hybridization peak of the s electrons was found in the Fe4 and H atoms, as well as in the Fe1 and H atoms. However, the number of electrons related to hybridization in Fe4 was lower than that in Fe1, and was more reduced by strain.
PDOS of the Fe4 and H atoms in the H-segregated GB model: (a) 0%, (b) 10%, and (c) 20%. The Fermi level is defined as the zero of energy. The magnified figures of the PDOS in the range −10 eV to −5 eV are shown on the upper right.

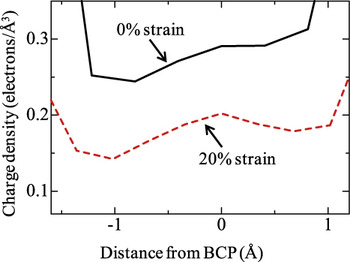
Charge densities along the line, which is normal to the Fe2–Fe4 bond, from the BCP at 0% and 20% in the H-segregated GB model. The charge-density curve at 20% is not flat at the BCP, as well as the charge-density curve at 0%.

Breaking of a metallic bond occurs through the transition state of a comparatively flat charge density at the bond critical point (BCP).Reference Eberhart, Clougherty and Maclaren37Figure 9 shows the charge densities along the line, which is normal to the Fe2–Fe4 bond, from the BCP at 0% and 20% in the H-segregated GB model. The charge-density curve at 20% was not flat at the BCP, as well as the charge-density curve at 0%, suggesting that the Fe2–Fe4 bond had covalent-like characteristics. However, the breaking of the Fe2–Fe4 bond occurred readily, as shown in Fig. 3. It is therefore suggested that significant decreases in charge density around the Fe2 and Fe4 atoms, as a result of charge transfer, prevail over the covalent-like characteristics.
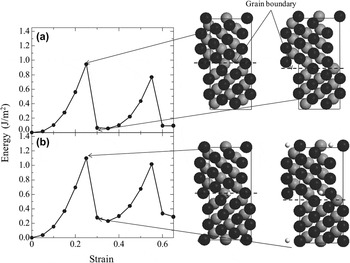
Variations in GB energy as a function of strain and atomic configurations of  during shearing from first-principles shear tests: (a) clean GB model and (b) H-segregated GB model. Periodicity in the energy–strain relation is found for the H-segregated GB model as well as for the clean GB model.

Lu et al.Reference Lu, Zhang, Kioussis and Kaxiras38 investigated the H-enhanced local plasticity mechanism of Al using shear test simulations, where the dislocation core structure is changed by the presence of H impurities, and the Peierls stress is reduced by more than an order of magnitude. Hence, it is interesting to investigate the effects of H on GB shearing behavior using shear test simulations. The variations in GB energy and atomic configurations of  during shearing are shown in Fig. 10. Cahn et al.Reference Cahn, Mishin and Suzuki39, Reference Cahn, Mishin and Suzuki40 showed that normal GB motion is coupled to tangential translation of grains and produces GB shearing, conversely, GB shearing induces normal GB motion. The coupling GB motion was found in both Fe GB models. Note that the coupling GB behavior did not depend on the presence of H. Recently, Hyde et al.Reference Hyde, Farkas and Caturla41 showed by molecular dynamics simulations that nucleation of GB dislocations is enhanced by H impurity. As shown in Fig. 10, however, the enhanced GB shearing by H impurity was not found because events related to dislocations could not be treated in the first-principles calculations, and the variation in the GB energy for the H-segregated GB model was almost the same as that for the clean GB model. This may be because of an offset of the strengthened Fe–H bonds as a result of the covalent-like characteristics and the weakening of Fe–Fe bonds caused by charge transfer.
Another important result in Fig. 10 is that periodicity in the energy–strain relation was found for the H-segregated GB model as well as for the clean GB model. Although the periodicity effect is entirely geometrical and depends on the GB structure,Reference Cahn, Mishin and Suzuki40 the periodicity is usually found in metallic bondingReference Molteni, Francis, Payne and Heine30, Reference Molteni, Marzari, Payne and Heine31 because it arises when the GB structure recovers its original form during shearing. The fact that the periodicity was found for the H-segregated GB model indicates that the covalent-like characteristics of Fe–H bonds played a minor role in GB shearing. Large variations in charge transfer during straining were found in GB fracture by tensile straining, which is responsible for the lower fracture energy for tensile deformation in the H-segregated GB model, as shown in Fig. 2. However, bond-breaking and rebonding occur concurrently in GB shearing; therefore, large variations in charge transfer during straining are not found, resulting in minor difference in GB energy between the H-segregated GB model and the clean GB model, as shown in Fig. 10. This explains why H segregation enhances GB embrittlement, but has little effect on GB shearing.
John et al.Reference John and Gerberich42 investigated effects of the loading mode on H-induced embrittlement and they demonstrated that Fe alloy was more susceptible to H-induced embrittlement in the tensile stress condition than in torsional stress condition, namely, the critical load for failure of the specimen with H charging was approximately one-sixth lower than that without H charging in the tensile stress condition, however, the difference between the specimens with and without H charging was only 14% in the torsional stress condition. In addition, they demonstrated from fractography that the intergranular fracture was induced by H-charging in the tensile stress condition, but not in the torsion stress condition. The simulation results in the present work are in good agreement with these experimental results.
IV. SUMMARY
We performed first-principles fully relaxed tensile and shear test simulations on  tilt Fe GBs, with and without H segregation, to investigate the mechanisms of GB embrittlement enhanced by H segregation. Calculations of tensile tests revealed that H is a GB embrittler of Fe, which agreed with estimates based on the Rice–Wang thermodynamics model. The Fe–H bond showed not only metallic bonding characteristics, but also covalent-like and ion-like characteristics. The covalent-like characteristics reinforced the Fe–Fe bonds, while the ion-like characteristics weakened the Fe–Fe bonds as a result of charge transfer. The variations in charge transfer with strain were enhanced by H, and the effects of charge transfer prevailed over the effects of the covalent-like characteristics, resulting in GB embrittlement enhanced by H segregation. It was found from the shear test simulations that the effect of H on GB shearing was less than the effect of H on GB fracture. This is because bond-breaking and rebonding take place concurrently in GB shearing and the variations in charge transfer during shear straining are fewer than those during tensile straining.
ACKNOWLEDGMENTS
This work was supported by a Grant-in-Aid for JSPS Fellows (22·5568). Computation time was provided by the SuperComputer Laboratory, Institute for Chemical Research, Kyoto University.
 0](111) grain boundary